COVID-19

SARS-CoV-2 Update

It’s time for our next 14-day moving average determinations for SARS-CoV-2 for the United States and my thoughts on vaccines, SARS-CoV-2 therapeutic agents and mutant viruses. We use the WORLDOMETERS aggregators data set to make any projections since it includes data from the Department of Veterans Affairs, the U.S. Military, federal prisons and the Navajo Nation.

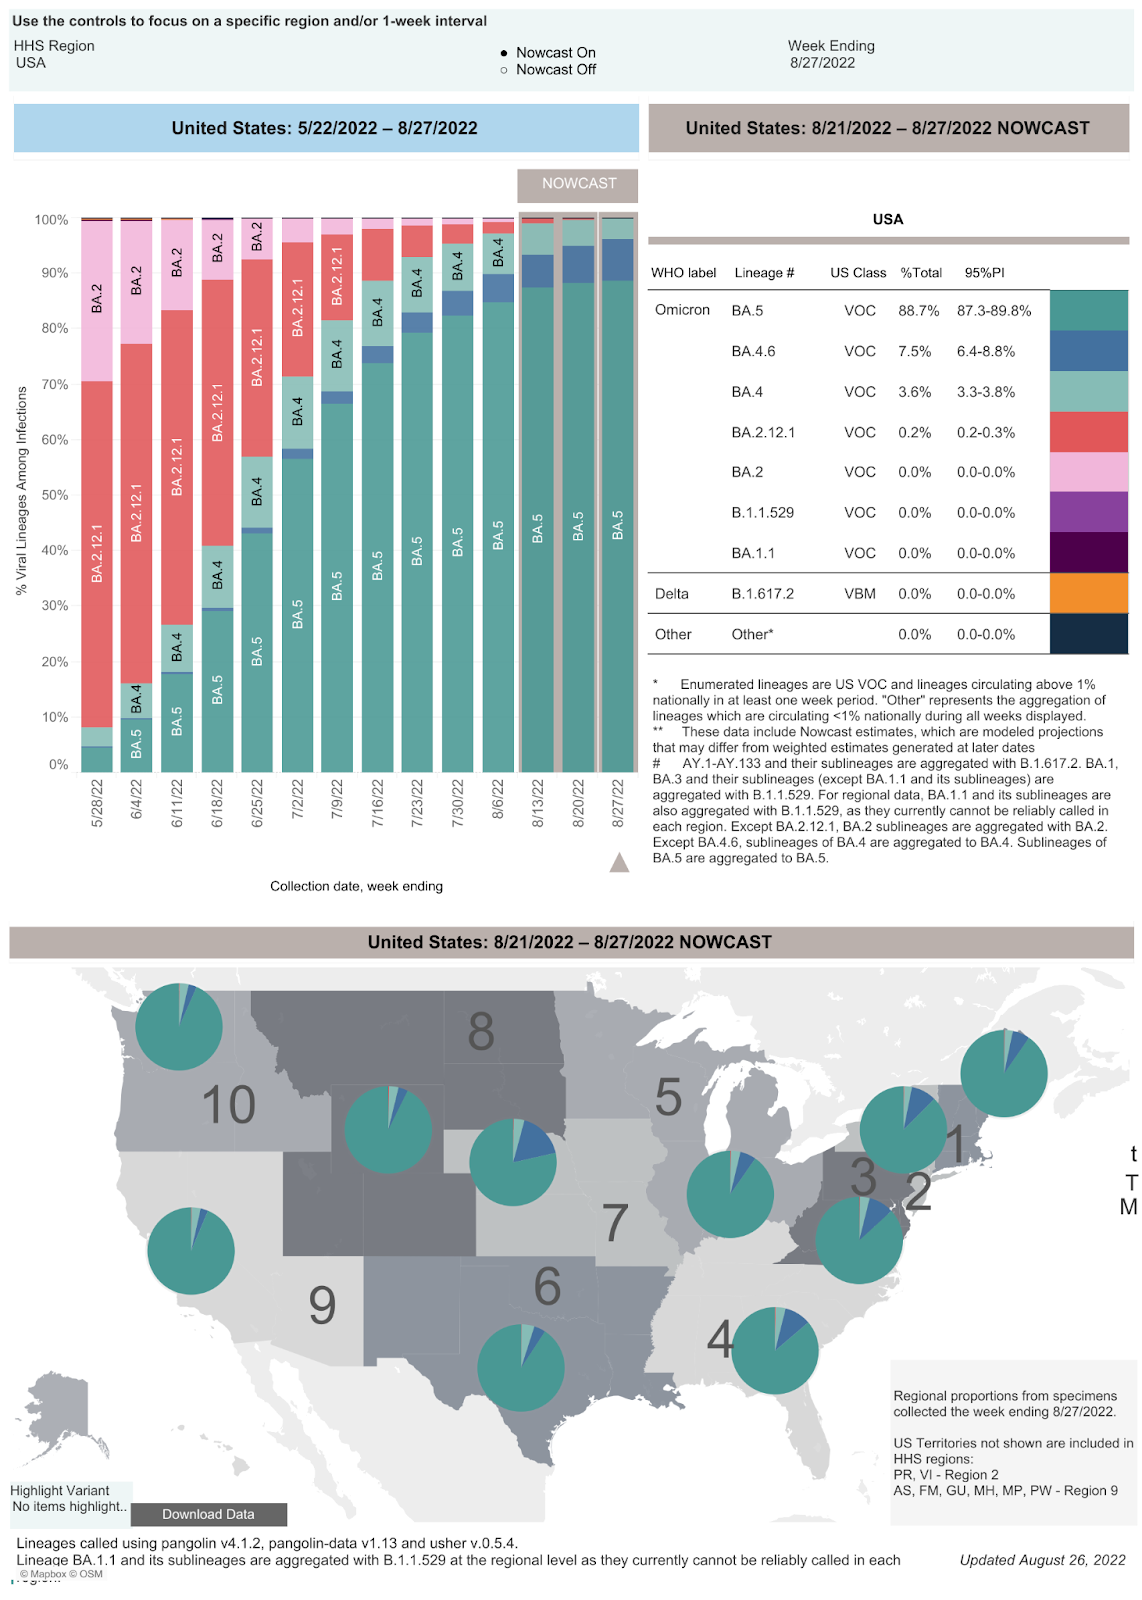
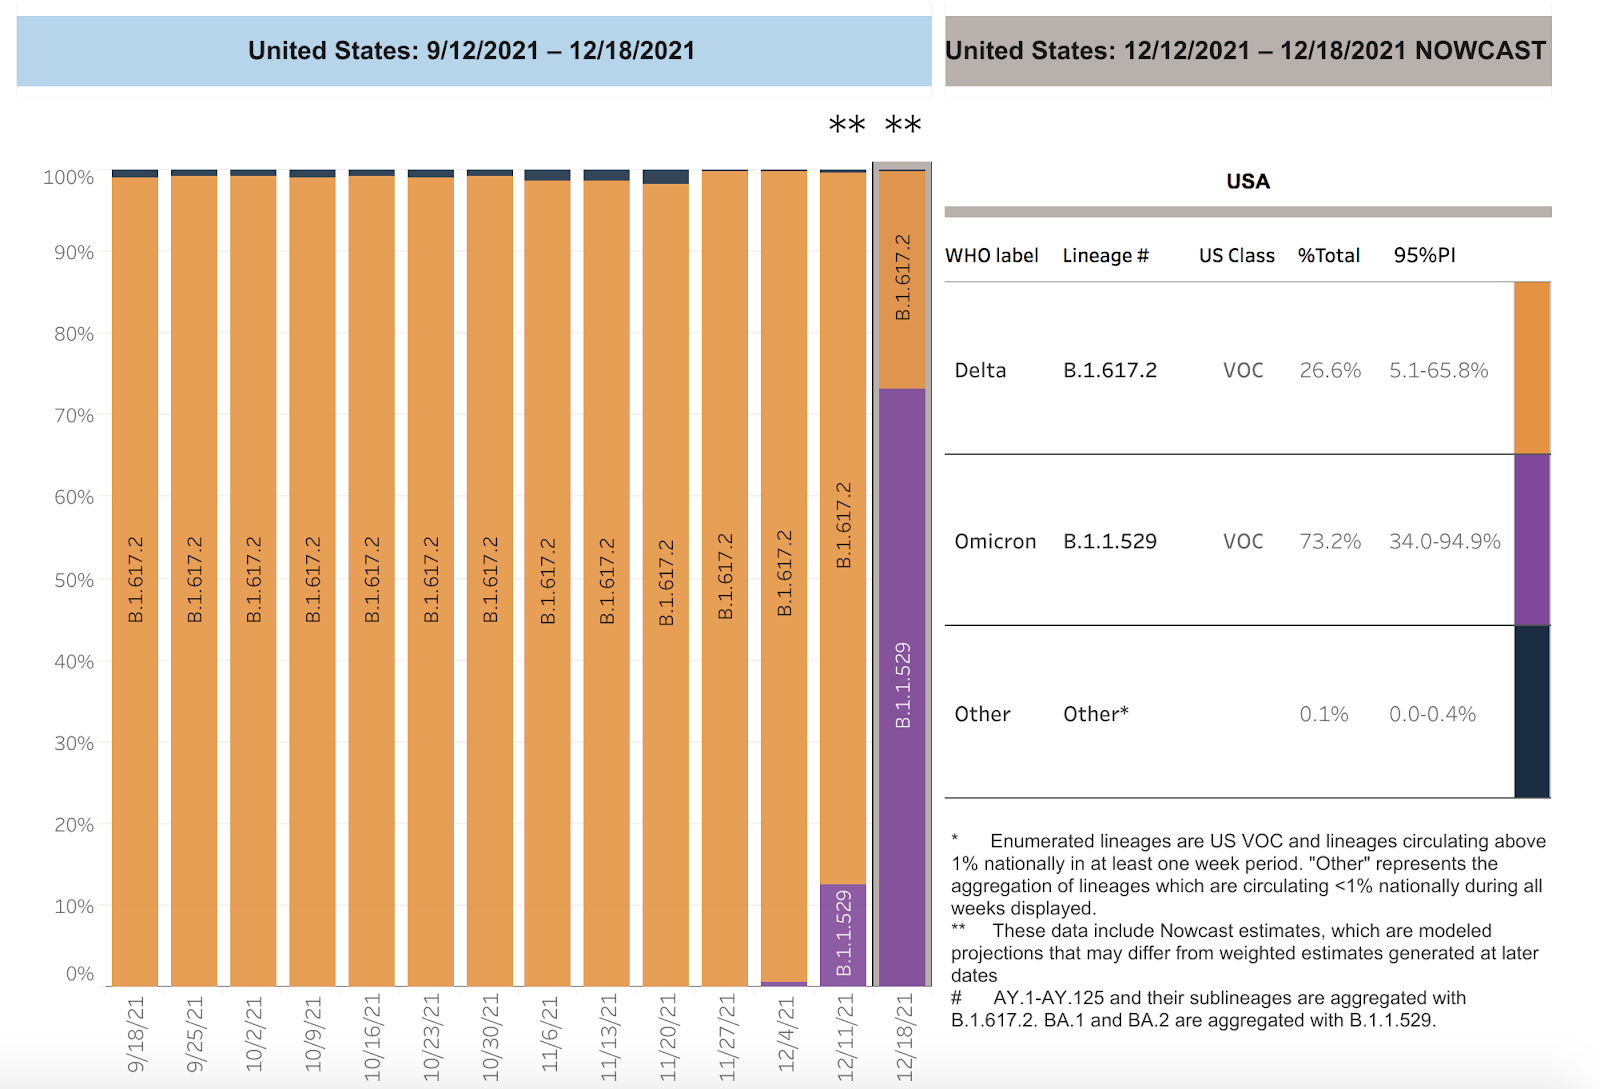
SARS-CoV-2 infections per day in the United States have increased for the first time in 14 weeks. There is still widespread underreporting by states, a failure to capture positive home tests, and a decreased PCR screening program in most states. Deaths per day in the United States have increased by 34 deaths per day. Many states are not reporting deaths or infections in a timely manner. The number of infections per day has increased by 1,683.  The CDC estimates that BA.5 accounted for 39.2% (a 23% drop from 10/21/22), BQ.1 accounted for 16.5% (a 7.1% increase since 10/21/22), BQ.1.1 accounted for 18.8% (a 11.6% increase since 10/21/22), BA.4.6 accounted for 9.5%, BF.7 accounted for 9%,  BA.2.75.2 accounted for 1.3%, and BA.4 accounted for 0.2%. In the week ending November 5, 2022 BQ isolates accounted for 35.3% of infections. BQ.1.1 has five spike mutations that are different from BA.5. Four of these mutations allow escape from immunity from monoclonal antibodies, any prior infection (including BA.5), or any vaccine to include a BA.5 vaccine. 

CDC
CDC

The total percentage of BQ variant infections in the region that includes New York and New Jersey was 28.4% two weeks ago and is now 52.3%. BA.5.2.6 isolates now account for 3.1% of cases. The BA.2.75 lineages account for 4.2%. 

CDC

The total percentage of BQ variant infections in the region that includes Pennsylvania, Delaware, Maryland, West Virginia, and Virginia was 17.8% two weeks ago and is now 36.6%. BA.5.2.6 isolates now account for 3.4% of cases. The BA.2.75 lineages account for 3% of cases. 

CDC

The total percentage of BQ variant infections in the region that includes California, Nevada, Arizona, and Hawaii was 13.6% two weeks ago and is now 36.9%. BA.5.2.6 isolates now account for 2.4% of cases. The BA.2.75 lineages account for 4.2%. 

Data on the rapid spread of a dangerous variant category, the BQ variants, was withheld by the CDC in their weekly reports until three weeks ago. The data on BQ.1 and BQ.1.1, the last being a variant with five significant spike protein mutations leading to escape from immunity from prior infections or vaccination. In addition, our monoclonal antibody therapies do not work for these isolates. Infections and hospitalizations in New York are rapidly increasing, secondary to BQ variants. BQ variants have been found in all 10 regions in the United States. Since New York has been a harbinger of things to come throughout the pandemic, we expect the pattern of increased infections, hospitalizations and deaths to continue in many states. These emerging BQ variants are descendants of BA.5. It’s troubling that, despite the availability of a BA.5 bivalent SARS-CoV-2 vaccine, few people are getting vaccinated. As of November 2, 2022, the CDC reports that only 26,378,963 people have received the bivalent vaccine. The Pfizer Omicron BA.5 mRNA booster was administered to 16,748,737 people and the Moderna Omicron BA.5 mRNA booster was administered to 9,630,226 people. In total, 26.3 million people (5 years and up) have received the bivalent vaccine. That’s only 11.6% of people who received the primary series and 7.9% of the overall population.  

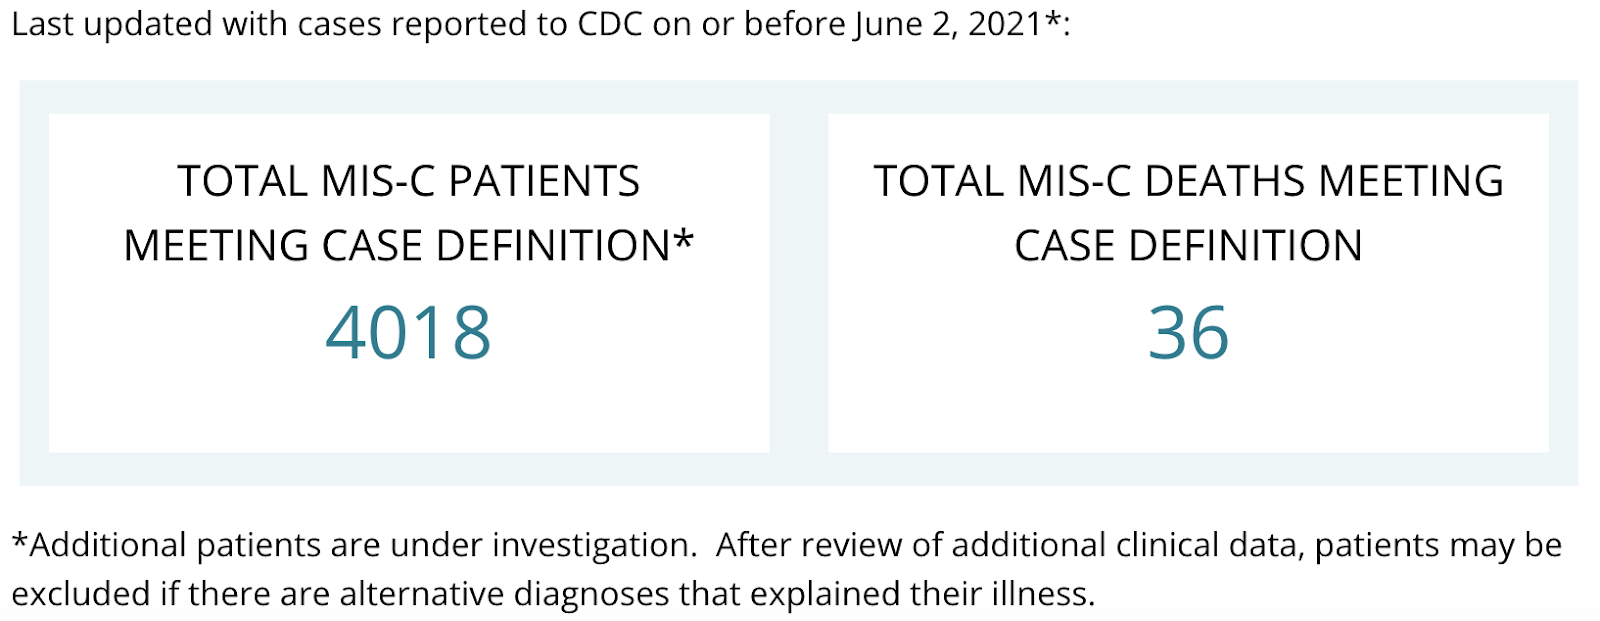
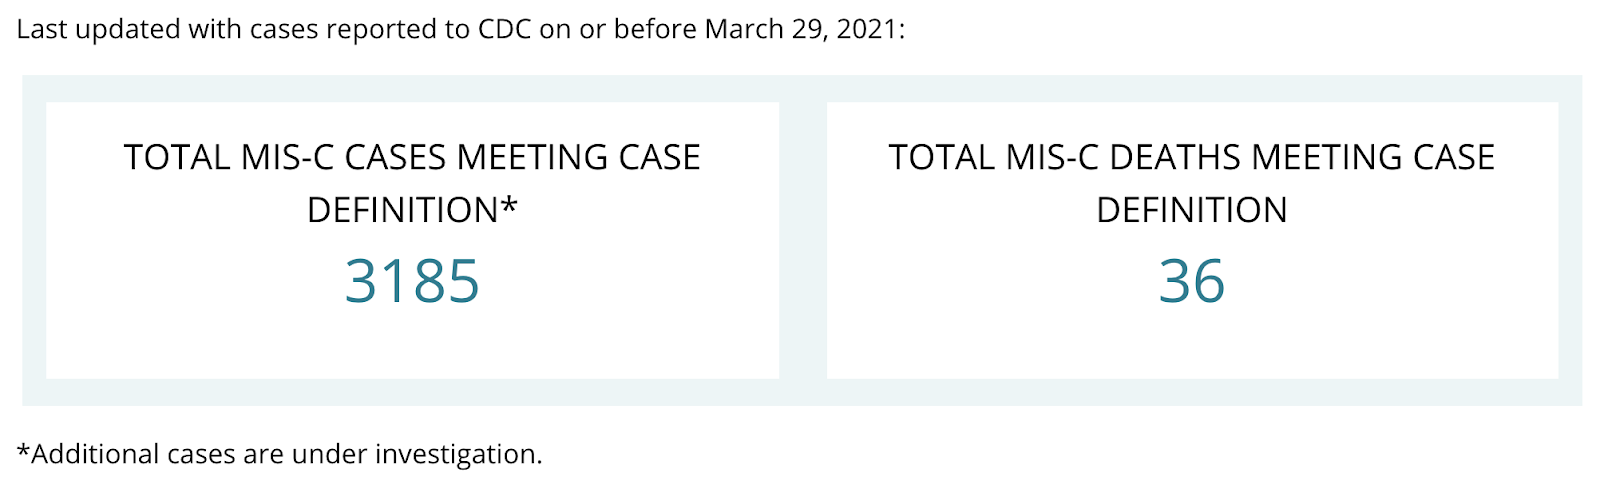
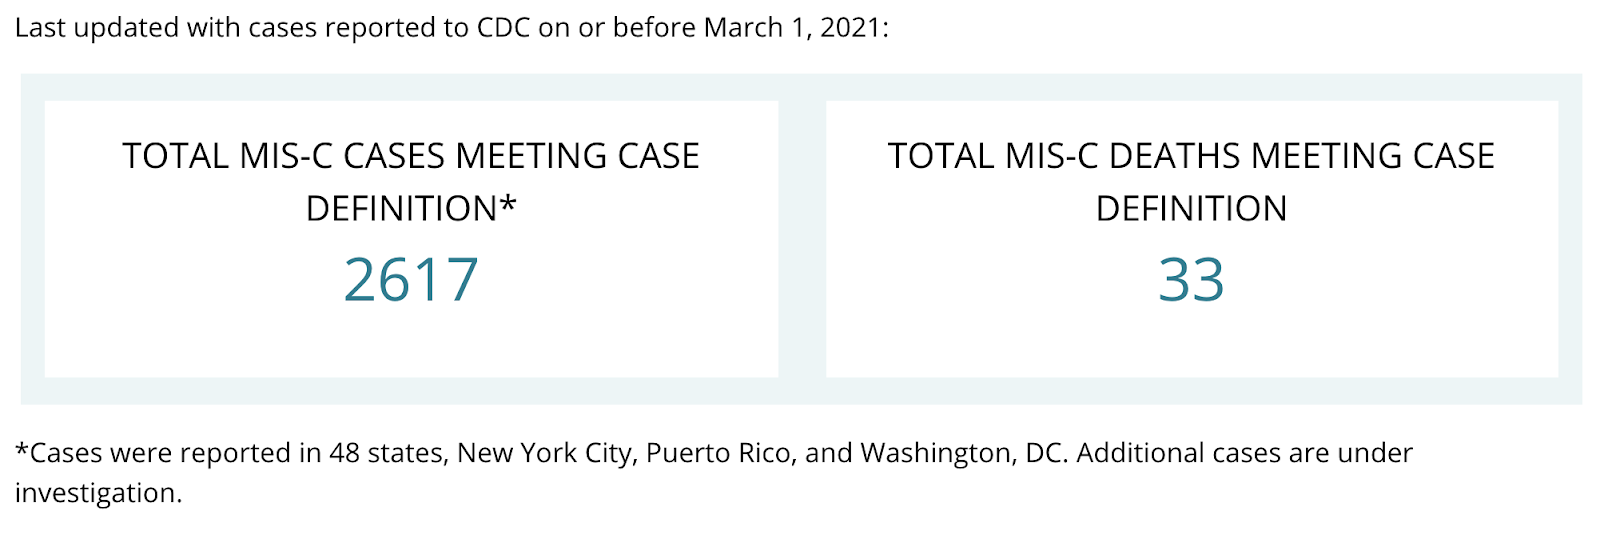
Children under the age of 5 have not been approved to receive either Omicron BA.5 mRNA boosters. Sadly, in children between 0 and 5 years of age only 1.47 million have received at least one dose of any SARS-CoV-2 mRNA vaccine. In the United States, at least 1,332 children have died of COVID-19, and another 74 have died of multisystem inflammatory syndrome (MIS-C). Worldwide, according to UNICEF, over 16,100 children and young adults aged 0-20 have died of COVID-19. 

The October 28 UK Health Security Agency Technical Briefing identifies lineages BQ.1, BQ.1.1, XBB, and BF.7 as isolates of concern. Although BA.5 remains the dominant lineage in the UK, the authors explain, “In the most recent week, logistic growth of variants with 1, 2 or 3 convergent and antigenically significant RBD mutations was respectively 23%, 47%, and 66% per week. The category with 3 RBD mutations consisted largely of BQ.1.1 (59%) with the remainder consisting primarily of a mixture of BA.2.75 sub-lineages (29%).” 

VariantSublineage ofSpike MutationsGlobal SequencesUK Sequences
BF.7BA.5.2.1R346T11,9222,644
BQ.1BA.5L452RN460KK444T2,4903,207
BQ.1.1BA.5N460KK444TR346T2,304(35 countries)1,272
BS.1BA.2.3.2R346TL452RN460KG476S79 2
Data from UK Health Security Agency

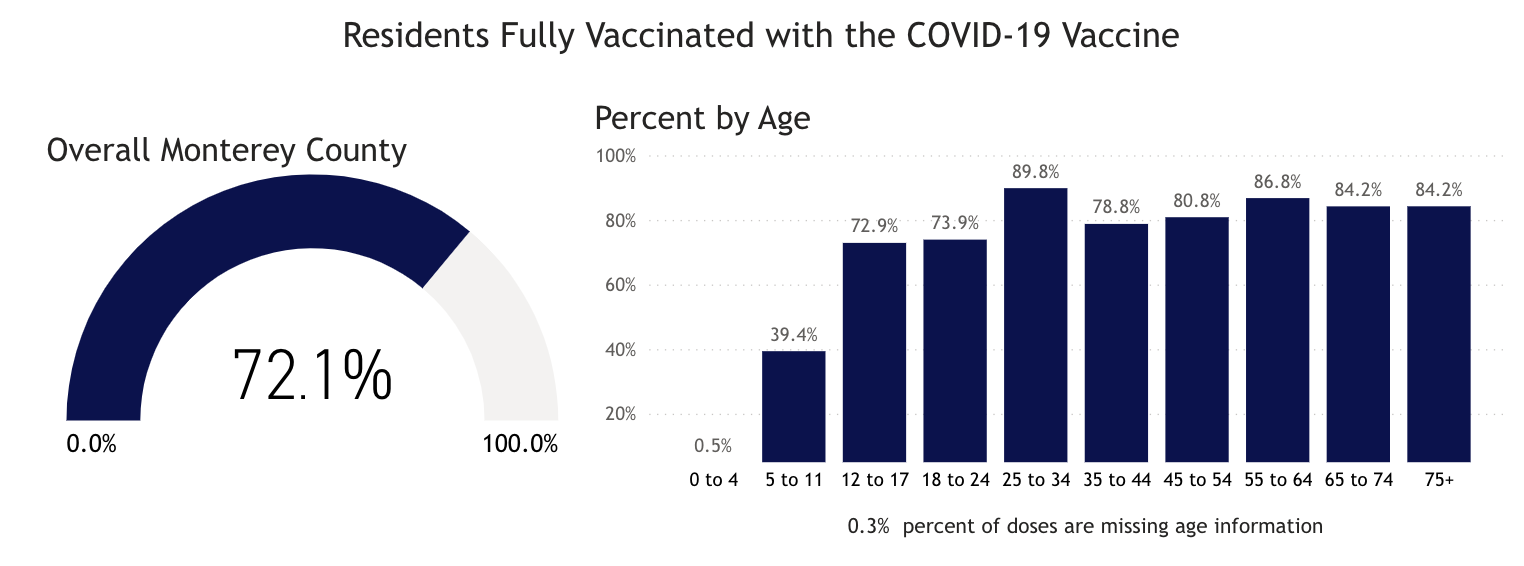
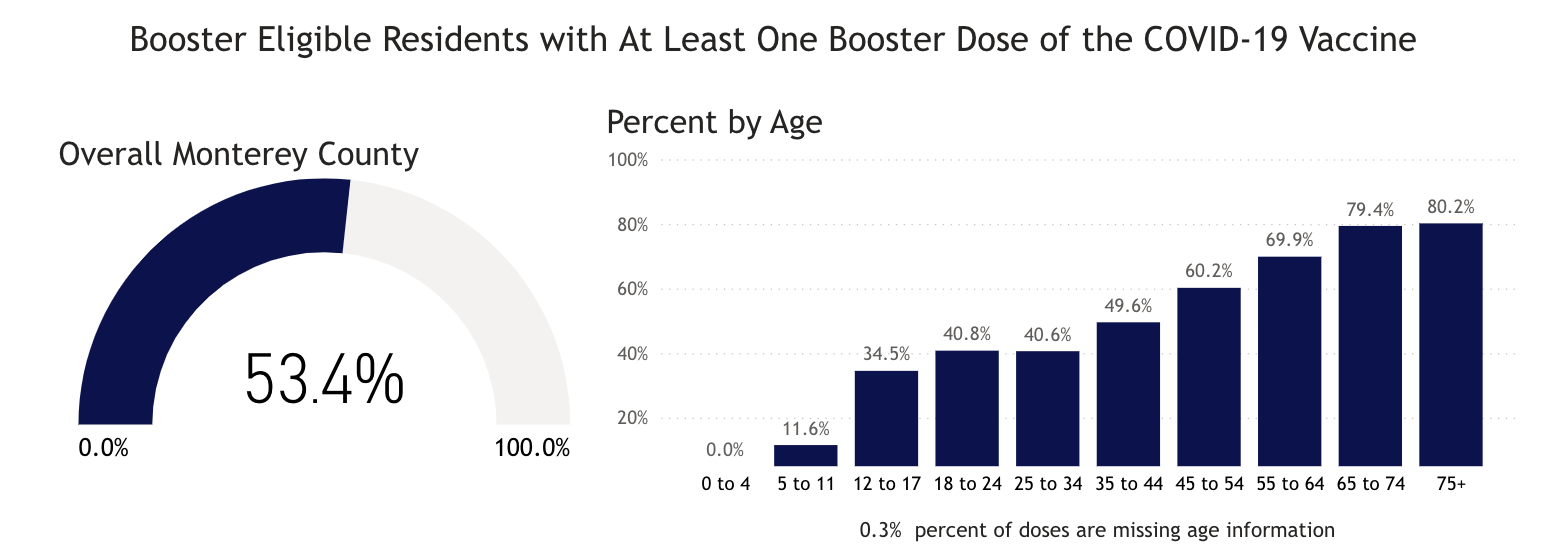
In Monterey County, as of 11/5/22, 2.6% of 0-4 year-olds and 40.1% of 5-11 year-olds have received the first two doses of vaccine, while 73.4% of 12-17 year-olds have received two doses. Only 54.5% of Monterey County residents have received a third dose of the vaccine. The Monterey County Health Department does not publish data on how many residents have received the new BA.5 bivalent booster vaccine. On June 17, The FDA authorized both the Pfizer and Moderna vaccines for use in children ages 6 months to four years. We believe children under 5 should be vaccinated as soon as possible. All Monterey County residents should get up to date on COVID-19 vaccinations, including the bivalent BA.5 booster, as soon as possible. 

Monterey County Health Department

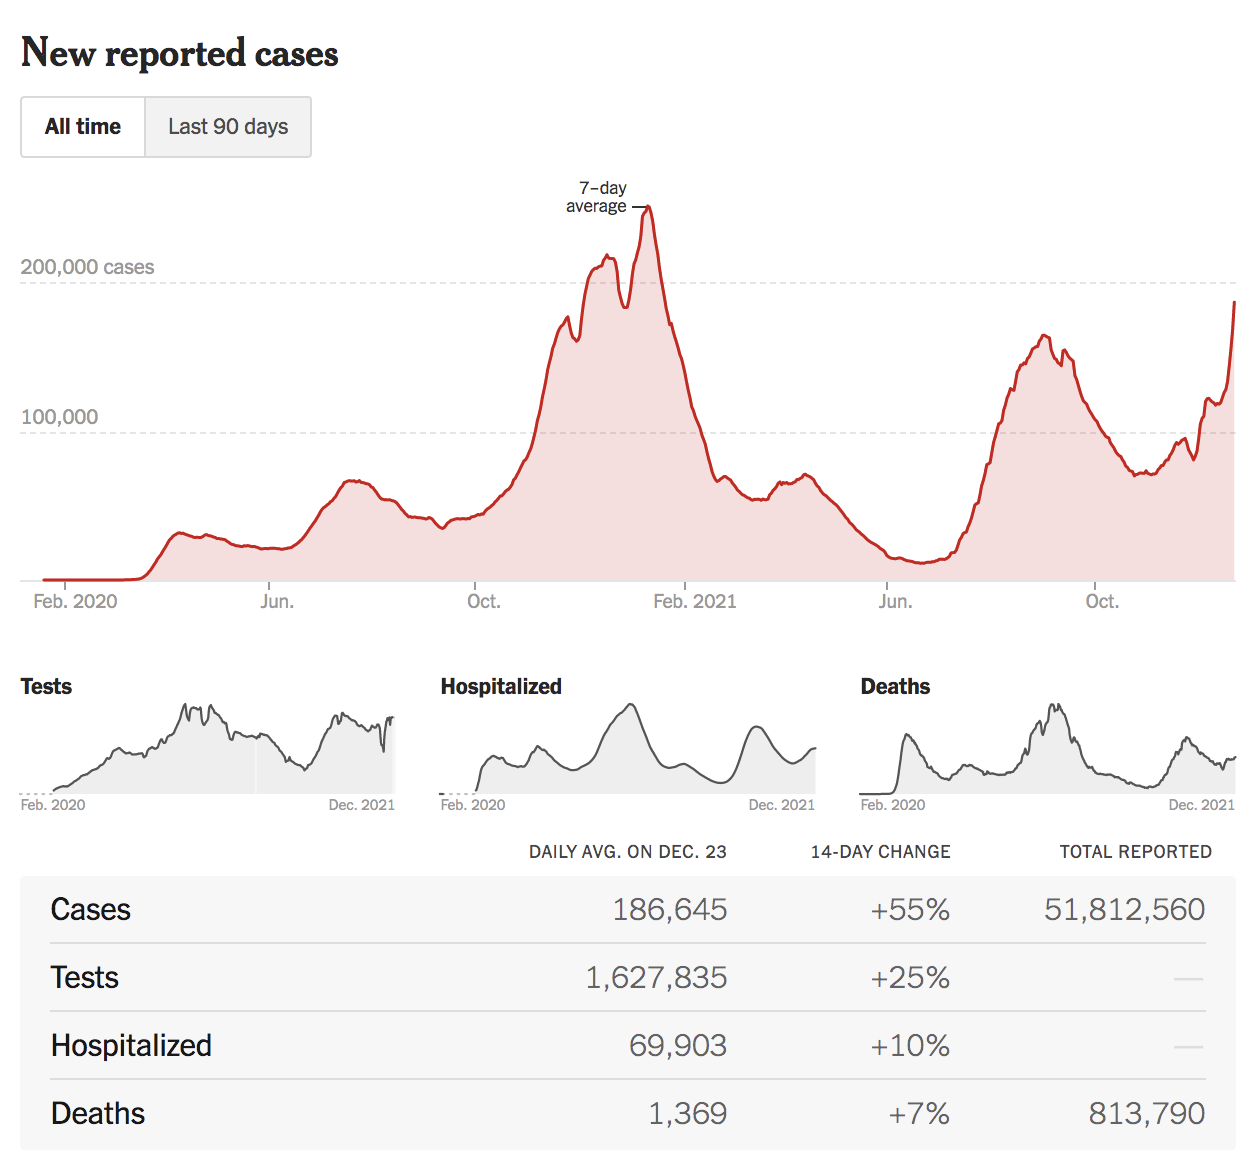
On 11/04/22, the United States had 21,312 documented new infections. There were also 148 deaths. Thirty-five states did not report their infections, and 37 states didn’t report their deaths. In the United States the number of hospitalized patients has increased slightly (+2% compared to the previous 14 days) in many areas and was 27,395 on November 5. On 11/05/22 there were 3,146 patients who were seriously or critically ill; that number was 2,707 two weeks ago. The number of critically ill patients has increased by 439 in the last 14 days, while at least 5,432 new deaths occurred. The number of critically ill patients has decreased for the sixth time in thirty 14-day periods. Patients are still dying each day (average 388/day). Two new Omicron variants BQ.1 and BQ.1.1 are causing increased numbers of infections and hospitalizations in New York. BA.4, BA.4.6, BA.5, and BF.7 variants are still causing infections. In Singapore a different Omicron BA.2 variant, XBB, has caused rapidly increasing infections and now has been named a designated variant along with BQ.1 in the October 28 UK Health Security Agency Technical Briefing. Past infections with a BA.1, BA.2 or BA.5 variants will not prevent infections with any of the newer variants. 

As of 11/04/22, we have had 1,098,038 deaths and 99,602,478 SARS-CoV-2 infections in the United States. We have had 546,941 new infections in the last 14 days. We are adding an average of 273,348 new infections every seven days. For the pandemic in the United States we are averaging one death for every 90.71 infections or over 11,024 deaths for each one million infections. As of 11/04/22, thirty-eight states have had greater than 500,000 total infections, and 38 states have had greater than 5,000 total deaths. Forty-six states have had greater than 2,000 deaths, and 43 states have greater than 2,000 deaths per million population. Seven states have over 4,000 deaths per million population: Mississippi (4,365), Arizona (4,338), Alabama (4,193), West Virginia (4,202), New Mexico (4,132), Tennessee (4,118), and Arkansas (4,148). . Eighteen states (Alabama, Virginia, Missouri, North Carolina, Indiana, Tennessee, Massachusetts, Ohio, Michigan, Georgia, Illinois, New Jersey, Pennsylvania, Florida, Texas, New York, Arizona and California) have had greater than 20,000 deaths. Eight states have had greater than 40,000 deaths: Florida (82,357 deaths), Texas (91,737 deaths), New York (73,549 deaths), Pennsylvania (47,840 deaths), Georgia (40,696 deaths), Ohio (40,249 deaths) , Illinois (40,058 deaths), and  California (96,984 deaths, 20th most deaths in the world). 

On 11/20/20, there were 260,331 (cumulative) deaths in the US from SARS-CoV-2. Since 11/20/20 (23 months), there were 830,937 new deaths from SARS-CoV-2. For nineteen of those months, vaccines have been available to all adults. During these nineteen months, 525,939 people have died of SARS-CoV-2 infections. Clearly, a vaccine-only approach is not working anywhere, especially not in the United States. In addition to getting more people vaccinated, most of the hospitalizations and deaths could have been prevented by proper masking (N95 or better), social distancing, and treatment with oral antiviral agents like Paxlovid. We recommend all of these precautions and treatments to every patient in our clinic, and we have only lost one patient to COVID in 2.5 years. 

As of 11/04/22, California was ranked 33rd in the USA in infection percentage at 28.73%. In California, 24.76% of the people were infected in the last 20 months. As of 11/06/22, 24 states have had greater than 30% of their population infected. Fifty states have greater than 20% of their population infected.                            

Worldwide, average deaths per day are 1,637 for the last 14 days, which is a 68 deaths-per-day increase over the previous 14 days. The United States accounts for 23.70% (388 per day) of all deaths per day in the world over the last two weeks. Worldwide infections per day were 346,369. The United States accounts for 11.28% of those infections (or 39,067 infections per day). 

FDA-Approved Oral Drug Treatments for SARS-CoV-2

Pfizer has developed PAXLOVID™, an oral reversible inhibitor of C3-like protease of SARS-CoV-2. The drug inhibits this key enzyme that is crucial for virus production. The compound, also called Compound 6 (PF-07321332), is part of the drug combination PAXLOVID™ (PF-07321332; ritonavir), which just successfully completed a Phase 2-3 trial in humans in multiple countries. The preliminary results were announced on 11/5/21 by Pfizer. The results show that 89% of the hospitalizations and deaths were prevented in the drug treatment arm. The drug was administered twice a day for five days. No deaths occurred in the treatment group, and ten deaths occurred in the placebo group. The study was stopped by an independent data safety monitoring board, and the FDA concurred with this decision. Pfizer applied for an Emergency Use Authorization for this drug on 11/15/21. This drug was approved on 12/23/21. We have only been able to obtain PAXLOVID™ for two patients who we successfully treated with this drug obtained from CVS in Salinas (East Alisal Street; phone number 831-424-0026). They were expecting another shipment on 1/28/22. In my opinion, this agent, if more widely available, could markedly alter the course of every coronavirus infection throughout the world. 

Merck has developed the oral drug Molnupiravir, which induces RNA mutagenesis by viral RNA-dependent RNA polymerase of SARS-CoV-2 and other viruses. According to Kabinger et al, “Viral RNA-dependent RNA polymerase uses the active form of Molnupiravir, β-D-N4-hydroxycytidine triphosphate, as a substrate instead of cytidine triphosphate or uridine triphosphate. When the RNA-dependent RNA polymerase uses the resulting RNA as a template, β-D-N4-hydroxycytidine triphosphate directs incorporation of either guanine or adenine, leading to mutated (viral) RNA products. Analysis of RNA-dependent RNA polymerase–RNA complexes that contain mutagenesis products has demonstrated that β-D-N4-hydroxycytidine (the active form of Molnupiravir) can form stable base pairs with either guanine or adenine in RNA-dependent RNA polymerase explaining how the polymerase escapes proofreading and synthesizes mutated RNA” (quotation modified for clarity). The results of the phase 3 trial of Molnupiravir were published in the NEJM article “Molnupiravir for Oral Treatment of Covid-19 in Nonhospitalized Patients” by Angélica Jayk Bernal, M.D. et al. (December 16, 2021 DOI: 10.1056/NEJMoa2116044). In this phase 3 study in the Molnupiravir group, 28 patients were hospitalized and one death occurred. In the placebo group, 53 patients were hospitalized and 9 died. Overall, 47% of hospitalizations and deaths were prevented by Molnupiravir. If you do a post hoc analysis and just look at deaths, Molnupiravir would prevent 89% of deaths. An Emergency Use Authorization by the FDA for Molnupiravir was approved on 12/24/21.The dose of Molnupiravir approved is four 200 mg capsules orally twice a day for five days. Diarrhea is reportedly a side effect in two percent of patients. I treated my first patient with Molnupiravir on 1/28/22. Currently more Molnupiravir is available weekly in the United States than PAXLOVID™ (see chart below; data from PHE.gov). Locally Molnupiravir is still available at CVS in Monterey (Fremont Blvd.; phone number: 831-375-5135) and CVS in Salinas (East Alisal Street; phone number 831-424-0026). 

 28, p740–746 (2021)with four 200 mg capsules orally twice a day for five dayfour 200 mg capsules orally twice a day for five daysIntravenous Drug Treatment for non-hospitalized SARS-CoV-2 Infected Patient

FDA-Approved Intravenous Monoclonal Antibody Treatment for Non-Hospitalized SARS-CoV-2 Patients 

Bebtelovimab is a monoclonal antibody treatment for mild-to-moderate COVID-19 in adults and pediatric patients (12 years of age and older weighing at least 40 kg) with positive results of direct SARS-CoV-2 viral testing, and who are at high risk for progression to severe COVID-19, including hospitalization or death, and for whom alternative COVID-19 treatment options approved or authorized by FDA are not accessible or clinically appropriate. The authorized dose of bebtelovimab is 175 mg, given as an intravenous injection over at least 30 seconds. The U.S. Food and Drug Administration (FDA) has issued an Emergency Use Authorization (EUA) for this drug on 2/11/22. Bebtelovimab is a human antibody that demonstrates neutralization against the Omicron variants and is available in every state and many hospitals and some clinics. If you are planning on using a monoclonal antibody to treat a SARS-CoV-2 infection, currently only bebtelovimab has activity against all Omicron variants, including BA.4.6. Researchers at Columbia University recently reported that “The loss of activity of tixagevimab and cilgavimab [components of Evusheld] against BA.4.6 leaves us with bebtelovimab as the only therapeutic mAb that has retained potent activity against all circulating forms of SARS-CoV-2.” For this reason, we no longer recommend Evusheld for immunocompromised patients with Omicron infections. 

An examination of the three variants that Wang et al identified as capable of immune escape in patients who receive the two monoclonal antibodies that are contained in Evusheld reveals that all three variants have a mutation in the spike protein at position 346. The changes substitute an uncharged amino acid— threonine (T), serine (S), or isoleucine (I)—for a positively-charged amino acid, arginine. This just goes to show that a single point mutation in the spike protein can render a monoclonal antibody treatment ineffective. Policy makers should keep in mind that the only way to prevent new drug-resistant variants like BA.4.6 from emerging is to prevent transmission of SARS-CoV-2 in the first place, using non-pharmaceutical interventions. The lack of use of N95 masks, with impending winter and influenza outbreaks, on top of COVID-19, is not wise public health and infectious disease policy. If we don’t make effective use of the non-pharmaceutical interventions available to us (masks, ventilation, social distancing), then the pharmaceutical interventions we have will all eventually be useless. 

Two virologists collaborated on Twitter to create the figure below, which Professor Johnson titled “Convergent Evolution on Steroids.”  It shows the key mutations present in many of the currently-circulating Omicron subvariants and demonstrates that mutation at site 346 is becoming more and more common. This means that even if prevalence of BA.4.6 wanes, we are still likely to have drug resistance issues with other newer variants. 

From Daniele Focosi, M.D., Ph.D. @dfocosi on Twitter 

Watching World Data

Over the next few months, we’ll be paying close attention to correlations between the SARS-CoV-2 data, the number of isolates identified in various countries and states, and the non-pharmaceutical interventions (like mask mandates and lockdowns) put in place by state and national governments. Data on infections, deaths, and percent of population infected was compiled from Worldometers. Data for this table for SARS-CoV-2 Isolates Currently Known in Location was compiled from GISAID and the CDC. It’s worth noting that GISAID provided more data than the CDC.

LocationTotal Infections as of 11/04/22New Infections on 11/04/22Total DeathsNew Deaths on 11/04/22% of Pop.InfectedSARS-CoV-2 Isolates Currently Known in LocationNational/ State Mask MandateCurrently in Lockdown
World637,281,842(4,849,164 new infections in 14 days).273,3336,604,448(22,918 new deaths in last 14 days)1,0918.17%B2 lineageAlpha/B.1.1.7 (UK)Eta/B.1.525 (Nigeria/UK)Iota/B.1.526 (USA-NYC)Beta/B.1.351 (SA)Epsilon/B.1.427 + B.1.429 (USA)*Gamma/P.1 (Brazil)Zeta/P.2 (Brazil)A lineage isolateV01.V2 (Tanzania)APTK India VOC 32421Delta/B.1.617.2 (India)BV-1 (Texas, USA)Kappa/B.1.617.1 (India)Lambda/C.37 (Peru)Theta/P.3 (Philippines) Mu/B.1.621 (Colombia)C.1.2 (South Africa 2% of isolates in July 2021)R1 (Japan)Omicron/B.1.1.529 + BA.1 + BA.2 + BA.3 (South Africa November 2021)B.1.640.1 (Congo/France)B.1.640.2 (Cameroon/France)Four new recombinants 12/31 to 3/22)BA.2.12.1 (USA)BA.4 (South Africa)BA.5 (South Africa)BA.2.75 (India 7/22)BA.4.6 (USA 7/22)BF.7BJ.1XBBBQ.1BQ.1.1BS.1  NoNo
USA99,602,478(ranked #1) 546,941 new infections in the last 14 days or 39,067/day.
19,652(ranked #6)
35 states and D,C. failed to report infections on 11/04/22.
1,098,038(ranked #1) 5,432 new deaths reported in the last 14 days or 388/day. 148
37 states  and D.C. failed to report deaths on 11/04/22.
29.74%
B2 lineageAlpha/B.1.1.7 (UK)Eta/B.1.525 (Nigeria/UK)Iota/B.1.526 (USA-NYC)Beta/B.1.351 (SA)Epsilon/B.1.427 + B.1.429 (USA)*Gamma/P.1 (Brazil)Zeta/P.2 (Brazil)Delta/B.1.617.2 (India)BV-1 (Texas, USA)Theta/P.3 (Philippines) Theta/P.3 (Philippines) Kappa/B.1.617.1 (India)Lambda/C.37 (Peru)Mu/B.1.621 (Colombia)R1(Japan)         Omicron/B.1.1.529 + BA.1 + BA.2 (South Africa November 2021)B.1.640.1 (Congo/France)Recombinant Delta AY.119.2- Omicron BA.1.1 (Tennessee, USA 12/31/21)\BA.2BA.2.12.1 (United States)BA.4 (South Africa 11/21)BA.5 (South Africa 11/21)BA.2.75 (India 7/22)BA.4.6 (USA 7/22)NoNo
Brazil34,890,243(ranked #5) 62,069 new infections in the last 14 days. 2,738688,384(ranked #2; 803 new deaths in 14 days)6816.20%B2 lineageAlpha/B.1.1.7 (UK)Beta/B.1.351 (SA)Gamma/P.1 (Brazil)Zeta/P.2 (Brazil)Lambda/C.37 (Peru)Mu/B.1.621 (Colombia) Omicron/B.1.1.529 + BA.1 (South Africa November 2021)BA.2BA.2.12.1 (United States)BA.4 (South Africa 11/21)BA.5 (South Africa 11/21)NoNo
India 44,659,447(ranked #2); 18,699  new infections in 2 weeks.1,082
530,486(ranked #3) 1,529 new deaths in 2 weeks.73.17%B2 lineageAlpha/B.1.1.7 (UK)Beta/B.1.351 (SA)Gamma/P.1 (Brazil)Epsilon/B.1.427 + B.1.429 (USA)*Eta/B.1.525 (Nigeria/UK)APTK India VOI 32421Delta/B.1.617.2 (India)Kappa/B.1.617.1 (India)Iota/B.1.526 (USA-NYC) Omicron/B.1.1.529 + BA.1 (South Africa November 2021)B.1.640.1 (Congo/France)BA.4 (South Africa 11/21)BA.5 (South Africa 11/21)BA.2.75 (India)NoNo
United Kingdom
23,930,041(ranked #7) 74,519 new infections in 2 weeks.194,704 (ranked #7) 2,022  new deaths in 2 weeks34.93%B2 lineageAlpha/B.1.1.7 (UK)Eta/B.1.525 (Nigeria/UK)Beta/B.1.351 (SA)Epsilon/B.1.427 + B.1.429 (USA)*Gamma/P.1 (Brazil)Delta/B.1.617.2 (India)Theta/P.3 (Philippines) Kappa/B.1.617.1 (India)Lambda/C.37 (Peru)Mu/B.1.621 (Colombia)C.1.2 (South Africa)Omicron/B.1.1.529 + BA.1 (South Africa November 2021)B.1.640.1 (Congo/France)XD (AY.4/BA.1) recombinantXF (Delta/BA.1) recombinantXE (BA.1/BA.2) recombinantBA.2BA.2.12.1 (United States)BA.4 (South Africa 11/21)BA.5 (South Africa 11/21)BA.2.75 (India 7/22)NoNo
California, USA11,353,896(ranked #13 in the world; 21,351 new infections in the last 14 days).1,43496,984 (ranked #20 in world)
303 new deaths in the last 14 days
728.73%B2 lineageAlpha/B.1.1.7 (UK)Eta/B.1.525 (Nigeria/UK)Beta/B.1.351 (SA)Gamma/P.1 (Brazil)Epsilon/B.1.427 + B.1.429 (USA)*Zeta/P.2 (Brazil)Delta/B.1.617.2 (India)Theta/P.3 (Philippines) Kappa/B.1.617.1 (India)Lambda/C.37 (Peru) Mu/B.1.621 (Colombia) Omicron/B.1.1.529 + BA.1 (South Africa November 2021)BA.2BA.2.12.1 (United States)BA.4 (South Africa 11/21)BA.5 (South Africa 11/21)BA.2.75 (India 7/22)NoNo
Mexico7,113,132(ranked #19) 7,114 new infections in 14 days).628330,415(ranked #5)94 new deaths in 14 days)55.40%NoNo
South Africa4,029,737(ranked #37; 4,362 new infections in 14 days).241102,363 (ranked #18) 106 new deaths in 14 days)526.63%B2 lineageAlpha/B.1.1.7 (UK)Beta/B.1.351 (SA)Delta/B.1.617.2 (India)Kappa/B.1.617.1 (India)       C.1.2 (South Africa, July 2021)Omicron/B.1.1.529 + BA.1 (South Africa November 2021)B.1.640.1 (Congo/France)BA.2BA.4 (South Africa 11/21)BA.5 (South Africa 11/21)NoNo
Canada4,336,860(ranked #33) 22,142 new infections in 14 days).46,389(ranked #25 ) 364  new deaths in the last 14 days11.29% NoNo
Poland6,333,591 (ranked #21; 9,506  new infections in 14 days). 693118,157 (ranked #15)142 new deaths in the last 14 days1416.80%B2 lineageAlpha/B.1.1.7 (UK)Eta/B.1.525 (Nigeria/UK)Beta/B.1.351 (SA)Delta/B.1.617.2 (India)Mu/B.1.621 (Colombia)Omicron/B.1.1.529 + BA.1 + (South Africa November 2021),Omicron/B.1.1.529 +BA.3 NoNo
Russia21,453667(ranked #10), 98,753 new infections in 14 days).6,149 (ranked #9)390,459(ranked #4)1,100 new deaths in 14 days7114.71%NoNo
Peru4,159,132(ranked #36, 7,113new infections in 14 days). 598216,972(ranked #6) 95 new deaths in the last 14 days512.34%B2 lineageAlpha/B.1.1.7 (UK)Delta/B.1.617.2 (India)Gamma/P.1 (Brazil)Iota/B.1.526 (USA-NYC)Lambda/C.37 (Peru)Mu/B.1.621 (Colombia)Omicron/B.1.1.529 + BA.1 (South Africa November 2021)NoNo
Iran7,558,002(ranked #17; 2,308 new infections in last 14 days)40144,587(ranked #12) 47 new deaths in the last 14 days48.78%B2 lineageAlpha/B.1.1.7 (UK)Delta/B.1.617.2 (India)Beta/B.1.351 (SA)Omicron/B.1.1.529 + BA.1 (South Africa November 2021)NoNo
Spain13,529,643(ranked #12;   41,628 new infections in 14 days).2,551115,239 (ranked #16)381 new deaths in 14 days2328.95%B2 lineageAlpha/B.1.1.7 (UK)Delta/B.1.617.2 (India)Beta/B.1.351 (SA)Gamma/P.1 (Brazil)Epsilon/B.1.427 + B.1.429 (USA)*Eta/B.1.525 (Nigeria/UK)Iota/B.1.526 (USA-NYC)Kappa/B.1.617.1 (India)Mu/B.1.621 (Colombia)Omicron/B.1.1.529 + BA.1 (South Africa November 2021)B.1.640.1 (Congo/France)NoNo
France36,920,064 (ranked #3; 395,459 new infections in the last 14 days).29,438 (ranked #4)157,277 (ranked #10)940 new deaths in 14 days.7856.29%  a 0.60% increase in 14 days.B2 lineageAlpha/B.1.1.7 (UK)Delta/B.1.617.2 (India) Omicron/B.1.1.529 South Africa November 2021)B.1.640.1 (Congo/France)B.1.640.2 (Cameroon/France)GKA (AY.4/BA.1) recombinantNoNo
Germany35,823,771(ranked #4; 651,078 new infections in 14 days.)38,859 (ranked #2)154,535 (ranked #11)2,053 new deaths in 14 days 20742.70%
0.77% increase in 14 days
B2 lineageAlpha/B.1.1.7 (UK)Delta/B.1.617.2 (India) Delta/B.1.617.2 (India) Omicron/B.1.1.529 South Africa November 2021)GKA (AY.4/BA.1) recombinantNoNo
South Korea25,760,701 (ranked #6 516,446 new infections in 14 days).43,424(ranked #1)29,315 (ranked #36) 363 new deaths in 14 days3549.18%1.00% increase in 14 daysB2 lineageAlpha/B.1.1.7 (UK)Delta/B.1.617.2 (India) Delta/B.1.617.2 (India) Omicron/B.1.1.529 South Africa November 2021)NoNo
Vietnam11,505,249 (ranked #13; 8,895 new infections in 14 days).33943,165(ranked #26)11.62%B2 lineageAlpha/B.1.1.7 (UK)Delta/B.1.617.2 (India) Delta/B.1.617.2 (India) Omicron/B.1.1.529 South Africa November 2021)NoNo
Netherlands8,521,729 (ranked #16; 27,024 new infections in 14 days).1,22522,845 (ranked #41)349.51%B2 lineageAlpha/B.1.1.7 (UK)Delta/B.1.617.2 (India) Delta/B.1.617.2 (India) Omicron/B.1.1.529 South Africa November 2021)GKA (AY.4/BA.1) recombinantNoNo
Denmark3,138,750 (ranked #40) 7,601 new infections in 14 days. 3557,387 (ranked #78 139 new deaths in the last 14 days)1253.79%B2 lineageAlpha/B.1.1.7 (UK)Delta/B.1.617.2 (India) Delta/B.1.617.2 (India) Omicron/B.1.1.529 South Africa November 2021)GKA (AY.4/BA.1) recombinantNoNo


Taiwan7,837,658(ranked #17)458,453 new infections in 14 days27,594 (ranked #5)13,084 (ranked #59 878 new deaths in the last 14 days)
7432.80%
1.91% of population has been infected in the last 14 days
B2 lineageAlpha/B.1.1.7 (UK)Delta/B.1.617.2 (India) Delta/B.1.617.2 (India) Omicron/B.1.1.529 South Africa November 2021)NoNo
Japan22,534,377(ranked #9)608,146 new infections in the last 14 days34,064(ranked #5)46,898(ranked #24)
757 new deaths in the last 14 days
5917.94%
B2 lineageAlpha/B.1.1.7 (UK)Delta/B.1.617.2 (India) Delta/B.1.617.2 (India) Omicron/B.1.1.529 South Africa November 2021)BA.2*BA.5*NoNo
Argentina9,718,875 (ranked #15)129,991(ranked #14)21.12%NoNo
Italy23,642,011 (ranked #8)     179,436(ranked #8)39,23%NoNo
Chile4,777,208(ranked #28)7,57061,737(ranked #22)1224.81%NoNo
Colombia6,310,332(ranked #14)141,850(ranked #13)12.25%NoNo
Australia9,718,875(ranked #14)15,618 (ranked #7)15,776(ranked #55)5939.95%NoNo
Turkey16,919,638(ranked #11)101,203(ranked #19)19.77%NoNo
Indonesia6,512,913 (ranked #20)5,303 (ranked #11)158,768 (ranked #9)3123,23%NoNo
Malaysia4,918,917 (ranked #29)4,360 (ranked #13)36,481 (ranked #29)114.75%NoNo

What Our Team Is Reading This Week

COVID-19

SARS-CoV-2 Update

It’s time for our next 14-day moving average determinations for SARS-CoV-2 for the United States and my thoughts on vaccines, SARS-CoV-2 therapeutic agents and mutant viruses. We use the WORLDOMETERS aggregators data set to make any projections since it includes data from the Department of Veterans Affairs, the U.S. Military, federal prisons and the Navajo Nation.

SARS-CoV-2 infections per day in the United States have decreased for the first time in two weeks; however, there is still widespread underreporting by states, a failure to capture positive home tests, and a decreased PCR screening program in most states. Deaths per day in the United States have decreased by 31 deaths per day. The number of infections have decreased by 19,061 infections per day.  The CDC estimates that BA.2.12.1 accounted for 0.2% of isolates, BA.2 accounted for 0%, BA.5 accounted for 88.7%, BA.4 accounted for 3.6%, BA.4.6 accounted for 7.5%, and B.1.1.529 accounted for 0% in the week ending August 27.

CDC

We frequently hear messaging from health officials and politicians that Omicron is “mild,” especially compared to the Delta variant, and as a result, many of our patients believe that they no longer need to wear their masks. This is a dangerous misconception. SARS-CoV-2 still remains a highly transmissible, airborne virus. The following graph, based on CDC data from April 2, 2022, shows that Omicron deaths in people over 65 are much higher than Delta deaths in the same age group. In fact, the peak of Omicron deaths in people over 65 years of age is 163% higher than the Delta peak. The death rate from Omicron is only lower than Delta in the populations between 12 and 64 years of age. Until we have more data on these newer mutants of SARS-CoV-2, we will not know the lethality of each variant. It may take months to measure objective differences in the death rates of new circulating variants. We recommend that all of our patients and family members continue to wear N95 masks in all enclosed spaces.

NY Times

In patients treated with Paxlovid for five days who have persistent symptoms and continued positivity, we feel that clinicians should consider giving a second course of Paxlovid for five days. Boucau et al have demonstrated that in a study of seven patients with recurrent symptoms, “High viral loads (median 6.1 log10 copies/mL) were detected after rebound for a median of 17 days after initial diagnosis. Three had culturable virus for up to 16 days after initial diagnosis.” This was not due to resistance-associated mutations of the virus, suggesting that the course of therapy may be inadequate in this group of persistently infected patients. 

The Omicron variant has continued to mutate just like Delta. There are now 276 Omicron sub-variants (an increase of 46 in the last two weeks) that have been assigned Pango lineages, including 123 sub-lineages of BA.2 (an increase of 7 in two weeks), one sub-lineage of BA.3, 15 sub-lineages of BA.4 (an increase of one in two weeks), and 45 sub-lineages of BA.5 (an increase of 21 in two weeks). The BF lineage (new ten weeks ago) now has 21 sublineages, an increase of 10 in two weeks. The BE lineage (also new ten weeks ago), with BE.1 first detected in South Africa, Austria and England, now has 7 sublineages, an increase of 3 in two weeks. There are also new lineages from ten weeks ago: BC.1 (Japan), BC.2 (Peru),BD.1 (UK), BG.1 (Peru), BG.2 (US, Denmark, Canada), BG.3 (Peru), BG.4 (Israel). In the last two weeks, the BG lineage has expanded to include BG.5 (USA) and BG.6 (Peru). Lastly, two new sublineages were added in the past two weeks: BH.1 (India) and BK.1 (USA and Canada). 

In Monterey County, as of 8/28/22, 0.5% of 0-4 year-olds and 39.4% of 5-11 year-olds have received the first two doses of vaccine, while 72.9% of 12-17 year-olds have received two doses. Only 53.4% of Monterey County residents have received a third dose of the vaccine. On June 17, The FDA authorized both the Pfizer and Moderna vaccines for use in children ages 6 months to four years. We believe children under 5 should be vaccinated as soon as possible. We would anticipate, with the start of school on August 5 and the low vaccination rates in our county, that we’ll have a marked increase in the number of infected patients. All Monterey County residents should get up to date on COVID-19 vaccinations as soon as possible. 

Monterey County Health Department

On 8/26/22, the United States had 63,798 documented new infections. There were also 312 deaths. Twenty-four states did not report their infections, and 28 states didn’t report their deaths. In the United States the number of hospitalized patients has decreased slightly in many areas and was 38,630 on August 27, a decrease of 9% compared to the previous 14 days. Now there are 3,992 patients who are seriously or critically ill; that number was 4,490 two weeks ago. The number of critically ill patients has decreased by 498 in the last 14 days, while at least 6,692 new deaths occurred. The number of critically ill patients has decreased for the second time in twenty-six 14-day periods. Patients are still dying each day (average 478/day). Omicron BA.4, BA.4.6 (a new USA variant) and BA.5 variants causing infections should continue to increase and critically ill patients may increase. Deaths usually lag two to four weeks behind exponential increase in infections. Past infections with a BA.1 or BA.2 variant will not prevent infections with BA.4, BA.4.6 or BA.5. 

As of 8/26/22, we have had 1,068,843 deaths and 95,970,007 SARS-CoV-2 infections in the United States. We have had 1,326,375 new infections in the last 14 days. We are adding an average of 663,188 infections every seven days. For the pandemic in the United States we are averaging one death for every 89.78 infections or over 11,137 deaths for each one million infections. As of 8/26/22, thirty-eight states have had greater than 500,000 total infections, and 37 states have had greater than 5,000 total deaths. Forty-six states have had greater than 2,000 deaths, and 42 states have greater than 2,000 deaths per million population. Vermont, at 1,153 deaths per million, and Hawaii, 1,133 deaths per million, are the states with the lowest death rates. Eighteen states (Alabama, Virginia, Missouri, North Carolina, Indiana, Tennessee, Massachusetts, Ohio, Michigan, Georgia, Illinois, New Jersey, Pennsylvania, Florida, Texas, New York, Arizona and California) have had greater than 20,000 deaths. Four states have had greater than 70,000 deaths: Florida (79,568 deaths), Texas (90,539 deaths), New York (71,422 deaths), and  California (94,959 deaths, 20th most deaths in the world). 

On 11/20/20, there were 260,331 (cumulative) deaths in the US from SARS-CoV-2. Since 11/20/20 (21 months), there were 808,712 new deaths from SARS-CoV-2. For seventeen of those months, vaccines have been available to all adults. During these seventeen months, 497,746 people have died of SARS-CoV-2 infections. Most of the hospitalizations and deaths could have been prevented by vaccination, proper masking, and social distancing. 

As of 8/26/22, California was ranked 32nd in the USA in infection percentage at 27.97%. In California, 24.0% of people were infected in the last 19 months. As of 8/26/22, 41 states have had greater than 25% of their population infected. No state has less than 20% of their population infected. 

Worldwide, average deaths per day are 2,399 for the last 14 days, which is a 55 deaths-per-day decrease over the previous 14 days. The United States accounts for 19.92% (478 per day) of all deaths per day in the world over the last two weeks. Worldwide infections per day were 774,366. The United States accounts for 12.23% of those infections (or 94,741 infections per day). 

Watching World Data

Over the next few months, we’ll be paying close attention to correlations between the SARS-CoV-2 data, the number of isolates identified in various countries and states, and the non-pharmaceutical interventions (like mask mandates and lockdowns) put in place by state and national governments. Data on infections, deaths, and percent of population infected was compiled from Worldometers. Data for this table for SARS-CoV-2 Isolates Currently Known in Location was compiled from GISAID and the CDC. It’s worth noting that GISAID provided more data than the CDC.

LocationTotal Infections as of 8/26/22New Infections on 8/26/22Total DeathsNew Deaths on 8/26/22% of Pop.InfectedSARS-CoV-2 Isolates Currently Known in LocationNational/ State Mask MandateCurrently in Lockdown
World604,789,766(10,841,118 new infections in 14 days).689,1946,485,447(33,589 new deaths in last 14 days)1,9277.75%B2 lineageAlpha/B.1.1.7 (UK)Eta/B.1.525 (Nigeria/UK)Iota/B.1.526 (USA-NYC)Beta/B.1.351 (SA)Epsilon/B.1.427 + B.1.429 (USA)*Gamma/P.1 (Brazil)Zeta/P.2 (Brazil)A lineage isolateV01.V2 (Tanzania)APTK India VOC 32421Delta/B.1.617.2 (India)BV-1 (Texas, USA)Kappa/B.1.617.1 (India)Lambda/C.37 (Peru)Theta/P.3 (Philippines) Mu/B.1.621 (Colombia)C.1.2 (South Africa 2% of isolates in July 2021)R1 (Japan)Omicron/B.1.1.529 + BA.1 + BA.2 + BA.3 (South Africa November 2021)B.1.640.1 (Congo/France)B.1.640.2 (Cameroon/France)Four new recombinants 12/31 to 3/22)BA.2.12.1 (USA)BA.4 (South Africa)BA.5 (South Africa)BA.2.75 (India 7/22)BA.4.6 (USA 7/22)  NoNo
USA95,970,007(ranked #1) 1,326,375 new infections in the last 14 days.
63,798(ranked #3)
24 states failed to report infections on 8/26/22.
1,068,843(ranked #1) 6,692  new deaths reported in the last 14 days. 312
30 states failed to report deaths on 8/26/22.
26.72%*
*Not updated for 8 weeks by Worldometer.
B2 lineageAlpha/B.1.1.7 (UK)Eta/B.1.525 (Nigeria/UK)Iota/B.1.526 (USA-NYC)Beta/B.1.351 (SA)Epsilon/B.1.427 + B.1.429 (USA)*Gamma/P.1 (Brazil)Zeta/P.2 (Brazil)Delta/B.1.617.2 (India)BV-1 (Texas, USA)Theta/P.3 (Philippines) Theta/P.3 (Philippines) Kappa/B.1.617.1 (India)Lambda/C.37 (Peru)Mu/B.1.621 (Colombia)R1(Japan)         Omicron/B.1.1.529 + BA.1 + BA.2 (South Africa November 2021)B.1.640.1 (Congo/France)Recombinant Delta AY.119.2- Omicron BA.1.1 (Tennessee, USA 12/31/21)\BA.2BA.2.12.1 (United States)BA.4 (South Africa 11/21)BA.5 (South Africa 11/21)BA.2.75 (India 7/22)BA.4.6 (USA 7/22)NoNo
Brazil34,368,909(ranked #4) 220,778 new infections in the last 14 days. 18,270 (ranked #8)683,464(ranked #2; 2,147 new deaths in 14 days)13615.92%B2 lineageAlpha/B.1.1.7 (UK)Beta/B.1.351 (SA)Gamma/P.1 (Brazil)Zeta/P.2 (Brazil)Lambda/C.37 (Peru)Mu/B.1.621 (Colombia) Omicron/B.1.1.529 + BA.1 (South Africa November 2021)BA.2BA.2.12.1 (United States)BA.4 (South Africa 11/21)BA.5 (South Africa 11/21)NoNo
India 44,398,696(ranked #2); 159,324 new infections in 2 weeks.9,520 (ranked #12)
527,597(ranked #3) 631 new deaths in 2 weeks.413.15%B2 lineageAlpha/B.1.1.7 (UK)Beta/B.1.351 (SA)Gamma/P.1 (Brazil)Epsilon/B.1.427 + B.1.429 (USA)*Eta/B.1.525 (Nigeria/UK)APTK India VOI 32421Delta/B.1.617.2 (India)Kappa/B.1.617.1 (India)Iota/B.1.526 (USA-NYC) Omicron/B.1.1.529 + BA.1 (South Africa November 2021)B.1.640.1 (Congo/France)BA.4 (South Africa 11/21)BA.5 (South Africa 11/21)BA.2.75 (India)NoNo
United Kingdom
23,492,875(ranked #6) 72,049 new infections in 2 weeks.187,761 (ranked #7) 1,674 new deaths in 2 weeks34.22%B2 lineageAlpha/B.1.1.7 (UK)Eta/B.1.525 (Nigeria/UK)Beta/B.1.351 (SA)Epsilon/B.1.427 + B.1.429 (USA)*Gamma/P.1 (Brazil)Delta/B.1.617.2 (India)Theta/P.3 (Philippines) Kappa/B.1.617.1 (India)Lambda/C.37 (Peru)Mu/B.1.621 (Colombia)C.1.2 (South Africa)Omicron/B.1.1.529 + BA.1 (South Africa November 2021)B.1.640.1 (Congo/France)XD (AY.4/BA.1) recombinantXF (Delta/BA.1) recombinantXE (BA.1/BA.2) recombinantBA.2BA.2.12.1 (United States)BA.4 (South Africa 11/21)BA.5 (South Africa 11/21)BA.2.75 (India 7/22)NoNo
California, USA11,052,866(ranked #14 in the world;  156,070 new infections in the last 14 days).11,37494,959 (ranked #20 in world)
640 new deaths in the last 14 days
5527.97%B2 lineageAlpha/B.1.1.7 (UK)Eta/B.1.525 (Nigeria/UK)Beta/B.1.351 (SA)Gamma/P.1 (Brazil)Epsilon/B.1.427 + B.1.429 (USA)*Zeta/P.2 (Brazil)Delta/B.1.617.2 (India)Theta/P.3 (Philippines) Kappa/B.1.617.1 (India)Lambda/C.37 (Peru) Mu/B.1.621 (Colombia) Omicron/B.1.1.529 + BA.1 (South Africa November 2021)BA.2BA.2.12.1 (United States)BA.4 (South Africa 11/21)BA.5 (South Africa 11/21)BA.2.75 (India 7/22)NoNo
Mexico7,001,590(ranked #18) 7,728 new infections in 14 days).7,281(ranked #16)329,289(ranked #5)693 new deaths in 214 days)645.31%B2 lineageAlpha/B.1.1.7 (UK)Epsilon/B.1.427 + B.1.429 (USA)*Gamma/P.1 (Brazil)Delta/B.1.617.2 (India)Kappa/B.1.617.1 (India)Lambda/C.37 (Peru)Mu/B.1.621 (Colombia)Omicron/B.1.1.529 + BA.1 (South Africa November 2021)NoNo
South Africa4,010,632(ranked #36; 2,607 new infections in 14 days).247102,084 (ranked #18) 6.58%B2 lineageAlpha/B.1.1.7 (UK)Beta/B.1.351 (SA)Delta/B.1.617.2 (India)Kappa/B.1.617.1 (India)       C.1.2 (South Africa, July 2021)Omicron/B.1.1.529 + BA.1 (South Africa November 2021)B.1.640.1 (Congo/France)BA.2BA.4 (South Africa 11/21)BA.5 (South Africa 11/21)NoNo
Canada4,158,491(ranked #33) 48,560 new infections in 14 days).3,27043,797(ranked #24)3910.81% B2 lineageAlpha/B.1.1.7 (UK)Eta/B.1.525 (Nigeria/UK)Epsilon/B.1.427 + B.1.429 (USA)*Gamma/P.1 (Brazil)Delta/B.1.617.2 (India)Kappa/B.1.617.1 (India)Lambda/C.37 (Peru)Mu/B.1.621 (Colombia)Omicron/B.1.1.529 + BA.1 (South Africa November 2021)B.1.640.1 (Congo/France)NoNo
Poland6,162,662 (ranked #21; 48,822 new infections in 14 days). 3,847117,007 (ranked #15)4016.32%B2 lineageAlpha/B.1.1.7 (UK)Eta/B.1.525 (Nigeria/UK)Beta/B.1.351 (SA)Delta/B.1.617.2 (India)Mu/B.1.621 (Colombia)Omicron/B.1.1.529 + BA.1 + (South Africa November 2021),Omicron/B.1.1.529 +BA.3 NoNo
Russia19,311,973(ranked #9), 487,691 new infections in 14 days).46,452 (ranked #4)383,910(ranked #4)899 new deaths in 14 days8113.22%B2 lineageAlpha/B.1.1.7 (UK)Beta/B.1.351 (SA)Delta/B.1.617.2 (India)R1 (Japan) B.1.640.1 (Congo/France)Omicron/B.1.1.529 + BA.1 (South Africa November 2021)NoNo
Peru4,094,652(ranked #34, 80,821 new infections in 14 days). 3,286215,566(ranked #6)4212.05%B2 lineageAlpha/B.1.1.7 (UK)Delta/B.1.617.2 (India)Gamma/P.1 (Brazil)Iota/B.1.526 (USA-NYC)Lambda/C.37 (Peru)Mu/B.1.621 (Colombia)Omicron/B.1.1.529 + BA.1 (South Africa November 2021)NoNo
Iran7,520,993(ranked #17; 55,414 new infections in last 14 days)2,019143,647(ranked #12)358.71%B2 lineageAlpha/B.1.1.7 (UK)Delta/B.1.617.2 (India)Beta/B.1.351 (SA)Omicron/B.1.1.529 + BA.1 (South Africa November 2021)


NoNo
Spain13,332,976(ranked #12;   38,737 new infections in 14 days).3,064(ranked #26)112,454 (ranked #16)787 new deaths in 14 days7028.49%B2 lineageAlpha/B.1.1.7 (UK)Delta/B.1.617.2 (India)Beta/B.1.351 (SA)Gamma/P.1 (Brazil)Epsilon/B.1.427 + B.1.429 (USA)*Eta/B.1.525 (Nigeria/UK)Iota/B.1.526 (USA-NYC)Kappa/B.1.617.1 (India)Mu/B.1.621 (Colombia)Omicron/B.1.1.529 + BA.1 (South Africa November 2021)B.1.640.1 (Congo/France)NoNo
France34,446,854 (ranked #3; 254,935 new infections in the last 14 days).18,116 153,857 (ranked #10)
793 new deaths in 14 days
5152.52%B2 lineageAlpha/B.1.1.7 (UK)Delta/B.1.617.2 (India) Omicron/B.1.1.529 South Africa November 2021)B.1.640.1 (Congo/France)B.1.640.2 (Cameroon/France)GKA (AY.4/BA.1) recombinantNoNo
Germany32,041,348(ranked #5; 506,005 new infections in 14 days.).33,226 (ranked #5)147,104 (ranked #11)
1,406 new deaths in 14 days
10137.98%
B2 lineageAlpha/B.1.1.7 (UK)Delta/B.1.617.2 (India) Delta/B.1.617.2 (India) Omicron/B.1.1.529 South Africa November 2021)GKA (AY.4/BA.1) recombinantNoNo
South Korea22,802,985 (ranked #7 1,691,145 new infections in 14 days).101,064(ranked #2)26,413 (ranked #37) 8144.39%B2 lineageAlpha/B.1.1.7 (UK)Delta/B.1.617.2 (India) Delta/B.1.617.2 (India) Omicron/B.1.1.529 South Africa November 2021)NoNo
Vietnam11,399,400 (ranked #13; 36,860 new infections in 14 days).3,19543,110 (ranked #25)11.48%B2 lineageAlpha/B.1.1.7 (UK)Delta/B.1.617.2 (India) Delta/B.1.617.2 (India) Omicron/B.1.1.529 South Africa November 2021)NoNo
Netherlands8,381,009 (ranked #16; 18.445 new infections in 14 days).1,15622,594 (ranked #41)248.68%B2 lineageAlpha/B.1.1.7 (UK)Delta/B.1.617.2 (India) Delta/B.1.617.2 (India) Omicron/B.1.1.529 South Africa November 2021)GKA (AY.4/BA.1) recombinantNoNo
Denmark3,089,118 (ranked #40) 12,476 new infections in 14 days6806,893 (ranked #79)552.93%B2 lineageAlpha/B.1.1.7 (UK)Delta/B.1.617.2 (India) Delta/B.1.617.2 (India) Omicron/B.1.1.529 South Africa November 2021)GKA (AY.4/BA.1) recombinantNoNo


Taiwan5,168,949(ranked #23)
322,462 new infections in 14 days
26,713 (ranked #6)9,773 (ranked #65)
4521.61%B2 lineageAlpha/B.1.1.7 (UK)Delta/B.1.617.2 (India) Delta/B.1.617.2 (India) Omicron/B.1.1.529 South Africa November 2021)NoNo
Japan17,983,797(ranked #10)
2,897,493 new infections in the last 14 days
227,139(ranked #1)38,197(ranked #27)
3,660 new deaths in the last 14 days
31014.31%
2.31% of population has been infected in the last 14 days
B2 lineageAlpha/B.1.1.7 (UK)Delta/B.1.617.2 (India) Delta/B.1.617.2 (India) Omicron/B.1.1.529 South Africa November 2021)BA.2*BA.5*NoNo

What Our Team Is Reading This Week

COVID-19

What You Should Know about Omicron

The Omicron variant of SARS-CoV-2, the virus that causes COVID-19, was first identified in South Africa and was classified as a Variant of Concern by both WHO and CDC in November 2021. The first Omicron case to be sequenced in the US was identified in California on December 1 and the first reported death due to Omicron in the US was on December 20 in Texas. According to GISAID, in the last 30 days, the United States only sequenced about 2.56% of COVID cases (compare this to 9.8% in the UK, 6% in Australia, 18% in Denmark, and 17% in Israel), which would explain why we’re late to the game in addressing Omicron. 

In under three weeks, Omicron has become the dominant variant in the US.  

In the US, Omicron went from making up 12.6% of new COVID cases two weeks ago (week ending 12/11/32) to making up 73% of cases last week (reported 12/18/21). That’s an increase of more than 400% in one week. By comparison, the Delta doubled about once a week, going from around 3% of cases in mid-June to 41% of cases by early July and 62% of cases by mid-July. Omicron became the dominant variant in the US in less than half the amount of time that Delta did. 

Source: CDC https://covid.cdc.gov/covid-data-tracker/#variant-proportions  

In Los Angeles County, new COVID infections per day (8,000+) are now over triple what they were a week ago.

Source: https://twitter.com/lapublichealth 

In December, Monterey County has seen a spike in cases for all age groups, but especially for children 12-17. 

Source: https://www.co.monterey.ca.us/government/departments-a-h/health/diseases/2019-novel-coronavirus-covid-19/2019-novel-coronavirus-2019-ncov-local-data-10219 

Statewide, this past weekend, California averaged 2,456 more new cases per day than the previous weekend. 

*Includes weekend cases—average 6,301 new cases per day. Source: https://www.cdph.ca.gov/Programs/OPA/Pages/NR21-360.aspx 

*Includes weekend cases—average 8,757 new cases per day, an increase of 2,456. Source: https://www.cdph.ca.gov/Programs/OPA/Pages/NR21-351.aspx 

In the United States, as of 12/23/21, cases, deaths, and hospitalizations are trending upward.

Cases are up 55% over the last 14 days, deaths are up 7%, and hospitalizations are up 10%. 

Source: NY Times https://www.nytimes.com/interactive/2021/us/covid-cases.html 

Nearly everyone (vaccinated or not, previously infected or not) who is exposed to Omicron is likely to become infected; vaccines will still prevent many infections, hospitalizations, and deaths, just not as many as with previous variants.

A study in South Africa found that during the current Omicron wave, two doses of the Pfizer vaccine provided “70% protection against severe complications of COVID-19 requiring hospitalisation, and 33% protection against COVID-19 infection.”  In addition, researchers at Imperial College London estimate that the reinfection risk for Omicron is 5.4 times higher than for Delta, meaning that folks with previous COVID infections are likely to have limited protection. 

Monoclonal antibody treatment (MAB) has saved the lives of many patients infected with other variants; it appears to be less effective against Omicron.

Two preprints, one published by German researchers on December 7, and another, a collaboration between American, Italian, Swiss, and Australian researchers, published on December 14, both suggest that due to Omicron’s 37 mutations in the Spike protein, 15 of which are in the receptor binding domain (RBD), it is able to evade our currently-available monoclonal antibody drugs. As William Haseltine explains in his write-up of the December 14 preprint: “Of the eight approved or authorized antibodies, all but sotrovimab completely or almost completely lost their neutralizing activity against the Omicron pseudovirus,” and “sotrovimab…retained neutralizing activity, but at a significant reduction.”

Omicron spreads more easily in households than Delta does, making it more likely that people will infect their loved ones this winter.

Data collected in UK households suggests that the secondary attack rate (chance that an index case in a household will infect someone else) for Omicron is 21.6%, compared to 10.8% for Delta. 

Children may be at higher risk of contracting Omicron and being hospitalized, compared to previous variants. 

A South African study found that “Despite very low absolute incidence, preliminary data suggests that children have a 20% higher risk of hospital admission in Omicron-led fourth wave in South Africa, relative to the D614G-led first wave.” And in England, hospital admissions for children over the last week are at an all-time high of 396. 

Source: https://twitter.com/Antonio_Caramia/status/1474428188398862339/photo/1 

This morning, the Washington Post reported that pediatric hospitals around the country are filling up; over the past three days, approximately 800 children per day were admitted for COVID infections. 

Even mild infections can have severe consequences, like Long COVID and MIS-C. Those infected with Omicron who develop mild infections may still face long-term health complications due to Long COVID and/or MIS-C, and many of these patients in the US will go without proper diagnosis and treatment. Ed Yong has documented for The Atlantic how even health care workers have been dismissed and denied treatment for Long COVID. And yes, children also get Long COVID

Now that you know more about Omicron, what should you do?

  1. Wear a highly-protective mask, like an N95 or KN95. Beware of fakes. Do not order from a website like Amazon, which does not vet its suppliers. Project N95 is a trustworthy supplier of masks. For more on how to buy a quality mask online, see this NY Times piece and also this one. If you are not able to purchase an N95 or KN95 mask, layer a cloth mask over a surgical mask for a tight fit. Always make sure your mask covers your nose, mouth, and chin, with no gaps at the top or around the sides. 
  1. Get your booster vaccine as soon as possible. Per CDC, everyone 16+ should receive a booster shot. If you are not yet fully vaccinated, get vaccinated, and encourage friends and family to do the same. Everyone age 5+ can be vaccinated. LA County residents can go here to find information on where to get vaccinated. US residents can text your ZIP code to 438829 or call 1-800-232-0233 to find vaccine locations near you.
  1. Gather outdoors and keep distance between you and people from outside your household. Because COVID is airborne, when people gather indoors, the virus builds up in the air, making it more likely for people to get infected. Think about it like cigarette smoke. If you allowed someone to smoke inside your house, the smoke would stay in the air, even hours later, making your indoor air unsafe to breathe. If you had a backyard barbecue and the same person went to the far corner of your yard (away from other people) to smoke, the chances of you breathing that smoke would be significantly lower. 
  1. If you must gather indoors, make sure everyone masks and that the space is well-ventilated. Open windows and use HEPA air purifiers whenever possible. Don’t have an air purifier? You can make a simple but effective one using HVAC filters and a box fan
  1. Test before and after you gather. If hosting a gathering, you can ask your guests to take a rapid antigen test at home on the day of the event. These tests, like Abbott’s Binax and Quidel’s Quickvue, don’t catch 100% of infections, but they will catch many. There are some tests (made by Applied DNA Sciences, Meridian Bioscience and Tide Laboratories) that the FDA has said cannot identify the Omicron variant, so take care to avoid those. 
  1. Avoid gathering with unvaccinated people. Make it clear to friends and family that gathering with you is a privilege, not a right. Vaccine-hesitant loved ones may find the motivation they need to get vaccinated if they realize that’s the only way that they’ll be seeing you. 
  1. Get your flu shot. COVID isn’t the only thing putting people in the hospital this winter, and it’s possible to be infected with both flu and COVID. A flu shot is the best defense against the flu. 
  1. If you develop COVID symptoms or flu-like symptoms: get tested for COVID-19. If you test negative for COVID, you may have the flu. If you believe you have the flu and have tested negative for COVID, you should request a prescription from your doctor for Tamiflu within the first 72 hours. 

COVID-19

SARS-CoV-2 Update

  • In the last 14 days, the number of COVID-19 infections in the United States has increased by 11,097 infections per day compared to the preceding 14-day period.
  • For the pandemic in the United States we are averaging one death for every 56 infections reported or 17,856 deaths for each one million infections. 
  • The Delta variant is now the dominant variant in the United States, and recent surges around the country and some vaccine breakthrough cases and deaths have been attributed to Delta. 
  • In Massachusetts, 303 fully-vaccinated patients were hospitalized for COVID-19 and 79 (26%) of these died.
  • As of July 12, the CDC reports that 3,733 fully-vaccinated people have been hospitalized with COVID-19 and 791 fully-vaccinated people have died of COVID-19 (up from 656 on June 28). 
  • In 49 states, from July 1 to July 8, 19,482 COVID-19 cases in children were reported. In 24 of those states, 130 children were hospitalized with COVID-19 over the same one-week period and 9 children died. 
  • In California, between June 30 and July 14, the California Department of Public Health reported 6 COVID-19 deaths in children. 
  • Worldwide, 6.4 million people were infected with COVID-19 in the 14-day period from 7/3/21-7/16/21. 

It’s time for our next 14-day moving average determinations for SARS-CoV-2 for the United States and my thoughts on vaccines and mutant viruses. We use the WORLDOMETERS aggregators data set to make any projections since it includes data from the Department of Veterans Affairs, the U.S. Military, federal prisons and the Navajo Nation.

In the United States, SARS-CoV-2 deaths have decreased for the twelfth time in a 14-day period. There were 24 fewer deaths per day than in the last 14-day period. In the last 14 days, the number of infections has increased by 11,097 infections per day than in the preceding 14-day period.  Our infections per day are rising again, probably secondary to SARS-CoV-2 mutant Delta/B.1.617.2. I would predict that the opening of schools, places of worship, bars, restaurants, indoor dining and travel all will contribute to further spread of SARS-CoV-2 mutants, like the Delta and Lambda  variants and rising numbers  in infections, hospitalizations and deaths in the coming months. Increased traveling as well as summer vacations, and the July 4 holiday will all cause further increases. Vaccinations, increased mask usage and social distancing, which are a part of the Biden SARS-CoV-2 plan (day 178 of plan) will be necessary to stop spread of mutants and cause  further reductions in infections, hospitalizations and deaths in the future. On 7/16/21, the United States had 40,529 new infections. There were also 293 deaths. The number of hospitalized patients is again increasing and 4,876 patients are still seriously or critically ill. The number of critically ill patients has increased by 1,010 in the last 14 days, while 3,450 new deaths occurred. The number of critically ill patients is increasing for the first time in seven 14-day periods and a large number of patients are still dying each day (average 246/day). 

As of 7/16/21, we have had 624,606 deaths and 34,929,856 SARS-CoV-2 infections in the United States. We have had 343,676 new infections in the last 14 days. We are adding an average of 171,838 infections every 7 days. For the pandemic in the United States we are averaging one death for every 56 infections reported or 17,856 deaths for each one million infections. As of 7/16/21, thirty-two states have had greater than 500,000 total infections, and 33 states have had greater than 5,000 total deaths. Ten states (Ohio, Michigan, Georgia, Illinois, New Jersey, Pennsylvania, Florida, Texas, New York and California) have had greater than 20,000 deaths. Four states (Florida, Texas, New York, and California) have had greater than 35,000 deaths. In the world, 44 other countries have greater than 500,000 infections and 43 countries have greater than 10,000 deaths. Sixteen other countries have greater than 35,000 deaths. Two more countries, Columbia and Argentina, join eight other countries with over 100,000 deaths from SARS-CoV-2. Only 2.44% of the world has been infected to date.

On 11/20/20 in the United States, 3.70% of the population had a documented SARS-CoV-2 infection. California was ranked 41st in infection percentage at 2.77%. In North Dakota 9.18% of the population was infected (ranked #1), and in South Dakota 8.03% of the population was infected (ranked #2).

As of 7/16/21, in the United States, 10.48% of the population has had a documented SARS-CoV-2 infection. In the last 9 months, 7% of our country became infected with SARS-CoV-2. 

As of 7/16/21, California was ranked 37th in infection percentage at 9.76%. In North Dakota 14.56% of the population was infected (ranked #1), while Rhode Island was at 14.43% (ranked #2) and South Dakota was at 14.10% of the population infected (ranked #3). Thirty-three states have greater than 10% of their population infected and 42 states have greater than 9% of their population infected. Only one state has less than 3% of their population infected: Hawaii (2.75%).

The Threat of SARS-CoV-2 Variants

In a response to the need for “easy-to-pronounce and non-stigmatising labels,” at the end of May, the World Health Organization assigned a letter from the Greek alphabet to each SARS-CoV-2 variant. GISAID, Nextstrain, and Pango will continue to use the previously established nomenclature. For our purposes, we’ll be referring to each variant by both its Greek alphabet letter and the Pango nomenclature. 

The WHO has sorted variants into two categories: Variants of Concern (VOC) and Variants of Interest (VOI). The criteria for Variants of Concern are as follows:

  • Increase in transmissibility or detrimental change in COVID-19 epidemiology; or 
  • Increase in virulence or change in clinical disease presentation; or 
  • Decrease in effectiveness of public health and social measures or available diagnostics, vaccines, therapeutics.  

The WHO categorizes the following four variants as Variants of Concern (VOC):

The criteria for Variants of Interest (VOI) are as follows:

  • has been identified to cause community transmission/multiple COVID-19 cases/clusters, or has been detected in multiple countries; OR  
  • is otherwise assessed to be a VOI by WHO in consultation with the WHO SARS-CoV-2 Virus Evolution Working Group. 

The WHO categorizes the following six variants as Variants of Interest (VOI):

The two variants of concern that have garnered most of our attention recently are Alpha (B.1.1.7) and Delta (B.1.617.2). Alpha, first detected in the United Kingdom in September of 2020, has been detected in almost every country and all 50 states in the U.S. Up until this week, Alpha was the dominant variant in the United States, accounting for 60-70% of cases in May and early June.  

Source: GISAID

Alpha is more infectious than other previously circulating B2 lineage isolates. There are two deletions and six other mutations in its spike protein. One mutation involves a change of one amino acid, an asparagine at position 501 in the receptor binding motif with a tyrosine. This enhances binding (affinity) to the ACE-2 receptor and may alone be responsible for the increased infectivity of this isolate. A study published March 10 in the British Medical Journal (BMJ) found that the risk of death increased by 64% in patients infected with Alpha compared to all other isolates (known at the time). 

While Alpha continues to pose a threat, the increased prominence of the Delta variant (B.1.617.2), first identified in India, is a concern for several reasons. 

First, there is some evidence to suggest that Delta is more transmissible than other variants, including Alpha. This may be due to a mutation, P681R, near the furin cleavage site, and/or due to a deletion in the N-terminal domain (NTD) of the spike protein. In Australia, public health officials have described a handful of cases where transmission of the Delta variant occurred after “fleeting encounters”— five to ten seconds of close contact between strangers in a public place like a gym or a restaurant. 

Second, Delta leads to more severe infections. According to a recent study in Scotland, “Risk of COVID-19 hospital admission was approximately doubled in those with the Delta VOC when compared to the Alpha VOC.” 

Lastly, there is evidence of reduced vaccine effectiveness with Delta. The variant appears to be particularly evasive in people who have had only one dose of vaccine. A Scottish study estimated the vaccine effect against Delta after one dose to be 30% for the Pfizer vaccine and 18% for the AstraZeneca vaccine. After two doses, it was 79% for Pfizer and 60% for AstraZeneca. 

Considering these factors, it is not surprising that Delta is on track to overtake Alpha (B.1.1.7) as the dominant variant worldwide. In the past month, it accounted for 98.9% of isolations in India, 99% of isolations in the United Kingdom, 95.9% in Singapore, 95.1% in Indonesia, 98.3% in Israel, and 89.9% in Australia. In the United States, Delta has been the dominant variant for about a month; as of July 18, it accounted for 62.2% of isolations in the past four weeks, compared to 41.8% two weeks ago, 12.9% four weeks ago and 3.7% six weeks ago. This suggests the proportion of Delta cases is nearly doubling every week. 

Source: GISAID

Two weeks ago, we warned that with the increased prevalence of Delta, the United States would see rises in infections, hospitalizations, and deaths, just as we’ve seen in India, the United Kingdom, and Israel. Over the coming weeks, we’ll see how differing public health responses (or lack thereof) impact these nations and our own. Despite rising case counts, hospitalizations, and deaths, the United Kingdom still plans to end most COVID-19 restrictions, including mask mandates and social distancing, on July 19. 

Israel, by contrast, is taking steps to restrict travel into the country and will criminally charge people infected with COVID-19 who do not follow quarantine rules. Israel also reinstated its mask mandate at the end of June, following two school outbreaks. An estimated 57% of Israel’s population have received two doses of the Pfizer vaccine. 

The CDC estimates that for the two-week period ending in July 3, the Delta variant made up 57% of US cases. The NY Times reports that nationwide, compared to the previous 14 days, COVID-19 cases are up 140% (compared to 14% two weeks ago). One state getting hit particularly hard by Delta is Missouri, where Delta accounts for 74% of COVID-19 cases. As of July 18, new COVID-19 cases in Missouri were up 102% compared to the previous 14 days, hospitalizations were up 45%, and deaths were up 27%. Some Missouri hospitals have run out of ventilators. The NY Times reports that as of July 18, only 40% of Missouri residents have been fully vaccinated. In the 12-17 age group only 26% have been vaccinated. Missouri never implemented a state-wide mask mandate, and most local mask mandates were lifted at the end of May, along with distancing and capacity restrictions for businesses. All state workers in Missouri were directed to return to in-person work by May 17.  

Other states with significant increases in cases over the last 14 days are Tennessee (+340%), Alabama (+310%), Massachusetts (+291%), Puerto Rico (+249%), Vermont (+244%), California (+198%), Georgia (+193%), Florida (+193%), Louisiana (+176%), and New York (+167%). No state had a decrease in average daily cases over the last 14 days. 

Keeping in mind the potential of variants to evade vaccines, I believe it’s important that we pay attention to instances of vaccine failure. Prior to April 30, 2021, the CDC reported all breakthrough infections. From January 1, 2021 to April 30, 2021, there were 10,262 breakthrough infections, 27% of which were asymptomatic and 995 of which were hospitalized. Of the hospitalized patients, 160 (16%) died. 

Between May 1 and June 28, there were 4,686 breakthrough cases reported to the CDC that resulted in hospitalization or death. (The CDC no longer tracks breakthrough cases that do not result in hospitalization or death.) As of June 28, the CDC reports that 656 fully-vaccinated people have died of COVID-19. This means that 496 of those deaths occurred between May 1 and June 28. Whereas the period from January 1 to April 30 had an average of 40 COVID deaths per month in fully-vaccinated people, the period from May 1 to June 28 had an average of 248 deaths per month. This constitutes a 6-fold increase. We can’t say with certainty whether this increase in deaths is related to the rise in prevalence of the Delta variant, but there is certainly a correlation. Delta accounted for less than 1% of cases at the end of April, about 3% at the end of May, and an estimated 51% in the last two weeks of June. 

Between May 1 and July 12, there were 5,492 breakthrough cases reported to the CDC that resulted in hospitalization or death, an increase of 806 from June 28. (The CDC no longer tracks breakthrough cases that do not result in hospitalization or death.) As of July 12, the CDC reports that 3,733 fully-vaccinated people have been hospitalized with COVID-19 and 791 fully-vaccinated people have died of COVID-19 (up from 656 on June 28). This means that 135 of those deaths occurred between June 29 and July 12. Whereas the period from January 1 to April 30 had an average of 40 COVID deaths per month in fully-vaccinated people, the period from May 1 to June 28 had an average of 248 deaths per month. Now we have an additional 135 deaths in just 14 days. We can’t say with certainty whether this increase in deaths is related to the rise in prevalence of the Delta variant, but there is certainly a correlation. Delta accounted for less than 1% of cases at the end of April, about 3% at the end of May, and an estimated 51% in the last two weeks of June. 

Reporting from around the country suggests that Delta appears to be playing a role in the rise of infections in fully-vaccinated people. In Massachusetts, which has had at least 202 cases of Delta, the Boston Globe reports that 4,450 infections have occurred in vaccinated people. Of these, 303 patients were hospitalized and 79 died (26% of hospitalized, 1.77% of infected). By comparison, 34,929,856 infections have occurred in the United States with 624,606 deaths for a crude death rate of 1.78%.

On July 15, Clark County, Nevada reported 122 COVID-19 hospitalizations in fully-vaccinated people, with 18 deaths (14.7%) among those hospitalized and an additional two deaths of patients who were not hospitalized. The county no longer tracks breakthrough cases in folks who are not hospitalized, but the Southern Nevada Health District previously disclosed to the Las Vegas Review-Journal that, as of June 22, there had been 471 breakthrough infections, of which 53 patients were hospitalized, and 8 died. Based on this data, we can estimate the death rate for breakthrough infections in Clark County to be 1.69%. Clark County has also released demographic data for the hospitalized breakthrough cases. In 72% of cases, the patient was over the age of 65; males accounted for 66% of cases. A majority of cases (60%) were in white patients, 15% Black, 12% Hispanic, 7% Asian American or Pacific Islander, 3% other, and 2% unknown. Patients who had received the Pfizer vaccine accounted for 54% of hospitalizations, Moderna 23%, Johnson & Johnson 15%, and unknown 8%. Underlying medical conditions were present in 84% of hospitalized patients, including diabetes (38%), hypertension (54%), chronic lung disease (30%), chronic kidney disease (15%), neurological conditions (10%), immunocompromised (8%), and other conditions (59%). Nevada has had at least 1,066 cases of Delta.

In Illinois, NBC Chicago reports that as of July 14, 563 fully-vaccinated people have been hospitalized with COVID-19, and 151 of those (26.8%) have died. Illinois has had at least 313 cases of Delta. 

In California, between January 1 and July 14, CDPH reports 14,365 COVID-19 infections in fully-vaccinated people, with 843 of these being hospitalized (5.9%). Of the hospitalized, 88 have died (10.4% of hospitalized). This puts the death rate for fully-vaccinated people who become infected at 0.6%. California has had at least 2,871 cases of Delta. 

We want to stress that the COVID-19 vaccines are still highly effective for preventing hospitalizations and deaths. Those who are not vaccinated should get vaccinated as quickly as possible. Folks who are vaccinated should continue to rely on additional layers of protection against COVID-19, like masking indoors and avoiding gatherings. To protect employees and avoid outbreaks, employers should continue to require masking in the workplace. It’s important to keep in mind that the clinical trial efficacy data that we have for the vaccines is based on a population who were most likely masking indoors for the duration of the trial. We should, therefore, assume that the vaccines are most effective when people are also masking. Public health agencies that want to control the spread of COVID-19 should follow the example of Los Angeles County Public Health and institute indoor mask mandates (for both the unvaccinated and vaccinated) as soon as possible. 

Variants of (Slightly Less) Concern

At 2,439 cases, the United States has the second highest number of isolations of the Beta variant (B.1.351, first identified in South Africa), and 6 of these were in the last four weeks. The Beta variant now accounts for only 0.1% of isolations in the U.S.

The United States still has the most isolations of the Gamma variant (P.1) in the world, with 20,645 overall and 697 in the past four weeks. Gamma accounted for 6.4% of isolations in the past month, down from 9.2% two weeks ago. Gamma still accounts for 85.9% of infections in Brazil.

The WHO has also recently labeled the Lambda variant (C.37), which was first identified in Peru in August of 2020, as a variant of interest. The United States has the second largest number of isolations of Lambda, after Chile, with 706 total and 32 in the past four weeks. Lambda causes over 80% of infections in Peru, which experienced a surge in new cases this spring and, as of July 17, has had 2,093,754 infections and 195,146 deaths. Strangely, some South American countries (Peru, Colombia) have stopped reporting new isolations of Lambda to GISAID. 

COVID-19 in California

The following data were reported by the California Department of Public Health:

Total CasesNew CasesTotal DeathsNew DeathsHospitalizedIn ICUFully Vaccinated
6/4/213,687,7361,04762,179871,06226017,662,712
6/5/213,688,8931,15762,242631,04224317,813,305
6/6/213,689,9941,10162,4702281,03522117,947,342
6/7/213,690,86887462,47331,01121918,011,744
6/8/213,691,66079262,47961,01522818,100,412
6/9/213,692,50684662,499201,03023118,240,912
6/10/213,693,36285662,538391,00123418,431,265
6/11/213,694,4981,13662,5935598223318,542,484
6/12/213,695,5301,03262,508-8595524018,637,504
6/13/213,696,47294262,512491524118,694,365
6/14/213,697,29982762,505-793923918,731,215
6/15/213,697,92762862,5151097725118,875,034
6/16/213,698,62669962,5341998124218,970,053
6/17/213,699,45582962,5653195623219,074,396
6/18/213,700,7501,29562,6225795123319,164,548
6/19/213,702,2371,48762,661391,27119,164,548
6/20/213,702,88264562,689281,24919,164,548
6/21/213,704,0051,12362,693492923819,343,396
6/22/213,704,64063562,701894924319,398,536
6/23/213,705,42778762,7414097828719,454,555
6/24/213,706,8461,41962,8228195527419,541,124
6/25/213,708,8612,01562,8906895927419,621,174
6/26/213,711,9283,06762,9596995927419,621,174
6/27/213,712,79586762,9903195927419,621,174
6/28/213,714,0511,25662,994498029019,880,275
6/29/213,714,81376262,99951,05028819,941,886
6/30/213,710,4542,01363,023241,08930720,014,043
7/1/213,712,1521,69863,096731,09030020,073,302
7/2/213,713,9441,79263,141451,07129520,073,302
7/3/213,715,3771,43363,165241,07129520,073,302
7/4/213,716,8101,43363,189241,07129520,073,302
7/5/213,718,2431,43363,213241,07129520,073,302
7/6/213,719,6741,43363,238241,15329820,240,207
7/7/213,721,0061,33263,259211,22829920,296,653
7/8/213,722,4221,41663,317581,31931820,371,928
7/9/213,724,8332,41163,376591,34312120,417,009
7/10/213,727,8032,97063,408321,34312120,417,009
7/11/213,730,7732,97063,440321,34312120,417,009
7/12/213,733,7432,97063,472321,48434120,518,392
7/13/213,736,9993,25663,47861,59435720,562,625
7/14/213,740,0923,09363,508301,64835920,615,554
7/15/213,743,7143,62263,533251,73137920,664,238
7/16/213,748,3654,65163,598651,77040320,705,050

*Data for 7/3/21-7/6/21 and 7/10/21-7/12/21 were reported in bulk on 7/6/21 and 7/12/21, respectively. We’ve divided the new cases evenly among those days. 

An examination of cases broken down by age group reveals that the 18-49 age group continues to have the highest rate of infection. There was a marked increase in new daily cases in this age group from July 8 to July 16, with moderate increases for the other three age groups. 

Despite the availability of vaccines for children 12 and up, in California, we have not seen a marked decrease in the number of new cases in children over the past two weeks. From July 3 to July 16, the 0-17 age group averaged 369 new infections per day, a 33% increase compared to the previous 14-day period. (The daily average for June 19-July 2 was 276.) As of July 14, the California Department of Public Health reports 7 deaths in children under the age of 5 (an increase of 3 since June 30) and 21 deaths in children ages 5-17 (an increase of 3 since June 30). To date, 490,318 children in California have been infected with COVID-19. The US Census Bureau estimates that there are 8,890,250 children in California, so approximately 5.5% of children have had a documented case of COVID-19.

Watching World Data

Over the next few months, we’ll be paying close attention to correlations between the SARS-CoV-2 data, the number of isolates identified in various countries and states, and the non-pharmaceutical interventions (like mask mandates and lockdowns) put in place by state and national governments. Data on infections, deaths, and percent of population infected was compiled from Worldometers. Data for this table for SARS-CoV-2 Isolates Currently Known in Location was compiled from GISAID and the CDC. It’s worth noting that GISAID provided more data than the CDC.

LocationTotal Infections as of 7/02/21New Infections on 7/02/21Total DeathsNew Deaths on 7/02/21% of Pop.InfectedSARS-CoV-2 Isolates Currently Known in LocationNational/ State Mask Mandate?Currently in Lockdown?
World190,270,873(6,453,915 new infections in 14 days)562,8174,091,488(111,620 new deaths in 14 days)8,6532.44%B2 lineageAlpha/B.1.1.7 (UK)Eta/B.1.525 (Nigeria/UK)Iota/B.1.526 (USA-NYC)Beta/B.1.351 (SA)Epsilon/B.1.427 + B.1.429 (USA)*Gamma/P.1 (Brazil)Zeta/P.2 (Brazil)A lineage isolateV01.V2 (Tanzania)APTK India VOC 32421Delta/B.1.617.2 (India)BV-1 (Texas, USA)Kappa/B.1.617.1 (India)Lambda/C.37 (Peru)Theta/P.3 (Philippines) NoNo
USA34,929,856
(ranked #1)
40,529
(ranked #4)
624,606
(ranked #1)
29310.48%B2 lineageAlpha/B.1.1.7 (UK)Eta/B.1.525 (Nigeria/UK)Iota/B.1.526 (USA-NYC)Beta/B.1.351 (SA)Epsilon/B.1.427 + B.1.429 (USA)*Gamma/P.1 (Brazil)Zeta/P.2 (Brazil)Delta/B.1.617.2 (India)BV-1 (Texas, USA)Theta/P.3 (Philippines) Theta/P.3 (Philippines) Kappa/B.1.617.1 (India)Lambda/C.37 (Peru)NoNo
Brazil19,308,108(ranked #3)   45,591(ranked #3) 540,500(ranked #2)1,4509.01%B2 lineageAlpha/B.1.1.7 (UK)Beta/B.1.351 (SA)Gamma/P.1 (Brazil)Zeta/P.2 (Brazil)Lambda/C.37 (Peru)NoNo
India31,063,987(ranked #2)38,112(ranked #5)413,123(ranked #3)5602.22%B2 lineageAlpha/B.1.1.7 (UK)Beta/B.1.351 (SA)Gamma/P.1 (Brazil)Epsilon/B.1.427 + B.1.429 (USA)*Eta/B.1.525 (Nigeria/UK)APTK India VOC 32421Delta/B.1.617.2 (India)Kappa/B.1.617.1 (India)Iota/B.1.526 (USA-NYC)NoNo
United Kingdom5,332,371(ranked #7)51,870(ranked #2)128,642497.81%B2 lineageAlpha/B.1.1.7 (UK)Eta/B.1.525 (Nigeria/UK)Beta/B.1.351 (SA)Epsilon/B.1.427 + B.1.429 (USA)*Gamma/P.1 (Brazil)Delta/B.1.617.2 (India)Theta/P.3 (Philippines) Kappa/B.1.617.1 (India)Lambda/C.37 (Peru)NoNo
California, USA3,748,365(ranked #11 in world)4,65163,598659.76%B2 lineageAlpha/B.1.1.7 (UK)Eta/B.1.525 (Nigeria/UK)Beta/B.1.351 (SA)Gamma/P.1 (Brazil)Epsilon/B.1.427 + B.1.429 (USA)*Zeta/P.2 (Brazil)Delta/B.1.617.2 (India)Theta/P.3 (Philippines) Kappa/B.1.617.1 (India)Lambda/C.37 (Peru) NoNo
Mexico2,525,350(ranked #16)12,288235,740(ranked #4)2352.01%B2 lineageAlpha/B.1.1.7 (UK)Epsilon/B.1.427 + B.1.429 (USA)*Gamma/P.1 (Brazil)Delta/B.1.617.2 (India)Kappa/B.1.617.1 (India)Lambda/C.37 (Peru)NoNo
South Africa2,269,179(ranked #17)15,93966,3854133.77%B2 lineageAlpha/B.1.1.7 (UK)Beta/B.1.351 (SA)Delta/B.1.617.2 (India)Kappa/B.1.617.1 (India)NoNo
Canada1,422,641(ranked #25)39526,489173.73%B2 lineageAlpha/B.1.1.7 (UK)Eta/B.1.525 (Nigeria/UK)Epsilon/B.1.427 + B.1.429 (USA)*Gamma/P.1 (Brazil)Delta/B.1.617.2 (India)Kappa/B.1.617.1 (India)Lambda/C.37 (Peru)Yes, except Alberta ProvinceNo
Poland2,881,241(ranked #14)9375,205147.62%B2 lineageAlpha/B.1.1.7 (UK)Eta/B.1.525 (Nigeria/UK)Beta/B.1.351 (SA)Delta/B.1.617.2 (India)NoNo
Turkey5,514,373(ranked #6)6,91850,450356.46%B2 lineageAlpha/B.1.1.7 (UK)Eta/B.1.525 (Nigeria/UK)Beta/B.1.351 (SA)Epsilon/B.1.427 + B.1.429 (USA)*Gamma/P.1 (Brazil)Lambda/C.37 (Peru)NoNo
Russia5,907,988(ranked #4)25,704                                                 148,8687994.04%B2 lineageAlpha/B.1.1.7 (UK)Beta/B.1.351 (SA)Delta/B.1.617.2 (India)NoNo
Argentina4,737,213(ranked #8)17,261101,15846310.38%B2 lineageAlpha/B.1.1.7 (UK)Eta/B.1.525 (Nigeria/UK)Beta/B.1.351 (SA)Epsilon/B.1.427 + B.1.429 (USA)*Gama/P.1 (Brazil)Delta/B.1.617.2 (India)Lambda/C.37 (Peru)NoNo
Colombia4,601,355(ranked #9)17,893115,3335008.94%B2 lineageAlpha/B.1.1.7 (UK)Beta/B.1.351 (SA)Gamma/P.1 (Brazil)Epsilon/B.1.427 + B.1.429 (USA)*Iota/B.1.526 (USA-NYC)Lambda/C.37 (Peru)NoNo
Peru2,090,175(ranked #19)2,032194,935(ranked #5)906.24%B2 lineageAlpha/B.1.1.7 (UK)Gamma/P.1 (Brazil)Iota/B.1.526 (USA-NYC)Lambda/C.37 (Peru)NoNo
Indonesia2,780,803(ranked #15)54,00071,5971,2051.00%B2 lineageAlpha/B.1.1.7 (UK)Delta/B.1.617.2 (India)Beta/B.1.351 (SA)Eta/B.1.525 (Nigeria/UK)Theta/P.3 (Philippines) Iota/B.1.526 (USA-NYC)Kappa/B.1.617.1 (India)NoNo
Iran3,485,940(ranked 13th)21,88586,7911994.09%B2 lineageAlpha/B.1.1.7 (UK)Delta/B.1.617.2 (India)Beta/B.1.351 (SA)NoNo
Spain4,100,222(ranked 11th) 31,06081,096128.76%B2 lineageAlpha/B.1.1.7 (UK)Delta/B.1.617.2 (India)Beta/B.1.351 (SA)Gamma/P.1 (Brazil)Epsilon/B.1.427 + B.1.429 (USA)*Eta/B.1.525 (Nigeria/UK)Iota/B.1.526 (USA-NYC)Kappa/B.1.617.1 (India)NoNo

*Also referred to as CAL.20C

SARS-CoV-2, Children, and MIS-C/PIMS

I’m pleased to see that COVID-19 cases and MIS-C (PIMS) cases in children in the US are finally getting national attention. The CDC now tracks total MIS-C cases and deaths in children and young adults up to 20 years old in the United States. As of June 28, CDC reported 4,196 cases of MIS-C that meet the case definition and 37 deaths—that’s 178 new cases and one new death since the June 2 report. The CDC notes, “As of October 1, the number of cases meeting the case definition for multisystem inflammatory syndrome in children (MIS-C) in the United States surpassed 1,000. As of February 1, this number surpassed 2,000, and exceeded 3,000 as of April 1.” This means it took seven months to reach 1,000 MIS-C cases, only four months to reach an additional 1,000 cases, and only two months to add an additional 1,185 cases. This suggests to us that variants are causing more MIS-C. 

Date of ReportingTotal MIS-C PatientsChange Since Last ReportTotal MIS-C DeathsChange Since Last Report
6/28/20214196+17837+1
6/2/20214018+27636+1
5/3/20213742+55735-1
3/29/20213185+56836+3
3/1/2021261733

Schools in the United States have been open throughout the pandemic, with teachers and education support professionals demonstrating their extraordinary ability to adapt in adverse circumstances. Teachers all over the country reinvented their teaching, taking their classrooms online in order to provide safe and remote learning experiences for students. The so-called “reopening” of schools, which more accurately refers to the opening of school buildings, as schools never closed, has been highly politicized, with many governors issuing mandates for in-person instruction, even as case counts, hospitalizations, and deaths in their states rose exponentially. The CDC has maintained that transmission risk in schools is minimal, provided that adequate safety measures are taken; however, we know that many states have not properly enforced universal masking (and some have repealed mask mandates), and we know that many school facilities are not equipped with the proper air handling systems. With more school buildings opening, there is a growing body of research that suggests that COVID-19 transmission can and does happen in schools. 

After recommending for months that school buildings be open, in mid-February (a year into the pandemic), The American Academy of Pediatrics, in collaboration with the Children’s Hospital Association, finally began tracking data on COVID-19 in children at the state and national level. Data reporting by states is still voluntary, and every state is different in its willingness to collect and disclose data on infections, hospitalizations, deaths, and testing rates in children. 

As of the APA’s July 8 report, only 11 states provide age distribution for testing. This makes it difficult to hold states accountable for testing each age group in proportion to its population. We’ve seen a trend in states where testing data with age distribution is available that children are tested at lower rates than adults. Test positivity rate among children ranged from 4.9% to 34.9% and children made up between 6% and 19.9% of total state tests in the 11 states that report testing data to APA. 

Hospitalization data by age group is only available in 24 states and New York City, so we only understand the severity of COVID-19 infections in children for about half the country. From July 1-8, 103 more children in these states were hospitalized with COVID-19. 

Age distribution for cases is provided by 49 states, New York City, the District of Columbia, Puerto Rico, and Guam. Age distribution for deaths is provided in 43 states, New York City, Puerto Rico, and Guam. It’s worth noting that New York State does not provide age data for cases, testing, hospitalizations, and deaths. Two states, Florida and Utah, only report cases in children aged 0-14, so the number of cases, hospitalizations, and deaths in children ages 15-17 is unknown in these states. As of June 30, the state of Nebraska no longer reports daily COVID-19 data and has taken down its online COVID-19 dashboard. 

In the week from July 1 to July 8, 19,482 COVID-19 cases in children were reported. The current case in children is 5,400 per 100,000. By comparison, according to Worldometers, the overall case rate per 100,000 people in the United States on July 18 was 10,498 cases per 100,000. As of July 8, children represented 14.2% of all COVID-19 cases reported to APA. A total of 344 child deaths due to COVID-19 were reported in 43 states; this is an increase of 9 child deaths since July 1. The following states do not report child mortality due to COVID-19: Michigan, Montana, New Mexico, New York, Rhode Island, South Carolina, and West Virginia. 

The AAP has also recently recommended that all children older than 2 years and all teachers and school staff wear masks in school, regardless of vaccination status. 

If we truly want to keep children safe, especially as many school buildings open for in-person instruction, we need to collect more complete data in every state on child testing rates, cases, hospitalizations, and deaths.

Vaccinating America’s Children

The New York Times reports that nationally, 56.6% of people 12 and up are fully vaccinated, while 59.3% of people 18 and up are fully vaccinated, according to the CDC. Only 48.4% of the total population is fully vaccinated. According to the CDC, at the current pace, it will take another year to get 85% of people 12 and older fully vaccinated. 

Some states are falling far behind when it comes to getting children—and the general population—fully vaccinated. Alabama and Mississippi have only fully vaccinated 34% of their population. Vermont, Maine, Massachusetts, and Connecticut have fully vaccinated more than 60% of their population, with Vermont having the highest vaccination rate at 67%. California has fully vaccinated 52% of their population. 

The Road Ahead

President Biden has made the pandemic a first priority and has now ordered enough vaccines to vaccinate everyone who wants a vaccination by the end of this month. As of 7/7/21, the CDC reports that 182.8 million people (approximately 55.1% of the population) have had one dose of any vaccine. 157.9 million people (47.6% of the population) are fully vaccinated. The rate of people who are fully vaccinated has increased by less than 3% in the past two weeks. 

As of May 10, all people in the U.S. over the age of 12 are eligible to receive a vaccine. The Biden administration has already exceeded its goal of administering 200 million doses of vaccine in the first 100 days of the administration. The Pfizer-BioNtech is already approved for ages 12-15 and the Moderna vaccine should be approved in June 2021. Moderna has applied for emergency use authorization to administer their mRNA vaccines to children aged 12-15. Testing is ongoing for children in younger age groups and may be approved for ages 2-11 by the end of September 2021. 

Testing, wearing masks, social distancing and washing our hands frequently should no longer be political issues. These are non-pharmaceutical interventions used by most successful countries and some states to protect their citizens and their economies. New Zealand, Taiwan, and Australia are three countries that have done this successfully. In the United States, Hawaii is doing a better job handling the pandemic than many of our states. These interventions and vaccination should keep the pandemic from overwhelming our health care delivery systems world-wide. New mutations like Epsilon/B.1.427 + B.1.429 and the Alpha, Beta, Gamma, and Delta variants will probably spread rapidly throughout the United States over the next 90 days as many states (ex. Texas, Florida, Iowa, Mississippi, Wyoming and South Carolina) open up everything and do away with masking and social distancing. We will probably see increased new infections per day in the United States. In the UK, Alpha/B.1.1.7, has increased the number of infections, hospitalizations and deaths. This and other mutants may do the same thing in the USA.

The Pfizer and Moderna RNA vaccines and the Johnson & Johnson single dose vaccination adenovirus vaccine are all being used to immunize people in the USA. The Oxford-AstraZeneca vaccine and the Novavax vaccine may be available in the fourth quarter of 2021. 

The bad news is that all currently available vaccines are based on the spike protein sequence identified in China in December 2019. Mutated isolates, as discussed above, may overtake our ability to produce new vaccines and vaccinate the populace. Like Influenza vaccines, we may have to reformulate vaccines based on active, worldwide surveillance at least every 4 to 6 months. The FDA is currently putting together a guidance document for how to develop booster vaccines for SARS-CoV-2 mutations. A surrogate marker of protection like antibody to the mutated Receptor Binding Domains of SARS-CoV-2 should be considered for vaccine approval. 

The ideal approach to addressing the major mutations on at least five continents would be to make vaccines against each of the mutations. I’d get all of the vaccine companies and contract production companies on a call and “suggest” that two companies at least make and mass produce one of the four mutations. The government would pay the cost and buy at least 200 million doses in advance for each variant at say $40 a dose. The total cost to purchase the vaccine (800 million doses) would only be 32 billion dollars. Give each company a billion dollars each for development costs (another 8 billion dollars). Spend another two billion dollars for syringes and you’ve got enough booster doses to vaccinate 200 million people for all 4 variants. 42 billion dollars would be a small price to pay to catch up with the current mutations. Even if you had to do this every two years, it would be well worth the dollars spent. 

We are not doing adequate numbers of PCR or antigen detection assays in the United States. According to Johns Hopkins University Coronavirus Resource Center, in January of 2021, we were doing up to 2,307,949 tests per day. In March 2021, the highest number of tests per day was 1,709,210, and in April, the highest number of tests per day was 2,008,319. Currently, we’re doing 665,774 tests per day (7-day moving average).

We still need to perform more virus isolations and perform more DNA sequencing of viruses in each country, state, populous city, and county if we are to rapidly identify new mutations. In December 2020, WHO asked countries to increase their sequencing rates, and the European Commission asked member states to set a goal of 10%. The CDC then set a goal of 5% for the United States. As of July 18, according to GISAID, the United States had a SARS-CoV-2 genome sequencing rate of 1.89%, whereas the United Kingdom had a genome sequencing rate of 10.7%. I’m more hopeful that we will have the facilities, the equipment, and the trained staff needed to perform this work. As a nation we still need to make and distribute more vaccines to other countries, new vaccines directed against mutants, and the necessary rapid tests and protective equipment needed by medical staff, first responders, essential workers and especially teachers and students. I’m still hopeful we can work together on our and the world’s infectious disease problems. 

What Our Team Is Reading This Week

COVID-19

SARS-CoV-2 Update

It’s time for our next 14-day moving average determinations for SARS-CoV-2 for the United States and my thoughts on vaccines and mutant viruses. We use the WORLDOMETERS aggregators data set to make any projections since it includes data from the Department of Veterans Affairs, the U.S. Military, federal prisons and the Navajo Nation.

In the United States, SARS-CoV-2 deaths have decreased for the eleventh time in a 14-day period. There were 30 fewer deaths per day than in the last 14-day period. In the last 14 days, the number of infections has decreased by 947 infections per day.  Our infections per day are still high, probably secondary to SARS-CoV-2 mutant Delta/B.1.617.2. I would predict that the opening of schools, places of worship, bars, restaurants, indoor dining and travel all will contribute to further spread of SARS-CoV-2 mutants and rising numbers  in infections, hospitalizations and deaths in the coming months. Increased traveling as well as summer vacations, and the July 4 holiday will all cause further increases. Vaccinations, increased mask usage and social distancing, which are a part of the Biden SARS-CoV-2 plan (day 188 of plan) will be necessary to stop spread of mutants and cause  further reductions in infections, hospitalizations and deaths in the future. On 7/02/21, the United States had 18,399 new infections. There were also 322 deaths. The number of hospitalized patients is decreasing, but 3,866 patients are still seriously or critically ill. The number of critically ill patients has decreased by 294 in the last 14 days, while 3,785 new deaths occurred. The number of critically ill patients is decreasing for the sixth 14-day period, but a large number of patients are still dying each day (average 270/day). 

As of 7/02/21, we have had 621,161 deaths and 34,580,198 SARS-CoV-2 infections in the United States. We have had 188,327 new infections in the last 14 days. We are adding an average of 94,163 infections every 7 days. Each million infections usually results in 10,000 to 20,000 deaths. On 7/02/21, thirty-two states have had greater than 500,000 total infections, and 33 states have had greater than 5,000 total deaths. Ten states (Ohio, Michigan, Georgia, Illinois, New Jersey, Pennsylvania, Florida, Texas, New York and California) have had greater than 20,000 deaths. Four states (Florida, Texas, New York and California) have had greater than 35,000 deaths. In the world, 42 other countries have greater than 500,000 infections and 60 other countries have greater than 5,000 deaths.

On 11/20/20 in the United States, 3.70% of the population had a documented SARS-CoV-2 infection. California was ranked 41st in infection percentage at 2.77%. In North Dakota 9.18% of the population was infected (ranked #1), and in South Dakota 8.03% of the population was infected (ranked #2).

As of 7/02/21, in the United States, 10.38% of the population has had a documented SARS-CoV-2 infection. In the last 9 months, 7% of our country became infected with SARS-CoV-2. 

As of 7/02/21, California was ranked 38th in infection percentage at 9.66%. In North Dakota 14.53% of the population was infected (ranked #1), while Rhode Island was at 14.40% (ranked #2) and South Dakota was at 14.08% of the population infected (ranked #3). Thirty-three states have greater than 10% of their population infected and 42 states have greater than 9% of their population infected. Only one state has less than 3% of their population infected: Hawaii (2.67%).

The Threat of SARS-CoV-2 Variants

In a response for the need for “easy-to-pronounce and non-stigmatising labels,” at the end of May, the World Health Organization assigned a letter from the Greek alphabet to each SARS-CoV-2 variant. GISAID, Nextstrain, and Pango will continue to use the previously established nomenclature. For our purposes, we’ll be referring to each variant by both its Greek alphabet letter and the Pango nomenclature. 

The WHO has sorted variants into two categories: Variants of Concern (VOC) and Variants of Interest (VOI). The criteria for Variants of Concern are as follows:

  • Increase in transmissibility or detrimental change in COVID-19 epidemiology; or 
  • Increase in virulence or change in clinical disease presentation; or 
  • Decrease in effectiveness of public health and social measures or available diagnostics, vaccines, therapeutics.  

The WHO categorizes the following four variants as Variants of Concern (VOC):

The criteria for Variants of Interest (VOI) are as follows:

  • has been identified to cause community transmission/multiple COVID-19 cases/clusters, or has been detected in multiple countries; OR  
  • is otherwise assessed to be a VOI by WHO in consultation with the WHO SARS-CoV-2 Virus Evolution Working Group. 

The WHO categorizes the following six variants as Variants of Interest (VOI):

The two variants of concern that have garnered most of our attention recently are Alpha (B.1.1.7) and Delta (B.1.617.2). Alpha, first detected in the United Kingdom in September of 2020, has been detected in almost every country and all 50 states in the U.S. Up until this week, Alpha was the dominant variant in the United States, accounting for 60-70% of cases in May and early June.  

Alpha is more infectious than other previously circulating B2 lineage isolates. There are two deletions and six other mutations in its spike protein. One mutation involves a change of one amino acid, an asparagine at position 501 in the receptor binding motif with a tyrosine. This enhances binding (affinity) to the ACE-2 receptor and may alone be responsible for the increased infectivity of this isolate. A study published March 10 in the British Medical Journal (BMJ) found that the risk of death increased by 64% in patients infected with Alpha compared to all other isolates (known at the time). 

While Alpha continues to pose a threat, the increased prominence of the Delta variant (B.1.617.2), first identified in India, is a concern for several reasons. 

First, there is some evidence to suggest that Delta is more transmissible than other variants, including Alpha. This may be due to a mutation, P681R, near the furin cleavage site, and/or due to a deletion in the N-terminal domain (NTD) of the spike protein. In Australia, public health officials have described a handful of cases where transmission of the Delta variant occurred after “fleeting encounters”— five to ten seconds of close contact between strangers in a public place like a gym or a restaurant. 

Second, Delta leads to more severe infections. According to a recent study in Scotland, “Risk of COVID-19 hospital admission was approximately doubled in those with the Delta VOC when compared to the Alpha VOC.” 

Lastly, there is evidence of reduced vaccine effectiveness with Delta. The variant appears to be particularly evasive in people who have had only one dose of vaccine. A Scottish study estimated the vaccine effect against Delta after one dose to be 30% for the Pfizer vaccine and 18% for the AstraZeneca vaccine. After two doses, it was 79% for Pfizer and 60% for AstraZeneca. 

Considering these factors, it is not surprising that Delta is on track to overtake Alpha (B.1.1.7) as the dominant variant worldwide. In the past month, it accounted for 91% of isolations in India, 97% of isolations in the United Kingdom, 96% in Singapore, 90% in Russia, 99% in Israel, and 73% in Australia. In the United States, Delta is now the dominant variant; as of July 6, it accounted for 41.8% of isolations in the past four weeks, compared to 12.9% two weeks ago and 3.7% four weeks ago. This suggests the proportion of Delta cases is nearly doubling every week. 

Source: GISAID

To predict the potential impact of Delta in the U.S., one need only look across the pond. COVID-19 cases in Scotland (where 51% of the population is fully vaccinated) reached a record high last week, overwhelming hospitals and causing some to cancel elective surgeries and most outpatient care. In England, average daily COVID-19 hospital admissions have increased by 52% in the last week. ONS data also reveal a shift in the proportion of young people being hospitalized for COVID-19, with the number of hospitalized 15-24 year-olds increasing steadily since May. Meanwhile, the UK plans to end social distancing and mask mandates on July 19. (My daughter says this is where I should insert a facepalm emoji.)

In Israel, where 56% of the population have received two doses of the Pfizer vaccine, the Delta variant accounts for approximately 99% of cases over the past month. Israel’s health ministry now reports that the Pfizer vaccine is only 64% effective in preventing infection, compared to data from May (before Delta became dominant in Israel) that suggested the vaccine was 94% effective. Israel dropped its mask mandate on June 18, with exceptions for air travel and long-term healthcare facilities, but reinstated the mandate on June 28 after two school outbreaks

As of July 3, the CDC estimates that the Delta variant makes up 51% of US cases. The NY Times reports that nationwide, compared to the previous 14 days, COVID-19 cases are up 14%. One state getting hit particularly hard by Delta is Missouri, where Delta accounts for 73% of COVID-19 cases. As of July 5, new COVID-19 cases in Missouri were up 45% compared to the previous 14 days, hospitalizations were up 24%, and deaths were up 68%. Some Missouri hospitals have run out of ventilators. The NY Times reports that as of July 5, only 39% of Missouri residents have been fully vaccinated. In the 12-17 age group only 23% have been vaccinated. Missouri never implemented a state-wide mask mandate, and most local mask mandates were lifted at the end of May, along with distancing and capacity restrictions for businesses. All state workers in Missouri were directed to return to in-person work by May 17.  

Keeping in mind the potential of variants to evade vaccines, I believe it’s important that we pay attention to instances of vaccine failure. Prior to April 30, 2021, the CDC reported all breakthrough infections. From January 1, 2021 to April 30, 2021, there were 10,262 breakthrough infections, 27% of which were asymptomatic and 995 of which were hospitalized. Of the hospitalized patients, 160 (16%) died. 

Between May 1 and June 28, there were 4,686 breakthrough cases reported to the CDC that resulted in hospitalization or death. (The CDC no longer tracks breakthrough cases that do not result in hospitalization or death.) As of June 28, the CDC reports that 656 fully-vaccinated people have died of COVID-19. This means that 496 of those deaths occurred between May 1 and June 28. Whereas the period from January 1 to April 30 had an average of 40 COVID deaths per month in fully-vaccinated people, the period from May 1 to June 28 had an average of 248 deaths per month. This constitutes a 6-fold increase. We can’t say with certainty whether this increase in deaths is related to the rise in prevalence of the Delta variant, but there is certainly a correlation. Delta accounted for less than 1% of cases at the end of April, about 3% at the end of May, and an estimated 51% in the last two weeks of June. 

Indeed, reports of fully-vaccinated people infected with the Delta variant may become more common. Author John Pavlovitz recently described his family’s experience. Pavlovitz, his wife, and their 16 year-old son were all fully vaccinated, while their 11 year-old daughter was not yet eligible. Their daughter developed COVID-19 symptoms and tested positive while the family was traveling, and it presumably spread to the other three family members when they returned home to quarantine together. (However, there’s really no way of knowing which family member was the index case. For all we know, one of the vaccinated family members could have been infected asymptomatically and passed the virus to the daughter.) Pavlovitz and his wife both developed COVID-19 symptoms, and their son had an asymptomatic infection. Pavlovitz admits that they should have been more careful to prevent household transmission. They apparently did not wear masks in the house, even after they learned their daughter was infected. They thought that since they’d been vaccinated, they didn’t have to worry about being infected. 

The experience of the Pavlovitz family suggests that it is prudent for vaccinated people to follow the World Health Organization’s guidance on masking: everyone, regardless of vaccination status, should continue to wear a mask when gathering with folks from other households indoors, when in close contact with people who are unvaccinated, and when in close contact with people who may be infected. Some U.S. local public health agencies, like Los Angeles County, agree. 

Variants of (Slightly Less) Concern

At 2,284 cases, the United States has the second highest number of isolations of the Beta variant (B.1.351, first identified in South Africa), and 6 of these were in the last four weeks. The Beta variant now accounts for only 0.1% of isolations in the U.S., down from 0.3% two weeks ago. 

The United States still has the most isolations of the Gamma variant (P.1) in the world, with 18,391 overall and 527 in the past four weeks. Gamma accounted for 9.2% of isolations in the past month, down from 12.1% two weeks ago. 

The WHO has also recently labeled the Lambda variant (C.37), which was first identified in Peru in August of 2020, as a variant of interest. The United States has the second largest number of isolations of Lambda, after Chile, with 635 total and 17 in the past four weeks. Lambda causes over 80% of infections in Peru which experienced a surge in new cases this spring and, as of July 6, has had 2,069,051 infections and 193,588 deaths. Peru averaged 2,426 new cases per day over the last week. Strangely, a number of South American countries (Peru, Argentina, Colombia) have stopped reporting new isolations of Lambda to GISAID. 

COVID-19 in California

The following data were reported by the California Department of Public Health:

DateTotal CasesNew CasesTotal DeathsNew DeathsHospitalizedIn ICUFully Vaccinated
6/4/213,687,7361,04762,179871,06226017,662,712
6/5/213,688,8931,15762,242631,04224317,813,305
6/6/213,689,9941,10162,4702281,03522117,947,342
6/7/213,690,86887462,47331,01121918,011,744
6/8/213,691,66079262,47961,01522818,100,412
6/9/213,692,50684662,499201,03023118,240,912
6/10/213,693,36285662,538391,00123418,431,265
6/11/213,694,4981,13662,5935598223318,542,484
6/12/213,695,5301,03262,508-8595524018,637,504
6/13/213,696,47294262,512491524118,694,365
6/14/213,697,29982762,505-793923918,731,215
6/15/213,697,92762862,5151097725118,875,034
6/16/213,698,62669962,5341998124218,970,053
6/17/213,699,45582962,5653195623219,074,396
6/18/213,700,7501,29562,6225795123319,164,548
6/19/213,702,2371,48762,661391,27119,164,548
6/20/213,702,88264562,689281,24919,164,548
6/21/213,704,0051,12362,693492923819,343,396
6/22/213,704,64063562,701894924319,398,536
6/23/213,705,42778762,7414097828719,454,555
6/24/213,706,8461,41962,8228195527419,541,124
6/25/213,708,8612,01562,8906895927419,621,174
6/26/213,711,9283,06762,9596919,621,174
6/27/213,712,79586762,9903119,621,174
6/28/213,714,0511,25662,994498029019,880,275
6/29/213,714,81376262,99951,05028819,941,886
6/30/213,710,4542,01363,023241,08930720,014,043
7/1/213,712,1521,69863,096731,09030020,073,302
7/2/213,713,9441,79263,141451,07129520,073,302
7/3/213,715,3771,433*63,165241,07129520,073,302
7/4/213,716,8101,43363,189241,07129520,073,302
7/5/213,718,2431,43363,213241,07129520,073,302
7/6/213,719,6741,43363,238241,15329820,240,207
7/7/213,721,0061,33263,259211,22829920,296,653

*Data for 7/3/21-7/6/21 were reported in bulk on 7/6/21. We’ve divided the new cases evenly among the four days. 

California dropped its mask mandate and most public space capacity limits on June 15. Over the past two weeks, daily new cases in California have hovered between 635 and 3,067. The two-week high for daily new cases occurred on June 26. More than 1,200 Californians are still hospitalized with COVID-19, with nearly 300 of those in the ICU. Since the beginning of July, 236 Californians have died of COVID-19. 

Age of Confirmed COVID-19 Cases

Date0-17 yrs Total0-17 New Cases18-49 yrs Total18-49 New Cases50-64 yrs Total50-64 New Cases65+ yrs Total65+ New CasesUnknown TotalUnknown New Cases
6/4/21480,5561702,114,286621700,579150390,0211112,294-5
6/5/21480,7431872,114,961675700,764185390,1351142,290-4
6/6/21480,9762332,115,563602700,952188390,210752,2933
6/7/21481,1501742,116,061498701,074122390,290802,2930
6/8/21481,2861362,116,510449701,212138390,359692,2930
6/9/21481,4331472,116,998488701,346134390,436772,2930
6/10/21481,5761432,117,480482701,491145390,522862,2930
6/11/21481,7721962,118,129649701,671180390,6371152,289-4
6/12/21481,9651932,118,723594701,826155390,722852,2945
6/13/21482,1261612,119,276553701,972146390,812902,286-8
6/14/21482,2911652,119,756480702,101129390,866542,285-1
6/15/21482,4061152,120,111355702,212111390,912462,2861
6/16/21482,5241182,120,523412702,312100390,983712,284-2
6/17/21482,6631392,121,032509702,429117391,045622,2862
6/18/21482,8752122,121,782750702,635206391,1701252,2882
6/21/21483,4305552,123,7291,947703,148391,4072,291
6/22/21483,5631332,124,094365703,24597391,455482,283-8
6/23/21483,6941312,124,566472703,375130391,507522,2852
6/24/21483,8751812,125,416850703,600225391,6521452,30318
6/25/21484,1112362,126,6051,189703,957357391,8702182,31815
6/28/21484,9007892,129,6313,026704,847890392,3384682,35537
6/29/21485,0751752,130,090459704,93891392,372342,338-17
7/1/21484,86802,128,8900704,2430391,84702,304-34
7/2/21485,1482802,130,0491,159704,468225391,9771302,302-2
7/3/21485,4042562,130,959911704,658189392,053762,3020
7/4/21485,6602562,131,870911704,847189392,129762,3020
7/5/21485,9162562,132,781911705,036189392,205762,3020
7/6/21486,1722562,133,692911705,225189392,281762,3042
7/7/21486,3711992,134,547855705,414189392,368872,3062

An examination of cases broken down by age group reveals that the 18-49 age group continues to have the highest rate of infection. There was a marked increase in new daily cases in this age group from June 15 to June 18, with moderate increases for the other three age groups. 

Despite the availability of vaccines for children 12 and up, in California, we have not seen a marked decrease in the number of new cases in children over the past two weeks. From June 19 to July 2, the 0-17 age group averaged 276 new infections per day, a 69% increase compared to the previous 14-day period. (The daily average for June 4-18 was 163.) As of June 30, the California Department of Public Health reports 4 COVID-19 deaths in children under the age of 5 and 19 deaths in children ages 5-17. To date, 486,371 children in California have been infected with COVID-19. The US Census Bureau estimates that there are 8,890,250 children in California, so approximately 5.4% of children have had a documented case of COVID-19.

Watching World Data

Over the next few months, we’ll be paying close attention to correlations between the SARS-CoV-2 data, the number of isolates identified in various countries and states, and the non-pharmaceutical interventions (like mask mandates and lockdowns) put in place by state and national governments. Data on infections, deaths, and percent of population infected was compiled from Worldometers. Data for this table for SARS-CoV-2 Isolates Currently Known in Location was compiled from GISAID and the CDC. It’s worth noting that GISAID provided more data than the CDC.

LocationTotal Infections as of 7/02/21New Infections on 7/02/21Total DeathsNew Deaths on 7/02/21% of Pop.InfectedSARS-CoV-2 Isolates Currently Known in LocationNational/ State Mask Mandate?Currently in Lockdown?
World183,836,958(5,248,302 new infections in 14 days)437,5483,979,868(113,224 new deaths in 14 days)8,4952.35%B2 lineageAlpha/B.1.1.7 (UK)Eta/B.1.525 (Nigeria/UK)Iota/B.1.526 (USA-NYC)Beta/B.1.351 (SA)Epsilon/B.1.427 + B.1.429 (USA)*Gamma/P.1 (Brazil)Zeta/P.2 (Brazil)A lineage isolateV01.V2 (Tanzania)APTK India VOC 32421Delta/B.1.617.2 (India)BV-1 (Texas, USA)Kappa/B.1.617.1 (India)Lambda/C.37 (Peru)Theta/P.3 (Philippines) NoNo
USA34,580,198
(ranked #1)
18,399
621,161
(ranked #1)
32210.38%B2 lineageAlpha/B.1.1.7 (UK)Eta/B.1.525 (Nigeria/UK)Iota/B.1.526 (USA-NYC)Beta/B.1.351 (SA)Epsilon/B.1.427 + B.1.429 (USA)*Gamma/P.1 (Brazil)Zeta/P.2 (Brazil)Delta/B.1.617.2 (India)BV-1 (Texas, USA)Theta/P.3 (Philippines) Theta/P.3 (Philippines) Kappa/B.1.617.1 (India)Lambda/C.37 (Peru)NoNo
Brazil18,687,469(ranked #3)   65,165(ranked #1) 522,068(ranked #2)1,8798.72%B2 lineageAlpha/B.1.1.7 (UK)Beta/B.1.351 (SA)Gamma/P.1 (Brazil)Zeta/P.2 (Brazil)Lambda/C.37 (Peru)NoNo
India30,501,189(ranked #2)47,252(ranked #2)401,068(ranked #3)7872.18%B2 lineageAlpha/B.1.1.7 (UK)Beta/B.1.351 (SA)Epsilon/B.1.427 + B.1.429 (USA)*Eta/B.1.525 (Nigeria/UK)APTK India VOC 32421Delta/B.1.617.2 (India)Kappa/B.1.617.1 (India)NoNo
United Kingdom4,855,169(ranked #7)27,125128,189277.11%B2 lineageAlpha/B.1.1.7 (UK)Eta/B.1.525 (Nigeria/UK)Beta/B.1.351 (SA)Epsilon/B.1.427 + B.1.429 (USA)*Gamma/P.1 (Brazil)Delta/B.1.617.2 (India)Theta/P.3 (Philippines) Kappa/B.1.617.1 (India)Lambda/C.37 (Peru)NoNo
California, USA3,700,750(ranked #13 in world)1,29562,622579.66%B2 lineageAlpha/B.1.1.7 (UK)Eta/B.1.525 (Nigeria/UK)Beta/B.1.351 (SA)Gamma/P.1 (Brazil)Epsilon/B.1.427 + B.1.429 (USA)*Zeta/P.2 (Brazil)Delta/B.1.617.2 (India)Theta/P.3 (Philippines) Kappa/B.1.617.1 (India)Lambda/C.37 (Peru) NoNo
Mexico2,525,350(ranked #15)6,081233,248(ranked #4)2011.93%B2 lineageAlpha/B.1.1.7 (UK)Epsilon/B.1.427 + B.1.429 (USA)*Gamma/P.1 (Brazil)Delta/B.1.617.2 (India)Kappa/B.1.617.1 (India)Lambda/C.37 (Peru)NoNo
South Africa2,019,826(ranked #19)24,270621,3223033.36%B2 lineageAlpha/B.1.1.7 (UK)Beta/B.1.351 (SA)Delta/B.1.617.2 (India)Kappa/B.1.617.1 (India)NoNo
Canada1,416,317(ranked #24)1,00726,338433.72%B2 lineageAlpha/B.1.1.7 (UK)Eta/B.1.525 (Nigeria/UK)Epsilon/B.1.427 + B.1.429 (USA)*Gamma/P.1 (Brazil)Delta/B.1.617.2 (India)Kappa/B.1.617.1 (India)Lambda/C.37 (Peru)Yes, except Alberta ProvinceNo
Poland2,880,4107(ranked #14)9675,065217.61%B2 lineageAlpha/B.1.1.7 (UK)Eta/B.1.525 (Nigeria/UK)Beta/B.1.351 (SA)Delta/B.1.617.2 (India)NoNo
Turkey5,435,831(ranked #6)4,89149,829276.37%B2 lineageAlpha/B.1.1.7 (UK)Eta/B.1.525 (Nigeria/UK)Beta/B.1.351 (SA)Epsilon/B.1.427 + B.1.429 (USA)*Gamma/P.1 (Brazil)Lambda/C.37 (Peru)NoNo
Russia5,561,360(ranked #5)23,218                                                  136,5656793.80%B2 lineageAlpha/B.1.1.7 (UK)Beta/B.1.351 (SA)Delta/B.1.617.2 (India)NoNo
Argentina4,512,439(ranked #8)20,88895.3826109.69%B2 lineageAlpha/B.1.1.7 (UK)Eta/B.1.525 (Nigeria/UK)Beta/B.1.351 (SA)Epsilon/B.1.427 + B.1.429 (USA)*Gama/P.1 (Brazil)Delta/B.1.617.2 (India)Lambda/C.37 (Peru)NoNo
Colombia4,512,302(ranked #9)28,005107,72355868.35%B2 lineageAlpha/B.1.1.7 (UK)Beta/B.1.351 (SA)Gamma/P.1 (Brazil)Epsilon/B.1.427 + B.1.429 (USA)*Iota/B.1.526 (USA-NYC)Lambda/C.37 (Peru)NoNo
Peru2,060,344(ranked #18)2,790192,902(ranked #5)2156.16%B2 lineageAlpha/B.1.1.7 (UK)Gamma/P.1 (Brazil)Iota/B.1.526 (USA-NYC)Lambda/C.37 (Peru)NoNo
Indonesia2,228,938(ranked #17)25,83059,53453910.8%B2 lineageAlpha/B.1.1.7 (UK)Delta/B.1.617.2 (India)Beta/B.1.351 (SA)Eta/B.1.525 (Nigeria/UK)Theta/P.3 (Philippines) Iota/B.1.526 (USA-NYC)Kappa/B.1.617.1 (India)NoNo
*Also referred to as CAL.20C


SARS-CoV-2, Children, and MIS-C/PIMS

I’m pleased to see that COVID-19 cases and MIS-C (PIMS) cases in children in the US are finally getting national attention. The CDC now tracks total MIS-C cases and deaths in children and young adults up to 20 years old in the United States. As of June 28, CDC reported 4,196 cases of MIS-C that meet the case definition and 37 deaths—that’s 178 new cases and one new death since the June 2 report. The CDC notes, “As of October 1, the number of cases meeting the case definition for multisystem inflammatory syndrome in children (MIS-C) in the United States surpassed 1,000. As of February 1, this number surpassed 2,000, and exceeded 3,000 as of April 1.” This means it took seven months to reach 1,000 MIS-C cases, only four months to reach an additional 1,000 cases, and only two months to add an additional 1,185 cases. This suggests to us that variants are causing more MIS-C. 

Date of ReportingTotal MIS-C PatientsChange Since Last ReportTotal MIS-C DeathsChange Since Last Report
6/28/20214196+17837+1
6/2/20214018+27636+1
5/3/20213742+55735-1
3/29/20213185+56836+3
3/1/2021261733

Schools in the United States have been open throughout the pandemic, with teachers and education support professionals demonstrating their extraordinary ability to adapt in adverse circumstances. Teachers all over the country reinvented their teaching, taking their classrooms online in order to provide safe and remote learning experiences for students. The so-called “reopening” of schools, which more accurately refers to the opening of school buildings, as schools never closed, has been highly politicized, with many governors issuing mandates for in-person instruction, even as case counts, hospitalizations, and deaths in their states rose exponentially. The CDC has maintained that transmission risk in schools is minimal, provided that adequate safety measures are taken; however, we know that many states have not properly enforced universal masking (and some are repealing mask mandates this week), and we know that many school facilities are not equipped with the proper air handling systems. With more school buildings opening, there is a growing body of research that suggests that COVID-19 transmission can and does happen in schools. 

After recommending for months that school buildings be open, in mid-February (a year into the pandemic), The American Academy of Pediatrics, in collaboration with the Children’s Hospital Association, finally began tracking data on COVID-19 in children at the state and national level. Data reporting by states is still voluntary, and every state is different in its willingness to collect and disclose data on infections, hospitalizations, deaths, and testing rates in children. 

As of the APA’s July 1 report, only 11 states provide age distribution for testing. This makes it difficult to hold states accountable for testing each age group in proportion to its population. We’ve seen a trend in states where testing data with age distribution is available that children are tested at lower rates than adults. Hospitalization data by age group is only available in 24 states and New York City, so we only understand the severity of COVID-19 infections in children for about half the country. Age distribution for cases is provided by 49 states, New York City, the District of Columbia, Puerto Rico, and Guam. Age distribution for deaths is provided in 43 states, New York City, Puerto Rico, and Guam. It’s worth noting that New York State does not provide age data for cases, testing, hospitalizations, and deaths. Two states, Florida and Utah, only report cases in children aged 0-14, so the number of cases, hospitalizations, and deaths in children ages 15-17 is unknown in these states. 

As of July 1, children represented 14.2% of all COVID-19 cases reported to APA. A total of 335 child deaths due to COVID-19 were reported in 43 states. The following states do not report child mortality due to COVID-19: Michigan, Montana, New Mexico, New York, Rhode Island, South Carolina, and West Virginia. 

If we truly want to keep children safe, especially as many school buildings open for in-person instruction, we need to collect more complete data in every state on child testing rates, cases, hospitalizations, and deaths.

Vaccinating America’s Children

The New York Times reports that nationally, 55.6% of people 12 and up are fully vaccinated, while 58.4% of people 18 and up are fully vaccinated, according to the CDC. Only 47.5% of the total population is fully vaccinated. 

Some states are falling far behind when it comes to getting children—and the general population—fully vaccinated. Alabama and Mississippi have only fully vaccinated 33% of their population. Vermont, Maine, Massachusetts, and Connecticut have fully vaccinated more than 60% of their population, with Vermont having the highest vaccination rate at 74%. California has fully vaccinated 51% of their population. 

The Road Ahead

President Biden has made the pandemic a first priority and has now ordered enough vaccines to vaccinate everyone who wants a vaccination by the end of this month. As of 7/7/21, the CDC reports that 182.8 million people (approximately 55.1% of the population) have had one dose of any vaccine. 157.9 million people (47.6% of the population) are fully vaccinated. The rate of people who are fully vaccinated has increased by less than 3% in the past two weeks. 

As of May 10, all people in the U.S. over the age of 12 are eligible to receive a vaccine. The Biden administration has already exceeded its goal of administering 200 million doses of vaccine in the first 100 days of the administration. The Pfizer-BioNtech is already approved for ages 12-15 and the Moderna vaccine should be approved in June 2021. Moderna has applied for emergency use authorization to administer their mRNA vaccines to children aged 12-15. Testing is ongoing for children in younger age groups and may be approved for ages 2-11 by the end of September 2021. 

Testing, wearing masks, social distancing and washing our hands frequently should no longer be political issues. These are non-pharmaceutical interventions used by most successful countries and some states to protect their citizens and their economies. New Zealand, Taiwan, and Australia are three countries that have done this successfully. In the United States, Hawaii is doing a better job handling the pandemic than many of our states. These interventions and vaccination should keep the pandemic from overwhelming our health care delivery systems world-wide. New mutations like Epsilon/B.1.427 + B.1.429 and the Alpha, Beta, Gamma, and Delta variants will probably spread rapidly throughout the United States over the next 90 days as many states (ex. Texas, Florida, Iowa, Mississippi, Wyoming and South Carolina) open up everything and do away with masking and social distancing. We will probably see increased new infections per day in the United States. In the UK, Alpha/B.1.1.7, has increased the number of infections, hospitalizations and deaths. This and other mutants may do the same thing in the USA.

The Pfizer and Moderna RNA vaccines and the Johnson & Johnson single dose vaccination adenovirus vaccine are all being used to immunize people in the USA. The Oxford-AstraZeneca vaccine and the Novavax vaccine may be available in the fourth quarter of 2021. 

The bad news is that all currently available vaccines are based on the spike protein sequence identified in China in December 2019. Mutated isolates, as discussed above, may overtake our ability to produce new vaccines and vaccinate the populace. Like Influenza vaccines, we may have to reformulate vaccines based on active, worldwide surveillance at least every 4 to 6 months. The FDA is currently putting together a guidance document for how to develop booster vaccines for SARS-CoV-2 mutations. A surrogate marker of protection like antibody to the mutated Receptor Binding Domains of SARS-CoV-2 should be considered for vaccine approval. 

The ideal approach to addressing the major mutations on at least five continents would be to make vaccines against each of the mutations. I’d get all of the vaccine companies and contract production companies on a call and “suggest” that two companies at least make and mass produce one of the four mutations. The government would pay the cost and buy at least 200 million doses in advance for each variant at say $40 a dose. The total cost to purchase the vaccine (800 million doses) would only be 32 billion dollars. Give each company a billion dollars each for development costs (another 8 billion dollars). Spend another two billion dollars for syringes and you’ve got enough booster doses to vaccinate 200 million people for all 4 variants. 42 billion dollars would be a small price to pay to catch up with the current mutations. Even if you had to do this every two years, it would be well worth the dollars spent. 

We are not doing adequate numbers of PCR or antigen detection assays in the United States. According to JHU, in January of 2021, we were doing up to 2,307,949 tests per day. In March 2021, the highest number of tests per day was 1,709,210, and in April, the highest number of tests per day was 2,008,319. Currently, we’re doing 444,718 tests per day (7-day moving average); that’s 1,563,601 fewer tests per day than the April high. 

We still need to perform more virus isolations and perform more DNA sequencing of viruses in each country, state, populous city, and county if we are to rapidly identify new mutations. In December 2020, WHO asked countries to increase their sequencing rates, and the European Commission asked member states to set a goal of 10%. The CDC then set a goal of 5% for the United States. At the end of June 2021, the United States had a SARS-CoV-2 genome sequencing rate of 1.69%, whereas the United Kingdom had a genome sequencing rate of 10.2%. I’m more hopeful that we will have the facilities, the equipment, and the trained staff needed to perform this work. As a nation we still need to make and distribute more vaccines to other countries, new vaccines directed against mutants, and the necessary rapid tests and protective equipment needed by medical staff, first responders, essential workers and especially teachers and students. I’m still hopeful we can work together on our and the world’s infectious disease problems. 

What Our Team Is Reading This Week

COVID-19

SARS-CoV-2 Update

It’s time for our next 14-day moving average determinations for SARS-CoV-2 for the United States and my thoughts on vaccines and mutant viruses. We use the WORLDOMETERS aggregators data set to make any projections since it includes data from the Department of Veterans Affairs, the U.S. Military, federal prisons and the Navajo Nation.

In the United States, SARS-CoV-2 deaths have decreased for the eighth time in a 14-day period. There were 137 fewer deaths per day than in the last 14-day period. In the last 14 days, the number of infections has decreased by 12,293 infections per day.  Our infections per day are still high, probably secondary to SARS-CoV-2 mutants, to include the Alpha/B.1.1.7 isolate, the Iota/B.1.526 isolate, the Epsilon/B.1.427 + B.1.429 isolate, the Beta/B.1.351 isolate, the Gamma/P.1 and Zeta/P.2 isolates, and the new isolate, Deta/B.1.617+. I would predict that the opening of schools, places of worship, bars, restaurants, indoor dining and travel all will contribute to further spread of multiple SARS-CoV-2 mutants and rising numbers  in infections, hospitalizations and deaths in the coming months. Increased traveling as well as summer vacations, and the July 4 holiday will all cause further increases. Vaccinations, increased mask usage and social distancing, which are a part of the Biden SARS-CoV-2 plan (day 136 of plan) will be necessary to stop spread of mutants and cause  further reductions in infections, hospitalizations and deaths in the future. On 6/04/21, 16,925 new infections occurred in the United States. There were also 520 deaths. The number of hospitalized patients is decreasing, but 5,631 patients are still seriously or critically ill. The number of critically ill patients has decreased by 1,761 in the last 14 days, while 6,577 new deaths occurred. The number of critically ill patients is decreasing for the fourth 14-day period, but a large number of patients are still dying each day. 

As of 6/04/21, we have had 612,249 deaths and 34,192,023 SARS-CoV-2 infections in the United States. We have had 271,267 new infections in the last 14 days. We are adding an average of 135,633 infections every 7 days. Each million infections usually results in 10,000 to 20,000 deaths. On 6/04/21, twenty-two states have had greater than 500,000 total infections, and 33 states have had greater than 5,000 total deaths. Nine states (Michigan, Georgia, Illinois, New Jersey, Pennsylvania, Florida, Texas, New York and California) have had greater than 20,000 deaths. Four states (Florida, Texas, New York and California) have had greater than 35,000 deaths.

For comparison, on 11/20/20 in the United States, 3.70% of the population had a documented SARS-CoV-2 infection. California was ranked 41st in infection percentage at 2.77%. In North Dakota 9.18% of the population was infected (ranked #1), and in South Dakota 8.03% of the population was infected (ranked #2).

As of 6/04/21, in the United States, 10.32% of the population has had a documented SARS-CoV-2 infection. In the last 6 months, over 6% of our country became infected with SARS-CoV-2. 

As of 6/04/21, California was still ranked 36th in infection percentage at 9.60%. In North Dakota 14.45% of the population was infected (ranked #1), while Rhode Island was at 14.34% (ranked #2) and South Dakota was at 14.04% of the population infected (ranked #3). Thirty-one states have greater than 10% of their population infected and 42 states have greater than 9% of their population infected. Only one state has less than 3% of their population infected: Hawaii (2.52%).

New Mutants

In a response for the need for “easy-to-pronounce and non-stigmatising labels,” at the end of May, the World Health Organization assigned a letter from the Greek alphabet to each SARS-CoV-2 variant. GISAID, Nextstrain, and Pango will continue to use the previously established nomenclature. For our purposes, we’ll be referring to each variant by both its Greek alphabet letter and the Pango nomenclature. 

The WHO has sorted variants into two categories: Variants of Concern (VOC) and Variants of Interest (VOI). The criteria for Variants of Concern are as follows:

  • Increase in transmissibility or detrimental change in COVID-19 epidemiology; or 
  • Increase in virulence or change in clinical disease presentation; or 
  • Decrease in effectiveness of public health and social measures or available diagnostics, vaccines, therapeutics.  

The WHO categorizes the following four variants as Variants of Concern (VOC):

The criteria for Variants of Interest (VOI) are as follows:

  • has been identified to cause community transmission/multiple COVID-19 cases/clusters, or has been detected in multiple countries; OR  
  • is otherwise assessed to be a VOI by WHO in consultation with the WHO SARS-CoV-2 Virus Evolution Working Group. 

The WHO categorizes the following six variants as Variants of Interest (VOI):

A new mutant SARS-CoV-2 virus (lineage B.1.1.7, now referred to by WHO as Alpha), first seen in the UK in September 2020, has now been found in multiple other countries. This isolate has now been found in 50 states and the District of Columbia. This isolate is more infectious than other previously circulating B2 lineage isolates. There are two deletions and six other mutations in its spike protein. One mutation involves a change of one amino acid, an asparagine at position 501 in the receptor binding motif with a tyrosine. This enhances binding (affinity) to the ACE-2 receptor and may alone be responsible for the increased infectivity of this isolate. A study published March 10 in the British Medical Journal (BMJ) found that the risk of death increased by 64% in patients infected with the B.1.1.7 variant compared to all other isolates. Due to air and other travel, this isolate will become the dominant isolate worldwide. 

On 4/10/21, the CDC stopped providing data to the public on the number of reported cases of all variants of SARS-CoV-2, both nationally and by state. This data used to be available at https://www.cdc.gov/coronavirus/2019-ncov/transmission/variant-cases.html. The CDC claims that the data is available in its COVID-19 Data Tracker, but only percentages, not actual case numbers, are available, and the data ends on May 8, 2021.   

Luckily, GISAID is still reporting variant data. The United States has had more isolations of the Alpha variant (B.1.1.7) in the last four weeks (9,795) than any other country in the world, to include the United Kingdom. There have been a total of 160,842 cases of Alpha/B.1.1.7 identified in the US to date. (See chart below.)

At 1,842 cases, the United States has the fourth highest number of isolations of the Beta variant (B.1.351, first identified in South Africa), and 76 of these were in the last four weeks. 

And the United States has now surpassed Brazil for the most isolations of the Gamma variant (P.1) in the world, with 12,887 overall and 1,527 in the past four weeks. 

As for the Delta Variant (B.1.617+), the variant recently identified in India, only India and the United Kingdom have more isolated cases than in the United States, which has 1,888 total cases, 546 of which were identified in the last four weeks. 

The United States has also surpassed both the UK and Nigeria for the most isolations of the Eta varian (B.1.525) in the world, with 1,064 overall and 32 in the past four weeks. 

A disturbing report out of the UK has found a second mutation in Alpha/B.1.1.7. This mutation, which occurs in the loop sequence, has also been found in the Beta/B.1.351 and Gamma/P.1 variants. (The loop sequence is in the receptor binding motif in the receptor binding domain of the S1 sequence of the spike protein.) This mutation involves a change of one amino acid of the spike protein, number 484, from glutamic acid to lysine. This point mutation allows the virus to bind better to the ACE2 receptor, which increases infectivity. People who are exposed to one of these variants (versus the old B2 isolate) are more likely to be infected and are more likely to transmit the virus to others. 

In our last three updates we summarized a research letter published in Clinical Infectious Diseases about a patient in the UK who was first infected in April with a B2 isolate and experienced only mild symptoms but was infected with the new Alpha/B.1.1.7 variant in December and became critically ill. The patient described in this research letter was not protected by a natural infection with a B2 lineage SARS-CoV-2 isolate in April 2020 from having a potentially lethal second infection with a B.1.1.7 lineage variant in December 2020, suggesting that folks who have had a past SARS-CoV-2 infection should not expect to have any immunity to new variants such as Alpha/B.1.1.7. All of the currently available vaccines were developed with spike protein from B2 lineages. Moderna, Pfizer, and AstraZeneca/Oxford are currently remaking their spike protein vaccines to address the mutations in the South African variant of SARS-CoV-2 because the AstraZeneca/Oxford vaccine did not work in a small trial in South Africa, where most of the patients had the Beta/B.1.351 mutant. 

New Mutant Delta/B.1.617+ Arrives in California

Stanford University announced five weeks ago that they have identified five infections with the Delta/B.1.617+ variant in the San Francisco Bay Area. There are actually three different B.1.617 variants: B.1.617.1, B.1.617.2 and B.1.617.3. The most common variant appears to be B.1.617.2. This isolate is a double-mutant responsible for greater than 50% of the infections in India. The data from India the last 14 days ending on 6/04/21 is still disturbing. India has had 2,541,685 infections in the last 14 days or an average of 181,549 infections per day. During this 14-day period India reported 59,354 deaths or 4,240 deaths per day. On May 21, 2021, India reported 121,476 new infections and 3,382 new deaths. On 6/04/21 the total deaths due to SARS-CoV-2 infections in India stood at 344,101. India, with a population of 1,390,456,911, has had only 2.06% of the country infected. Their hospitals are still running out of vaccines, oxygen, medications, beds and ventilators. Sadly a health disaster continues in the world’s most populous country. I would predict that prior SARS-CoV-2 infection in India or first generation SARS-CoV-2 vaccines will have a decreased effect on this mutant discussed in the next paragraph. 

Many of you may now be familiar with the E484K mutation present in the Beta/B.1.351 isolate, the Gamma/P.1 isolate, the Iota/B.1.526 isolate, and the double mutant Eta/B.1.525. When vaccine manufacturers make booster vaccines to address these variants, they will only account for the E484K mutation. What sets this Delta/B.1.617+ variant apart from the other variants is that it has a different point mutation at amino acid 484 that involves a change of one amino acid of the spike protein, number 484, from glutamic acid to glutamine (E484Q). This point mutation, like E484K, probably allows the virus to bind to the ACE2 receptor and evade neutralizing antibodies directed against the original Wuhan sequence. A vaccine created to address E484K would not address this isolate. 

The second mutation in Delta/B.1.617+ is L452R, which is one of the same mutations seen in Epsilon/B.1.427 + B.1.429. This mutation is also not being covered by any vaccine currently being made as a booster. It’s possible that people in California who were infected by the Epsilon mutant in the last six months might have some additional cross protective antibodies to Delta/B.1.617+.

Watching the Data

Over the next few months, we’ll be paying close attention to correlations between the SARS-CoV-2 data, the number of isolates identified in various countries and states, and the non-pharmaceutical interventions (like mask mandates and lockdowns) put in place by state and national governments. Data on infections, deaths, and percent of population infected was compiled from Worldometers. Data for this table for SARS-CoV-2 Isolates Currently Known in Location was compiled from GISAID and the CDC. It’s worth noting that GISAID provided more data than the CDC, whose most recent data on variants is from May 8. 

LocationTotal Infections as of 6/04/21New Infections on 6/04/21Total DeathsNew Deaths on 5/21/21% of Pop.InfectedSARS-CoV-2 Isolates Currently Known in LocationNational/ State Mask Mandate?Currently in Lockdown?
World173,713,909400,0753,736,0999,2832.22%B2 lineageAlpha/B.1.1.7 (UK)Eta/B.1.525 (Nigeria/UK)Iota/B.1.526 (USA-NYC)Beta/B.1.351 (SA)Epsilon/B.1.427 + B.1.429 (USA)*Gamma/P.1 (Brazil)Zeta/P.2 (Brazil)A lineage isolateV01.V2 (Tanzania)APTK India VOC 32421Delta/B.1.617+ (India)BV-1 (Texas, USA)NoNo
USA34,192,023
(ranked #1)
16,925
612,240
(ranked #1)
52010.32%B2 lineageAlpha/B.1.1.7 (UK)Eta/B.1.525 (Nigeria/UK)Iota/B.1.526 (USA-NYC)Beta/B.1.351 (SA)Epsilon/B.1.427 + B.1.429 (USA)*Gamma/P.1 (Brazil)Zeta/P.2 (Brazil)Delta/B.1.617+ (India)BV-1 (Texas, USA)NoNo
Brazil16,841,954(ranked #3)   38,482(ranked #2) 470,968(ranked #2)1,1847.87%B2 lineageAlpha/B.1.1.7 (UK)Beta/B.1.351 (SA)Gamma/P.1 (Brazil)Zeta/P.2 (Brazil)NoNo
India28,693,835(ranked #2)121,476(ranked #1)344,101(ranked #3)3,3822.06%B2 lineageAlpha/B.1.1.7 (UK)Beta/B.1.351 (SA)Epsilon/B.1.427 + B.1.429 (USA)*Eta/B.1.525 (Nigeria/UK)APTK India VOC 32421Delta/B.1.617+ (India)NoNo
United Kingdom4,506,016(ranked #7)6,238127,823116.60%B2 lineageAlpha/B.1.1.7 (UK)Eta/B.1.525 (Nigeria/UK)Beta/B.1.351 (SA)Epsilon/B.1.427 + B.1.429 (USA)*Gamma/P.1 (Brazil)Delta/B.1.617+ (India)NoNo
California, USA3,794,271(ranked #10 in world)1,12963,395529..60%B2 lineageAlpha/B.1.1.7 (UK)Beta/B.1.351 (SA)Epsilon/B.1.427 + B.1.429 (USA)*Zeta/P.2 (Brazil)Delta/B.1.617+ (India)NoNo
Mexico2,426,822(ranked #15)2,894228,362(ranked #4)2161.86%B2 lineageAlpha/B.1.1.7 (UK)Epsilon/B.1.427 + B.1.429 (USA)*Gamma/P.1 (Brazil)Delta/B.1.617+ (India)NoNo
South Africa1,686,041(ranked #19)5,66856,832672.81%B2 lineageAlpha/B.1.1.7 (UK)Beta/B.1.351 (SA)Delta/B.1.617+ (India)NoNo
Canada1,389,508(ranked #23)2,06325,679353.65%B2 lineageAlpha/B.1.1.7 (UK)Eta/B.1.525 (Nigeria/UK)Epsilon/B.1.427 + B.1.429 (USA)*Gamma/P.1 (Brazil)Delta/B.1.617+ (India)Yes, except Alberta ProvinceNo
Poland2,874,409(ranked #14)31774,101267.60%B2 lineageAlpha/B.1.1.7 (UK)Eta/B.1.525 (Nigeria/UK)Beta/B.1.351 (SA)Delta/B.1.617+ (India)NoNo
Turkey5,276,,468(ranked #5)6,16947,976946.19%B2 lineageAlpha/B.1.1.7 (UK)Eta/B.1.525 (Nigeria/UK)Beta/B.1.351 (SA)Epsilon/B.1.427 + B.1.429 (USA)*Gamma/P.1 (Brazil)NoNo
Russia5,108,129(ranked #6)8,947                                                   123,0373773.49%B2 lineageAlpha/B.1.1.7 (UK)Beta/B.1.351 (SA)Delta/B.1.617+ (India)NoNo
Argentina3,915,397(ranked #9)30,95080,4115388.59%B2 lineageAlpha/B.1.1.7 (UK)Eta/B.1.525 (Nigeria/UK)Beta/B.1.351 (SA)Epsilon/B.1.427 + B.1.429 (USA)*Gama/P.1 (Brazil)Delta/B.1.617+ (India)NoNo

*Also referred to as CAL.20C

SARS-CoV-2, Children, and MIS-C/PIMS

I’m pleased to see that COVID-19 cases and MIS-C (PIMS) cases in children in the US are finally getting national attention. The CDC now tracks total MIS-C cases and deaths in children and young adults up to 20 years old in the United States. As of June 2, CDC reported 4,018 cases of MIS-C that meet the case definition and 36 deaths—that’s 276 new cases and one new death since the May 3 report. The CDC notes, “As of October 1, the number of cases meeting the case definition for multisystem inflammatory syndrome in children (MIS-C) in the United States surpassed 1,000. As of February 1, this number surpassed 2,000, and exceeded 3,000 as of April 1.” This means it took seven months to reach 1,000 MIS-C cases, only four months to reach an additional 1,000 cases, and only two months to add an additional 1,185 cases. This suggests to us that Alpha/B.1.1.7 is causing more MIS-C. 

Date of ReportingTotal MIS-C PatientsChange Since Last ReportTotal MIS-C DeathsChange Since Last Report
6/2/20214018+27636+1
5/3/20213742+55735-1
3/29/20213185+56836+3
3/1/2021261733

Schools in the United States have been open throughout the pandemic, with teachers and education support professionals demonstrating their extraordinary ability to adapt in adverse circumstances. Teachers all over the country reinvented their teaching, taking their classrooms online in order to provide safe and remote learning experiences for students. The so-called “reopening” of schools, which more accurately refers to the opening of school buildings, as schools never closed, has been highly politicized, with many governors issuing mandates for in-person instruction, even as case counts, hospitalizations, and deaths in their states rose exponentially. The CDC has maintained that transmission risk in schools is minimal, provided that adequate safety measures are taken; however, we know that many states have not properly enforced universal masking (and some are repealing mask mandates this week), and we know that many school facilities are not equipped with the proper air handling systems. With more school buildings opening, there is a growing body of research that suggests that COVID-19 transmission can and does happen in schools. 

After recommending for months that school buildings be open, in mid-February (a year into the pandemic), The American Academy of Pediatrics, in collaboration with the Children’s Hospital Association, finally began tracking data on COVID-19 in children at the state and national level. Data reporting by states is still voluntary, and every state is different in its willingness to collect and disclose data on infections, hospitalizations, deaths, and testing rates in children. 

As of the APA’s May 27 report, only 11 states provide age distribution for testing. This makes it difficult to hold states accountable for testing each age group in proportion to its population. We’ve seen a trend in states where testing data with age distribution is available that children are tested at lower rates than adults. Hospitalization data by age group is only available in 24 states and New York City, so we only understand the severity of COVID-19 infections in children for about half the country. Age distribution for cases is provided by 49 states, New York City, the District of Columbia, Puerto Rico, and Guam. Age distribution for deaths is provided in 43 states, New York City, Puerto Rico, and Guam. It’s worth noting that New York State does not provide age data for cases, testing, hospitalizations, and deaths. Two states, Florida and Utah, only report cases in children aged 0-14, so the number of cases, hospitalizations, and deaths in children ages 15-17 is unknown in these states. 

As of May 27, A total of 322 child deaths due to COVID-19 were reported in 43 states (an increase of 6 child deaths in one week). In the United States, The following states do not report child mortality due to COVID-19: Michigan, Montana, New Mexico, New York, Rhode Island, South Carolina, and West Virginia. Texas only reports age data for 3% of confirmed COVID-19 cases, so state-level data from Texas is extremely limited for assessing the incidence of COVID-19 in children. Even considering this, Texas reported 52 child deaths. Arizona reported 33, California 23, Colorado 15 (+2), Florida 7, Georgia 10, Illinois 18, Maryland 10, Tennessee 10, Massachusetts 8 (+1), Pennsylvania 11, and New York City 24. 

If we truly want to keep children safe, especially as many school buildings open for in-person instruction, we need to collect more complete data in every state on child testing rates, cases, hospitalizations, and deaths.

The New York Times reports that nationally, children 12 and up have higher vaccination rates than the general population, with 50% of children 12 and up vaccinated, and 53% of children 18 and up fully vaccinated, according to the CDC.

However, some states are falling far behind when it comes to getting children—and the general population—fully vaccinated. Idaho, Alabama, Mississippi, and Louisiana have given at least one shot to less than 10% of children 12-17 years old. Massachusetts, Hawaii, and Vermont are the only three states that have given at least one shot to at least 50% of children 12-15. California has given at least one shot to 36% of children 12-17 years old. 

The Road Ahead

We are on Day 122 of the Biden-Harris administration.The President has made the pandemic a first priority and has now ordered enough vaccines to vaccinate everyone who wants a vaccination by July 2021. As of 6/5/21, 170.8 million people (approximately 51.5% of the population) have had one dose of any vaccine. 138.9 million people (41.9% of the population) are fully vaccinated. 

As of May 10, all people in the U.S. over the age of 12 are eligible to receive a vaccine. The Biden administration has already exceeded its goal of administering 200 million doses of vaccine in the first 100 days of the administration. The Pfizer-BioNtech is already approved for ages 12-15 and the Moderna vaccine should be approved in June 2021. Moderna has applied for emergency use authorization to administer their mRNA vaccines to children aged 12-15. Testing is ongoing for children in younger age groups and may be approved for ages 2-11 by the end of September 2021. 

Testing, wearing masks, social distancing and washing our hands frequently should no longer be political issues. These are non-pharmaceutical interventions used by most successful countries and some states to protect their citizens and their economies. New Zealand, Taiwan, and Australia are three countries that have done this successfully. In the United States, Hawaii is doing a better job handling the pandemic than many of our states. These interventions and vaccination should keep the pandemic from overwhelming our health care delivery systems world-wide. New mutations like Epsilon/B.1.427 + B.1.429 and the Alpha, Beta, Gamma, and Delta variants will probably spread rapidly throughout the United States over the next 90 days as many states (ex. Texas, Florida, Iowa, Mississippi, Wyoming and South Carolina) open up everything and do away with masking and social distancing. We will probably see increased new infections per day in the United States. In the UK, Alpha/B.1.1.7, has increased the number of infections, hospitalizations and deaths. This and other mutants may do the same thing in the USA.

The Pfizer and Moderna RNA vaccines and the Johnson & Johnson single dose vaccination adenovirus vaccine are all being used to immunize people in the USA. The Oxford-AstraZeneca vaccine and the Novavax vaccine may be available in the fourth quarter of 2021. 

The bad news is that all currently available vaccines are based on the spike protein sequence identified in China in December 2019. Mutated isolates, as discussed above, may overtake our ability to produce new vaccines and vaccinate the populace. Like Influenza vaccines, we may have to reformulate vaccines based on active, worldwide surveillance at least every 4 to 6 months. The FDA is currently putting together a guidance document for how to develop booster vaccines for SARS-CoV-2 mutations. A surrogate marker of protection like antibody to the mutated Receptor Binding Domains of SARS-CoV-2 should be considered for vaccine approval. 

The ideal approach to addressing the major mutations on at least five continents would be to make vaccines against each of the mutations. I’d get all of the vaccine companies and contract production companies on a call and “suggest” that two companies at least make and mass produce one of the four mutations. The government would pay the cost and buy at least 200 million doses in advance for each variant at say $40 a dose. The total cost to purchase the vaccine (800 million doses) would only be 32 billion dollars. Give each company a billion dollars each for development costs (another 8 billion dollars). Spend another two billion dollars for syringes and you’ve got enough booster doses to vaccinate 200 million people for all 4 variants. 42 billion dollars would be a small price to pay to catch up with the current mutations. Even if you had to do this every two years, it would be well worth the dollars spent. 

We are not doing adequate numbers of PCR or antigen detection assays in the United States. According to JHU, in January of 2021, we were doing up to 2,307,949 tests per day. In March 2021, the highest number of tests per day was 1,709,210, and in April, the highest number of tests per day was 2,008,319. Currently, we’re doing 710,675 tests per day (7-day moving average); that’s 1,297,644 fewer tests per day than the April high. 

We still need to perform more virus isolations and perform more DNA sequencing of viruses in each country, state, populous city, and county if we are to rapidly identify new mutations. I’m more hopeful that we will have the facilities, the equipment, and the trained staff needed to perform this work. As a nation we still need to make and distribute more vaccines to other countries, new vaccines directed against mutants, and the necessary rapid tests and protective equipment needed by medical staff, first responders, essential workers and especially teachers and students. I’m still hopeful we can work together on our and the world’s infectious disease problems. 

What Our Team Is Reading This Week

COVID-19

SARS-CoV-2 Update

It’s time for our next 14-day moving average determinations for SARS-CoV-2 for the United States and my thoughts on vaccines and mutant viruses. We use the WORLDOMETERS aggregators data set to make any projections since it includes data from the Department of Veterans Affairs, the U.S. Military, federal prisons and the Navajo Nation.

In the United States, SARS-CoV-2 deaths have decreased for the sixth time in a 14-day period. There were 96 fewer deaths per day than in the last 14-day period. In the last 14 days, the number of infections has decreased by 17,267 infections per day.Our infections per day are still high, probably secondary to SARS-CoV-2 mutants, to include the B.1.1.7 (UK isolate), a New York isolate B.1.526, the CAL.20C isolate, the South African isolate B.1.351, the Brazilian isolates P.1 and P.2, and the new Indian isolate B.1.617. I would predict that the opening of schools, places of worship, bars, restaurants, indoor dining and travel all will contribute to further spread of multiple SARS-CoV-2 mutants and rising numbers  in infections, hospitalizations and deaths in the coming months. Increased traveling as well as upcoming Memorial Day weekend, summer vacations, and the July 4 holiday will all cause further increases. Vaccinations, increased mask usage and social distancing, which are a part of the Biden SARS-CoV-2 plan (day 122 of plan) will be necessary to stop spread of mutants and cause  further reductions in infections, hospitalizations and deaths in the future. On 5/21/21, 29,014 new infections occurred in the United States. There were also 603 deaths. The number of hospitalized patients is decreasing, but 7,392 patients are still seriously or critically ill. The number of critically ill patients has decreased by 1,748 in the last 14 days, while 8,497 new deaths occurred. The number of critically ill patients is decreasing for the third 14 day period but a large number of patients are still dying each day. 

As of 5/21/21, we have had 603,408 deaths and 33,862,398 SARS-CoV-2 infections in the United States. We have had 443,372 new infections in the last 14 days. We are adding an average of 221,686 infections every 7 days. Each million infections usually results in 10,000 to 20,000 deaths. On 5/21/21, twenty-two states have had greater than 500,000 total infections, and 33 states have had greater than 5,000 total deaths. Nine states (Michigan, Georgia, Illinois, New Jersey, Pennsylvania,Florida, Texas, New York and California) have had greater than 20,000 deaths. Four states (Florida, Texas, New York and California) have had greater than 35,000 deaths.

For comparison, on 11/20/20 in the United States, 3.70% of the population had a documented SARS-CoV-2 infection. California was ranked 41st in infection percentage at 2.77%. In North Dakota 9.18% of the population was infected (ranked #1), and in South Dakota 8.03% of the population was infected (ranked #2).

As of 5/21/21, in the United States, 10.17% of the population has had a documented SARS-CoV-2 infection. In the last 6 months, over 6% of our country became infected with SARS-CoV-2. 

As of 5/21/21, California was still ranked 36th in infection percentage at 9.55%. In North Dakota 14.30% of the population was infected (ranked #1), while Rhode Island was at 14.27% (ranked #2) and South Dakota was at 14.00% of the population infected (ranked #3). Thirty-one states have greater than 10% of their population infected and 41 states have greater than 9% of their population infected. Only one state has less than 3% of their population infected: Hawaii (2.52%). Ten states still have greater than 1,000 new infections per day with Florida leading again on 5/21/21 with 2,371 infections.

New Mutants

A new mutant SARS-CoV-2 virus (lineage B.1.1.7), first seen in the UK in September 2020, has now been found in multiple other countries. There are 3,170 reported cases in the USA as of 3/11/21, 8337 cases as of 3/25/21 and 20,915 cases as of 4/10/21 in the US. This isolate has now been found in 50 states and the District of Columbia. This isolate is more infectious than other previously circulating B2 lineage isolates. There are two deletions and six other mutations in its spike protein. One mutation involves a change of one amino acid, an asparagine at position 501 in the receptor binding motif with a tyrosine. This enhances binding (affinity) to the ACE-2 receptor and may alone be responsible for the increased infectivity of this isolate. A study published March 10 in the British Medical Journal (BMJ) found that the risk of death increased by 64% in patients infected with the B.1.1.7 variant compared to all other isolates. Due to air and other travel, this isolate will become the dominant isolate worldwide. 

On 4/10/21, the CDC stopped providing data to the public on the number of reported cases of all variants of SARS-CoV-2, both nationally and by state. This data used to be available at https://www.cdc.gov/coronavirus/2019-ncov/transmission/variant-cases.html. The CDC claims that the data is available in its COVID-19 Data Tracker, but only percentages, not actual case numbers, are available, and the data ends on April 10, 2021.   

Luckily, GISAID is still reporting variant data. The United States has had more isolations of B.1.1.7 in the last four weeks (15,909) than any other country in the world, to include the United Kingdom. There have been a total of 132,214 cases of B.1.1.7 identified in the US to date. 22,300 have occurred in the last 4 weeks. (See chart below.)

At 191 cases, the United States has the fourth highest number of isolations of B.1.351 (the South African variant) in the last four weeks and a total of 1,564 isolations. 

And the United States has now surpassed Brazil for the most isolations of P.1 in the world, with 10,362 overall and 3,003 in the past four weeks. 

As for B.1.617, the variant recently identified in India, only India and the United Kingdom have more isolated cases than in the United States, which has 1,051 total cases, 506 of which were identified in the last four weeks. 

The United States has also surpassed both the UK and Nigeria for the most isolations of B.1.525 in the world, with 938 overall and 109 in the past four weeks. 

A disturbing report out of the UK has found a second mutation in B.1.1.7. This mutation, which occurs in the loop sequence, has also been found in the South African (B.1.351) and Brazilian (P.1) variants. (The loop sequence is in the receptor binding motif in the receptor binding domain of the S1 sequence of the spike protein.) This mutation involves a change of one amino acid of the spike protein, number 484, from glutamic acid to lysine. This point mutation allows the virus to bind better to the ACE2 receptor, which increases infectivity. People who are exposed to one of these variants (versus the old B2 isolate) are more likely to be infected and are more likely to transmit the virus to others. 

In our last three updates we summarized a research letter published in Clinical Infectious Diseases about a patient in the UK who was first infected in April with a B2 isolate and experienced only mild symptoms but was infected with the new B.1.1.7 variant in December and became critically ill. The patient described in this research letter was not protected by a natural infection with a B2 lineage SARS-CoV-2 isolate in April 2020 from having a potentially lethal second infection with a B.1.1.7 lineage variant in December 2020, suggesting that folks who have had a past SARS-CoV-2 infection should not expect to have any immunity to new variants such as B.1.1.7. All of the currently available vaccines were developed with spike protein from B2 lineages. Moderna, Pfizer, and AstraZeneca/Oxford are currently remaking their spike protein vaccines to address the mutations in the South African variant of SARS-CoV-2 because the AstraZeneca/Oxford vaccine did not work in a small trial in South Africa, where most of the patients had the South African mutant (B.1.351). 

A California Mutant

A fourth mutant isolate of SARS-CoV-2, B.1.429 + B.1.427 (CAL.20C), is the predominant mutation identified in California. This isolate does not have any of the mutations mentioned above, but contains five mutations, three of which are in the spike protein, but not in the receptor binding motif. This mutant may be partially responsible for the massive increase in infections in California, to include infections of people who had already recovered from a SARS-CoV-2 infection earlier. In California to date, we have had 3,775,758 infections and 62,858 total deaths. California is averaging 45 deaths per day in the last 14 days, which is a 13 deaths per day decrease from the preceding 14 day period. Currently, 9.55% of the population in California is infected. Nationally, we rank 35th in the percentage of people in the state infected. To my knowledge, only one privately held company is currently modifying their vaccine to cover the B.1.429 + B.1.427 mutant. 

New Indian Mutant B.1.617 Arrives in California

Stanford University announced five weeks ago that they have identified five infections with the Maharashtra India VOC 32421 (new variant designation B.1.617) in the San Francisco Bay Area. There are actually three different B.1.617 variants: B.1.617.1, B.1.617.2 and B.1.617.3. The most common variant appears to be B.1.617.2 This isolate is a double-mutant responsible for greater than 50% of the infections in India. The data from India the last 14 days ending on 5/21/21 is still disturbing. India has had 4,398,458 infections in the last 14 days or an average of 314,176 infections per day. During this 14-day period India reported 57,243 deaths or 4,089 deaths per day. On May 21, 2021, India reported 254,395 new infections and 4,143 new deaths. On 5/21/21 the total deaths due to SARS-CoV-2 infections in India stood at 295,508. India, with a population of 1,390,456,911, has had only 1.88% of the country infected. Their hospitals are still running out of vaccines, oxygen, medications, beds and ventilators. Sadly a health disaster continues in the world’s most populous country. I would predict that prior SARS-CoV-2 infection in India or first generation SARS-CoV-2 vaccines will have a decreased effect on this mutant discussed in the next paragraph. 

Many of you may now be familiar with the E484K mutation present in the South African isolate, the Brazilian isolate, the New York isolate (B.1.256), and the new Nigerian/UK double mutant. When vaccine manufacturers make booster vaccines to address these variants, they will only account for the E484K mutation. What sets this Maharashtra India B.1.617 variant apart from the other variants is that it has a different point mutation at amino acid 484 that involves a change of one amino acid of the spike protein, number 484, from glutamic acid to glutamine (E484Q). This point mutation, like E484K, probably allows the virus to bind to the ACE2 receptor and evade neutralizing antibodies directed against the original Wuhan sequence. A vaccine created to address E484K would not address this isolate. 

The second mutation in Maharashtra India VOC B.1.617 is L452R, which is one of the same mutations seen in CAL.20C (B.1.429 + B.1.427). This mutation is also not being covered by any vaccine currently being made as a booster. It’s possible that people in California who were infected by the Cal.20C mutant in the last six months might have some additional cross protective antibodies to B.1.617.

Watching the Data

Over the next few months, we’ll be paying close attention to correlations between the SARS-CoV-2 data, the number of isolates identified in various countries and states, and the non-pharmaceutical interventions (like mask mandates and lockdowns) put in place by state and national governments. Data on infections, deaths, and percent of population infected was compiled from Worldometers. Data for this table for SARS-CoV-2 Isolates Currently Known in Location was compiled from GISAID and the CDC. It’s worth noting that GISAID provided more data than the CDC, whose most recent data on variants is from May 8. 

LocationTotal Infections as of 5/21/21New Infections on 5/21/21Total DeathsNew Deaths on 5/21/21% of Pop.InfectedSARS-CoV-2 Isolates Currently Known in LocationNational/ State Mask Mandate?Currently in Lockdown?
World166,465,183621,0483,457,50012,7782.13%B2 lineageB.1.1.7 (UK)B.1.525 (Nigeria/UK)B.1.526 (USA-NYC)B.1.351 (SA)B.1.429 + B.1.427 (USA)*P.1 (Brazil)P.2 (Brazil)A lineage isolateV01.V2 (Tanzania)APTK India VOC 32421B.1.617+ (India)BV-1 (Texas, USA)NoNo
USA33,862,398
(ranked #1)
29,014
(ranked #4)
603,408
(ranked #1)
65710.17%B2 lineageB.1.1.7 (UK)B.1.525 (Nigeria/UK)B.1.526 (USA-NYC)B.1.351 (SA)B.1.429 + B.1.427 (USA)*P.1 (Brazil)P.2 (Brazil)B.1.617+ (India)BV-1 (Texas, USA)NoNo
Brazil15,976,156(ranked #3)   77,598(ranked #2) 446,521(ranked #2)2,1367.46%B2 lineageB.1.1.7 (UK)B.1.351 (SA)P.1 (Brazil)P.2 (Brazil)NoNo
India26,285.069(ranked #2)254,395(ranked #1)295,508(ranked #3)4,1431.88%B2 lineageB.1.1.7 (UK)B.1.351 (SA)B.1.429 + B.1.427 (USA)*B.1.525 (Nigeria/UK)APTK India VOC 32421B.1.617+ (India)NoNo
United Kingdom4,457,752(ranked #7)2,829127,71096.53%B2 lineageB.1.1.7 (UK)B.1.525 (Nigeria/UK)B.1.351 (SA)B.1.429 + B.1.427 (USA)*P.1 (Brazil)B.1.617+ (India)NoNo
California, USA3,775,758(ranked #9 in world)1,22362,858469.55%B2 lineageB.1.1.7 (UK)B.1.351 (SA)B.1.429 + B.1.427 (USA)*P.2 (Brazil)B.1.617+ (India)NoNo
Mexico2,390,140(ranked #15)2,628221,080(ranked #4)2301.83%B2 lineageB.1.1.7 (UK)B.1.429 + B.1.427 (USA)*P.1 (Brazil)B.1.617+ (India)NoNo
South Africa1,628,335(ranked #20)3,33255,7191512.71%B2 lineageB.1.1.7 (UK)B.1.351 (SA)B.1.617+ (India)NoNo
Canada1,352,121(ranked #22)4,67625,162513.55%B2 lineageB.1.1.7 (UK)B.1.525 (Nigeria/UK)B.1.429 + B.1.427 (USA)*P.1 (Brazil)B.1.617+ (India)Yes, except Alberta ProvinceNo
Poland2,863,030(ranked #13)1,67872,6911917.57%B2 lineageB.1.1.7 (UK)B.1.525 (Nigeria/UK)B.1.351 (SA)B.1.617+ (India)NoNo
Turkey5,169,951(ranked #5)9,52845,8402146.07%B2 lineageB.1.1.7 (UK)B.1.525 (Nigeria/UK)B.1.351 (SA)B.1.429 + B.1.427 (USA)**P.1 (Brazil)NoNo
Russia4,983,845(ranked #6)8,937117,7393783.41%B2 lineageB.1.1.7 (UK)B.1.351 (SA)B.1.617+ (India)NoNo
Argentina3,482,512(ranked #11)35,46835,4686927.64%B2 lineageB.1.1.7 (UK)B.1.525 (Nigeria/UK)B.1.351 (SA)B.1.429 + B.1.427 (USA)**P.1 (Brazil)B.1.617+ (India)NoNo

*Also referred to as CAL.20C

SARS-CoV-2, Children, and MIS-C/PIMS

I’m pleased to see that COVID-19 cases and MIS-C (PIMS) cases in children in the US are finally getting national attention. The CDC now tracks total MIS-C cases and deaths in children and young adults up to 20 years old in the United States. As of May 3, CDC reported 3,742 cases of MIS-C that meet the case definition and 35 deaths—that’s 557 new cases and no new deaths since the March 29 report. The CDC notes, “As of October 1, the number of cases meeting the case definition for multisystem inflammatory syndrome in children (MIS-C) in the United States surpassed 1,000. As of February 1, this number surpassed 2,000, and exceeded 3,000 as of April 1.” This means it took seven months to reach 1,000 MIS-C cases, only four months to reach an additional 1,000 cases, and only two months to add an additional 1,185 cases. This suggests to us that B.1.1.7 is causing more MIS-C. We’re averaging over 500 new cases of MIS-C each month for the last two months, despite decreases in the number of SARS-CoV-2 infections in the United States. 

Date of ReportingTotal MIS-C PatientsChange Since Last ReportTotal MIS-C DeathsChange Since Last Report
5/3/20213742+55735-1
3/29/20213185+56836+3
3/1/2021261733

Schools in the United States have been open throughout the pandemic, with teachers and education support professionals demonstrating their extraordinary ability to adapt in adverse circumstances. Teachers all over the country reinvented their teaching, taking their classrooms online in order to provide safe and remote learning experiences for students. The so-called “reopening” of schools, which more accurately refers to the opening of school buildings, as schools never closed, has been highly politicized, with many governors issuing mandates for in-person instruction, even as case counts, hospitalizations, and deaths in their states rose exponentially. The CDC has maintained that transmission risk in schools is minimal, provided that adequate safety measures are taken; however, we know that many states have not properly enforced universal masking (and some are repealing mask mandates this week), and we know that many school facilities are not equipped with the proper air handling systems. With more school buildings opening, there is a growing body of research that suggests that COVID-19 transmission can and does happen in schools. 

After recommending for months that school buildings be open, in mid-February (a year into the pandemic), The American Academy of Pediatrics, in collaboration with the Children’s Hospital Association, finally began tracking data on COVID-19 in children at the state and national level. Data reporting by states is still voluntary, and every state is different in its willingness to collect and disclose data on infections, hospitalizations, deaths, and testing rates in children. 

As of the APA’s May 20 report, only 11 states provide age distribution for testing. This makes it difficult to hold states accountable for testing each age group in proportion to its population. We’ve seen a trend in states where testing data with age distribution is available that children are tested at lower rates than adults. Hospitalization data by age group is only available in 24 states and New York City, so we only understand the severity of COVID-19 infections in children for about half the country. Age distribution for cases is provided by 49 states, New York City, the District of Columbia, Puerto Rico, and Guam. It’s worth noting that New York State does not provide age data for cases, testing, hospitalizations, and deaths. Two states, Florida and Utah, only report cases in children aged 0-14, so the number of cases, hospitalizations, and deaths in children ages 15-17 is unknown in these states. 

As of May 20, A total of 316 child deaths due to COVID-19 were reported in 43 states (an increase of 8 child deaths in one week). In the United States, The following states do not report child mortality due to COVID-19: Michigan, Montana, New Mexico, New York, Rhode Island, South Carolina, and West Virginia. Texas only reports age data for 3% of confirmed COVID-19 cases, so state-level data from Texas is extremely limited for assessing the incidence of COVID-19 in children. Even considering this, Texas reported 52 child deaths. Arizona reported 33 (+2), California 23 (+2), Colorado 13, Florida 7 (+1), Georgia 10, Illinois 18, Maryland 10, Tennessee 10, Massachusetts 7 (+2), Pennsylvania 11 (+1), and New York City 24. 

If we truly want to keep children safe, especially as many school buildings open for in-person instruction, we need to collect more complete data in every state on child testing rates, cases, hospitalizations, and deaths.

The Road Ahead

We are on Day 122 of the Biden-Harris administration.The President has made the pandemic a first priority and has now ordered enough vaccines to vaccinate everyone who wants a vaccination by July 2021. As of 5/24/21, 164.3 million people have had one dose of any vaccine. 131 million people are fully vaccinated. 

As of May 10, all people in the U.S. over the age of 12 are eligible to receive a vaccine. The Biden administration has already exceeded its goal of administering 200 million doses of vaccine in the first 100 days of the administration. The Pfizer-BioNtech is already approved for ages 12-15 and the Moderna vaccine should be approved in June 2021. Moderna has applied for emergency use authorization to administer their mRNA vaccines to children aged 12-15. Testing is ongoing for children in younger age groups and may be approved for ages 2-11 by the end of September 2021. 

Testing, wearing masks, social distancing and washing our hands frequently should no longer be political issues. These are non-pharmaceutical interventions used by most successful countries and some states to protect their citizens and their economies. New Zealand, Taiwan, and Australia are three countries that have done this successfully. In the United States, Hawaii is doing a better job handling the pandemic than many of our states. These interventions and vaccination should keep the pandemic from overwhelming our health care delivery systems world-wide. New mutations like B.1.429 + B.1.427 (Cal.20C) and the UK, Brazillian, South African, and Indian variants will probably spread rapidly throughout the United States over the next 90 days as many states (particularly in Texas, Florida, Iowa, Mississippi, Wyoming and South Carolina) open up everything and do away with masking and social distancing. We will probably see increased new infections per day in the United States. In the UK, B.1.1.7, has increased the number of infections, hospitalizations and deaths. This and other mutants may do the same thing in the USA.

The Pfizer and Moderna RNA vaccines and the Johnson & Johnson single dose vaccination adenovirus vaccine are all being used to immunize people in the USA. The Oxford-AstraZeneca vaccine and Novavax vaccine may be available in the fourth quarter of 2021. 

The bad news is that all currently available vaccines are based on the Chinese spike protein sequence from December 2019. Mutated isolates, as discussed above, may overtake our ability to produce new vaccines and vaccinate the populace. Like Influenza vaccines, we may have to reformulate vaccines based on active, worldwide surveillance at least every 4 to 6 months. The FDA is currently putting together a guidance document for how to develop booster vaccines for SARS-CoV-2 mutations. A surrogate marker of protection like antibody to the mutated Receptor Binding Domains of SARS-CoV-2 should be considered for vaccine approval. 

The ideal approach to spreading major mutations on at least five continents would be to make vaccines against each of the mutations. I’d get all of the vaccine companies and contract production companies on a call and “suggest” that two companies at least make and mass produce one of the four mutations. The government would pay the cost and buy at least 200 million doses in advance for each variant at say $40 a dose. The total cost to purchase the vaccine (800 million doses) would only be 32 billion dollars. Give each company a billion dollars each for development costs (another 8 billion dollars). Spend another two billion dollars for syringes and you’ve got enough booster doses to vaccinate 200 million people for all 4 variants. 42 billion dollars would be a small price to pay to catch up with the current mutations. Even if you had to do this every two years, it would be well worth the dollars spent. 

We are not doing adequate numbers of PCR or antigen detection assays in the United States. According to JHU, in January of 2021, we were doing up to 2,307,949 tests per day. In March 2021, the highest number of tests per day was 1,709,210, and in April, the highest number of tests per day was 2,008,319. Currently, we’re doing 975,589 tests per day (7-day moving average); that’s 453,963 fewer tests per day than the April high. 

We still need to perform more virus isolations and perform more DNA sequencing of viruses in each country, state, populous city, and county if we are to rapidly identify new mutations. I’m more hopeful that we will have the facilities, the equipment, and the trained staff needed to perform this work. As a nation we still need to make and distribute more vaccines for other countries, new vaccines directed against mutants, and the necessary rapid tests and protective equipment needed by medical staff, first responders, essential workers and especially teachers and students. I’m still hopeful we can work together on our and the world’s infectious disease problems. 

What Our Team Is Reading This Week

COVID-19

SARS-CoV-2 Update

It’s time for our next 14-day moving average determinations and projections for infections and deaths from SARS-CoV-2 for the United States and my thoughts on vaccines and mutant viruses. We use the WORLDOMETERS aggregators data set to make our projections of future total infections and deaths since it includes data from the Department of Veterans Affairs, the U.S. Military, federal prisons and the Navajo Nation.

In the United States, SARS-CoV-2 deaths have decreased for the fourth time in a 14-day period. There were 133 fewer deaths per day than in the last 14-day period. In the last 14 days, the number of infections has increased by 11,210 infections per day. This increase in infections over the last four 14-day periods is secondary to SARS CoV-2 mutants, to include the B.1.1.7 (UK isolate), a New York isolate B.1.526, the CAL.20C isolate, the South African isolate and the Brazilian isolates. I would predict that the opening of schools, places of worship, bars, restaurants, indoor dining and travel all will contribute to further spread of multiple SARS-CoV-2 mutants and rising numbers  in infections, hospitalizations and deaths in the coming months. Increased traveling over Easter and Spring break as well as upgoing Memorial Day weekend, summer vacations and the July 4th holiday will all cause further increases. Vaccinations, increased mask usage and social distancing, which are a part of the Biden 100-day SARS-CoV-2 plan (day 80 of plan) will be necessary to stop spread of mutants and cause  reductions in infections, hospitalizations and deaths in the future. On 4/09/21, 85,638 new infections occurred in the United States. There were also 929 deaths. The number of hospitalized patients is increasing, and only 9,078  patients are critically ill. The number of critically ill patients has increased by 468 in the last 14 days, while 13,006 new deaths occurred. The number of critically ill patients is increasing and a large number of patients are still dying each day. 

As of 4/09/21, we have had 574,840 deaths and 31,802,772 SARS-CoV-2 infections in the United States. We have had 949,742 new infections in the last 14 days. We are adding 474,871 infections every 7 days. Each million infections usually results in at least 20,000 deaths. On 4/9/21, twenty-one states had greater than 500,000 total infections, and 32 states had greater than 5,000 total deaths. 

For comparison, on 11/20/20 in the United States, 3.70% of the population had a documented SARS-CoV-2 infection. California was ranked 41st in infection percentage at 2.77%. In North Dakota 9.18% of the population was infected (ranked #1), and in South Dakota 8.03% of the population was infected (ranked #2).

As of 4/09/21, in the United States, 9.60% of the population has had a documented SARS-CoV-2 infection. In the last 5 months nearly 6% of our country became infected with SARS-CoV-2. 

As of 4/09/21, California was ranked 33rd in infection percentage at 9.34%. In North Dakota 13.71% of the population was infected (ranked #1) and in South Dakota 13.50% of the population was infected (ranked #2). Thirty-five states have greater than 9% of their population infected and 45 states have greater than 6% infected. Only one state has less than 3% of their population infected: Hawaii (2.15%). 

New Mutants

A new mutant SARS-CoV-2 virus (lineage B.1.1.7), first seen in the UK in September, has now been found in multiple other countries. There are 3,170 reported cases in the USA as of 3/11/21. As of 3/25/21 there are 8,337 reported cases in the USA. This isolate has now been found in 50 states and the District of Columbia. This isolate (let’s call it Lineage B.1.1.7 or SARS-CoV-2 UK) is more infectious than other previously circulating B2 lineage isolates. There are two deletions and six other mutations in its spike protein. One mutation involves a change of one amino acid, an asparagine at position 501 in the receptor binding motif with a tyrosine. This enhances binding (affinity) to the ACE-2 receptor and may alone be responsible for the increased infectivity of this isolate. A study published March 10 in the British Medical Journal (BMJ) found that the risk of death increased by 64% in patients infected with the B.1.1.7 variant compared to all other isolates. Due to air and other travel, this isolate will become the dominant isolate worldwide. 

As of 3/11/21 B.1.351, also known as the South African isolate, had 108 reported cases and has occurred in 23 states and the District of Columbia. As of 3/25/21 there are 266 reported cases in 29 states and the District of Columbia. On 3/11/21 the P.1 isolate (Brazil) had 17 reported cases and has been found in 10 states. As of 3/25/21 there were 79 P1 isolates in 11 states. (This data is available at https://www.cdc.gov/coronavirus/2019-ncov/transmission/variant-cases.html)

A disturbing report out of the UK has found a second mutation in B.1.1.7. This mutation, which occurs in the loop sequence has also been found in the South African (B.1.351) and Brazilian (P.1) variants. (The loop sequence is in the receptor binding motif in the receptor binding domain of the S1 sequence of the spike protein.) This mutation involves a change of one amino acid of the spike protein, number 484, from glutamic acid to lysine. This point mutation allows the virus to bind better to the ACE2 receptor, which increases infectivity. People who are exposed to one of these variants (versus the old B2 isolate) are more likely to be infected and are more likely to transmit the virus to others. 

In our last three updates we summarized a research letter published in Clinical Infectious Diseases about a patient in the UK who was first infected in April with a B2 isolate and experienced only mild symptoms but was infected with the new B.1.1.7 variant in December and became critically ill. The patient described in this research letter was not protected by a natural infection with a B2 lineage SARS-CoV-2 isolate in April 2020 from having a potentially lethal second infection with a B.1.1.7 lineage variant in December 2020, suggesting that folks who have had a past SARS-CoV-2 infection should not expect to have any immunity to new variants such as B.1.1.7. All of the currently available vaccines were developed with spike protein from B2 lineages. Moderna, Pfizer, and AstraZeneca/Oxford are currently remaking their spike protein vaccines to address the mutations in the South African variant of SARS-CoV-2 because the AstraZeneca/Oxford vaccine did not work in a small trial in South Africa, where most of the patients had the South African mutant (B.1.351). 

A California Mutant

A fourth mutant isolate of SARS-CoV-2, B.1.429 + B.1.427 (CAL.20C), has been identified in California. This isolate does not have any of the mutations mentioned above, but contains five mutations, three of which are in the spike protein, but not in the receptor binding motif. This mutant may be partially responsible for the massive increase in infections in California, to include infections of people who had already recovered from a SARS-CoV-2 infection earlier. In California to date, we have had 3,618,594 infections and 55,455 total deaths. California is averaging 249 deaths per day in the last 14 days. Currently, 9.15% of the population in California is infected. Nationally, we rank 29th in the percentage of people in the state infected. To my knowledge, only one privately held company is currently modifying their vaccine to cover the B.1.429 + B.1.427 mutant. 

New Mutants Arrive in California

Stanford University announced this week that they have identified five infections with the Maharashtra India VOC 32421 (yet to be named) in the San Francisco Bay Area. Two additional isolates are PCR positive and pending sequencing. This isolate is a double-mutant responsible for up to 40% of the infections in India. 

Many readers may now be familiar with the E484K mutation present in the South African isolate, the Brazilian isolate, the New York isolate (B.1.256), and the new Nigerian/UK double mutant. When vaccine manufacturers make booster vaccines to address these variants, they will only account for the E484K mutation. What sets this VOC from India apart from the other variants is that it has a different point mutation at 484 that involves a change of one amino acid of the spike protein, number 484, from glutamic acid to glutamine (E484Q). This point mutation, like E484K, probably allows the virus to bind to the ACE2 receptor and evade neutralizing antibodies directed against the original Wuhan sequence. A vaccine created to address E484K would not address this isolate. 

The second mutation in Maharashtra India VOC 32421 is L452R, which is one of the same mutations seen in CAL.20C (B.1.429 + B.1.427). This mutation is also not being covered by any vaccine currently being made as a booster. 

In India on 4/9/21, 144,829 new infections and 773 deaths occurred. India now has the third-highest number of infections in the world (13,202,783) and the fourth-highest number of deaths (168,467). India has a population of 1,390,456,911. At the present time, only 0.94% of the country has been infected with SARS-CoV-2. International travel and trade will continue to spread this highly infectious isolate to other parts of the world. This infection has now landed in California, our most-populous state. 

Watching the Data

Over the next few months, we’ll be paying close attention to correlations between the SARS-CoV-2 data, the number of isolates identified in various countries and states, and the non-pharmaceutical interventions (like mask mandates and lockdowns) put in place by state and national governments. Data on infections, deaths, and percent of population infected was compiled from Worldometers. Data for this table for SARS-CoV-2 Isolates Currently Known in Location was compiled from GISAID and the CDC. It’s worth noting that GISAID provided more data than the CDC. 

LocationTotal Infections as of 4/9/21New Infections on 4/9/21Total DeathsNew Deaths on 4/9/21% of Pop.InfectedSARS-CoV-2 Isolates Currently Known in LocationNational/ State Mask Mandate?Currently in Lockdown?
World135,290,124786,147*2,927,75013,3171.73%B2 lineageB.1.1.7 (UK)B.1.525 (Nigeria/UK)B.1.526 (USA-NYC)B.1.351 (SA)B.1.429 + B.1.427 (USA)**P.1 (Brazil)P.2 (Brazil)A lineage isolateV01.V2 (Tanzania)APTK India VOC 32421Maharashtra India VOC 32421NoNo
USA31,802,772
(ranked #1)
85,638
(ranked #3)
574,840
(ranked #1)
9299.56%B2 lineageB.1.1.7 (UK)B.1.525 (Nigeria/UK)B.1.526 (USA-NYC)B.1.351 (SA)B.1.429 + B.1.427 (USA)**P.1 (Brazil)P.2 (Brazil)Maharashtra India VOC 32421NoNo
Brazil13,375,414(ranked #2)   89,090(ranked #2) 348,934(ranked #2)3,6476.25%B2 lineageB.1.1.7 (UK)B.1.351 (SA)P.1 (Brazil)P.2 (Brazil)NoNo
India13,202,783(ranked #3)144,829(ranked #1)168,467(ranked #4)7730.94%B2 lineageB.1.1.7 (UK)B.1.351 (SA)B.1.429 + B.1.427 (USA)**B.1.525 (Nigeria/UK)APTK India VOC 32421Maharashtra India VOC 32421NoNo
United Kingdom4,365,456(ranked #6)3,145127,040606.40%B2 lineageB.1.1.7 (UK)B.1.525 (Nigeria/UK)B.1.351 (SA)B.1.429 + B.1.427 (USA)**P.1 (Brazil)NoNo
California, USA3,694,147(ranked #9)3,60960,2821539.34%B2 lineageB.1.1.7 (UK)B.1.351 (SA)B.1.429 + B.1.427 (USA)**P.2 (Brazil)Maharashtra India VOC 32421NoNo
Mexico2,267,109(ranked #14)5,140206,146(ranked #3)5481.74%B2 lineageB.1.1.7 (UK)B.1.429 + B.1.427 (USA)**P.1 (Brazil)NoNo
South Africa1,556,242(ranked #20)1,26753,226532.50%B2 lineageB.1.1.7 (UK)B.1.351 (SA)NoNo
Canada1,045,278(ranked #23)9,25523,251402.59%B2 lineageB.1.1.7 (UK)B.1.525 (Nigeria/UK)B.1.429 + B.1.427 (USA)**P.1 (Brazil)Yes, except Alberta ProvinceNo
Poland2,528,042(ranked #11)28,52328,5237686.40%B2 lineageB.1.1.7 (UK)B.1.525 (Nigeria/UK)B.1.351 (SA)NoNo
Turkey3,745,657(ranked #7)55,79133,45425314.40%B2 lineageB.1.1.7 (UK)B.1.525 (Nigeria/UK)B.1.351 (SA)B.1.429 + B.1.427 (USA)**P.1 (Brazil)NoNo

*This number is higher than it was 2 weeks ago. It was 630,055. 

**Also referred to as CAL.20C

SARS-CoV-2 and Children

I’m pleased to see that COVID-19 cases and MIS-C (PIMS) cases in children in the US are finally getting national attention. The CDC now tracks total MIS-C cases and deaths in children and young adults up to 20 years old in the United States. As of March 29, CDC reported 3,185 cases of MIS-C that meet the case definition and 33 deaths—that’s 568 new cases and 3 new deaths since the March 1 report. The CDC notes, “As of October 1, the number of cases meeting the case definition for multisystem inflammatory syndrome in children (MIS-C) in the United States surpassed 1,000. As of February 1, this number surpassed 2,000, and exceeded 3,000 as of April 1.” This means it took seven months to reach 1,000 MIS-C cases, only four months to reach additional 1,000 cases, and only two months to add additional 1,185 cases. This suggests to us that B.1.1.7 is causing more MIS-C. 

Schools in the United States have been open throughout the pandemic, with teachers and education support professionals demonstrating their extraordinary ability to adapt in adverse circumstances. Teachers all over the country reinvented their teaching, taking their classrooms online in order to provide safe and remote learning experiences for students. The so-called “reopening” of schools, which more accurately refers to the opening of school buildings, as schools never closed, has been highly politicized, with many governors issuing mandates for in-person instruction, even as case counts, hospitalizations, and deaths in their states rose exponentially. The CDC has maintained that transmission risk in schools is minimal, provided that adequate safety measures are taken; however, we know that many states have not properly enforced universal masking (and some are repealing mask mandates this week), and we know that many school facilities are not equipped with the proper air handling systems. With more school buildings opening, there is a growing body of research that suggests that COVID-19 transmission can and does happen in schools. 

After recommending for months that school buildings be open, in mid-February (a year into the pandemic), The American Academy of Pediatrics, in collaboration with the Children’s Hospital Association, finally began tracking data on COVID-19 in children at the state and national level. Data reporting by states is still voluntary, and every state is different in its willingness to collect and disclose data on infections, hospitalizations, deaths, and testing rates in children. 

As of the APA’s April 1 report, only 11 states provide age distribution for testing. This makes it difficult to hold states accountable for testing each age group in proportion to its population. We’ve seen a trend in states where testing data with age distribution is available that children are tested at lower rates than adults. Hospitalization data by age group is only available in 24 states and New York City, so we only understand the severity of COVID-19 infections in children for about half the country. Age distribution for cases is provided by 49 states, New York City, the District of Columbia, Puerto Rico, and Guam. It’s worth noting that New York State does not provide age data for cases, testing, hospitalizations, and deaths. Two states, Florida and Utah, only report cases in children aged 0-14, so the number of cases, hospitalizations, and deaths in children ages 15-17 is unknown in these states. 

As of April 1, A total of 284 child deaths due to COVID-19 were reported in 43 states (an increase of 16 child deaths since March 18). In the United States, The following states do not report child mortality due to COVID-19: Michigan, Montana, New Mexico, New York, Rhode Island, South Carolina, and West Virginia. Texas only reports age data for 3% of confirmed COVID-19 cases, so state-level data from Texas is extremely limited for assessing the incidence of COVID-19 in children. Even considering this, Texas reported 49 (+2) child deaths. Arizona reported 26 (+2), California 16 (+1), Colorado 12, Georgia 10, Illinois 17 (+1) , Maryland 10, Tennessee 11, and New York City 22 (+1). 

The United Kingdom tracks hospitalizations by age group, and with the increased incidence of B.1.1.7 saw the number of child hospitalizations double from November 2020 to January 2021. This data likely influenced the decision to close school buildings and go into total lockdown there on January 4, 2021. If we truly want to keep children safe, especially as many school buildings open for in-person instruction, we need to collect more complete data in every state on child testing rates, cases, hospitalizations, and deaths.

The Road Ahead

We are just on Day 80 of the Biden-Harris administration.The President has made the pandemic a first priority and has now ordered enough vaccine to vaccinate everyone who wants a vaccination by July 2021. We have been averaging 3 million vaccinations a day for the last seven days after having opened mass vaccination sites in multiple cities and states. To date, 178,837,781 doses of vaccine have been administered. As of 4/9/21, in the U.S., 68,202,458 people are fully vaccinated, which accounts for 20.5% of the population. On April 16, all people in the U.S. over the age of 16 will be eligible to receive a vaccine. The Biden administration is on track to exceed its goal of administering 200 million doses of vaccine in the first 100 days of the administration. Pfizer and Moderna have applied for emergency use authorization to administer their mRNA vaccines to children aged 12-16. Testing is ongoing for children in younger age groups. 

Testing, wearing masks, social distancing and washing our hands frequently should no longer be political issues. These are non-pharmaceutical interventions used by most successful countries and some states to protect their citizens and their economies. New Zealand, Taiwan, and Australia are three countries that have done this successfully. In the United States, Hawaii is doing a better job handling the pandemic than many of our states. These interventions with vaccination should keep the pandemic from overwhelming our health care delivery system. New mutations like B.1.429 + B.1.427 (Cal.20C) and the UK, Brazillian, South African, and Indian variants will probably spread rapidly throughout the United States over the next 90 days as several states (including Texas, Florida, Iowa, Mississippi) open up everything and do away with masking and social distancing. We are seeing an increase of 11,000 new infections per day in the United States, compared to an increase of only 9 new infections per day two weeks ago. In the UK, B.1.1.7, has increased the number of infections, hospitalizations and deaths. This and other mutants may be doing the same thing in the USA.

The Pfizer and Moderna RNA vaccines and the Johnson & Johnson single dose vaccination adenovirus vaccine are all being used to immunize people in the USA. The Oxford-AstraZeneca vaccine and Novavax vaccine should also be available in the second quarter of 2021. 

The bad news is that all currently available vaccines are based on the Chinese spike protein sequence from December 2019. Mutated isolates, as discussed above, may overtake our ability to produce new vaccines and vaccinate the populace. Like Influenza vaccines, we may have to reformulate vaccines based on active, worldwide surveillance at least every 4 to 6 months. The FDA is currently putting together a guidance document for how to develop booster vaccines for SARS-CoV-2 mutations. A surrogate marker of protection like antibody to the mutated Receptor Binding Domains of SARS-CoV-2 should be considered for vaccine approval. 

I still feel the current approach of companies and governments of making new vaccines against just the South African variant is wrong. In Brazil, where the P.1 isolate is dominant, they’ve had 1,050,649 infections and 45,208 deaths in the last 14 days. In South Africa, the total number of infections ever is 1,556,242, and they’ve had 53,226 deaths. Brazil is on track to have more infections and deaths in the next month than South Africa has had for the entire pandemic. It makes no sense to make a vaccine based on the South African mutant and not make one for the Brazilian P.1 mutant. 

The ideal approach to these spreading major mutations on at least five continents would be to make vaccines against each of the mutations. I’d get all of the vaccine companies and contract production companies on a call and “suggest” that two companies at least make and mass produce each of the four mutations. The government would pay the cost and buy at least 200 million doses in advance for each variant at say $40 a dose. The total cost to purchase the vaccine (800 million doses) would only be 32 billion dollars. Give each company a billion dollars each for development costs (another 8 billion dollars). Spend another two billion dollars for syringes and you’ve got enough booster doses to vaccinate 200 million people for all 4 variants. 42 billion dollars would be a small price to pay to catch up with the current mutations. Even if you had to do this every two years, it would be well worth the dollars spent. 

We are not doing adequate numbers of PCR or antigen detection assays in the United States. According to JHU, in January of 2021, we were doing up to 2,307,949 tests per day. In March 2021 so far, the highest number of tests per day has been 1,709,210, so we’re doing nearly 600,000 fewer tests per day. We still need to perform more virus isolations and perform more DNA sequencing of viruses in each country, state, populous city, and county if we are to rapidly identify new mutations. I’m more hopeful that we will have the facilities, the equipment, and the trained staff needed to perform this work. As a nation we are finally preparing to make more vaccine, new vaccines directed against mutants, and the necessary rapid tests and protective equipment needed by medical staff, first responders, essential workers and especially teachers and students. I’m still hopeful we can work together on our and the world’s infectious disease problems. 

What We’re Reading This Week

COVID-19

SARS-CoV-2 Update

It’s time for our next 14-day moving average determinations and projections for infections and deaths from SARS-CoV-2 for the United States and my thoughts on vaccines and mutant viruses. We use the WORLDOMETERS aggregators data set to make our projections of future total infections and deaths since it includes data from the Department of Veterans Affairs, the U.S. Military, federal prisons and the Navajo Nation.

In the United States, SARS-CoV-2 deaths have decreased for the third time in a 14-day period. There were 4,478 fewer deaths per day than in the last 14-day period. In the last 14 days, the number of infections has increased by 9 infections per day. This increase in infections over the last four 14-day periods may be secondary to SARS CoV-2 mutants B.1.1.7 (UK isolate), a New York isolate B.1.526, the CAL.20C isolate, the South African isolate and the Brazilian isolate. Increased mask usage and social distancing, which are a part of the Biden 100-day SARS-CoV-2 plan (day 66 of plan) will be necessary to stop spread of these mutants and cause further reductions in infections, hospitalizations and deaths. On 3/26/21, 76,976 new infections occurred in the United States. There were also 1,289 deaths. The number of hospitalized patients is decreasing, and only 8,610 patients are critically ill. The number of critically ill patients has decreased by 3,060 in the last 14 days, while 14,837 new deaths occurred. This still suggests that the number of critically ill patients is decreasing because a large number of patients are still dying each day. 

As of 3/26/21, we have had 561,142 deaths and 30,853,032 SARS-CoV-2 infections in the United States. We have had 792,803 new infections in the last 14 days. We are adding 396,402 infections every 7 days. Each million infections usually results in at least 20,000 deaths. On 3/12/21, twenty states have had greater than 500,000 total infections, and 30 states had greater than 5,000 total deaths. 

On 11/20/20 in the United States, 3.70% of the population had a documented SARS-CoV-2 infection. California was ranked 41st in infection percentage at 2.77%. In North Dakota 9.18% of the population was infected (ranked #1), and in South Dakota 8.03% of the population was infected (ranked #2).

As of 3/12/21, in the United States 9.28% of the population has had a documented SARS-CoV-2 infection. In the last 4 months nearly 6% of our country became infected with SARS-CoV-2. 

As of 3/26/21, California was ranked 31st in infection percentage at 9.25%. In North Dakota 13.43% of the population was infected (ranked #1) and in South Dakota 13.20% of the population was infected (ranked #2). Thirty-four states have greater than 9% of their population infected and 45 states have greater than 6% infected. Only two states have less than 3% of their population infected: Vermont (2.96%), and Hawaii (2.06%). 

New Mutants

A new mutant SARS-CoV-2 virus (lineage B.1.1.7), first seen in the UK in September, has now been found in multiple other countries. There are 3,170 reported cases in the USA as of 3/11/21. As of 3/25/21 there are 8,337 reported cases in the USA. This isolate has now been found in 50 states and the District of Columbia. This isolate (let’s call it Lineage B.1.1.7 or SARS-CoV-2 UK) is more infectious than other previously circulating B2 lineage isolates. There are two deletions and six other mutations in its spike protein. One mutation involves a change of one amino acid, an asparagine at position 501 in the receptor binding motif with a tyrosine. This enhances binding (affinity) to the ACE-2 receptor and may alone be responsible for the increased infectivity of this isolate. A study published March 10 in the British Medical Journal (BMJ) found that the risk of death increased by 64% in patients infected with the B.1.1.7 variant compared to all other isolates. Due to air and other travel, this isolate will become the dominant isolate worldwide. 

As of 3/11/21 B.1.351, also known as the South African isolate, had 108 reported cases and has occurred in 23 states and the District of Columbia. As of 3/25/21 there are 266 reported cases in 29 states and the District of Columbia. On 3/11/21 the P.1 isolate (Brazil) had 17 reported cases and has been found in 10 states. As of 3/25/21 there were 79 P1 isolates in 11 states. (This data is available at https://www.cdc.gov/coronavirus/2019-ncov/transmission/variant-cases.html)

A disturbing report out of the UK has found a second mutation in B.1.1.7. This mutation, which occurs in the loop sequence has also been found in the South African (B.1.351) and Brazilian (P.1) variants. (The loop sequence is in the receptor binding motif in the receptor binding domain of the S1 sequence of the spike protein.) This mutation involves a change of one amino acid of the spike protein, number 484, from glutamic acid to lysine. This point mutation allows the virus to bind better to the ACE2 receptor, which increases infectivity. People who are exposed to one of these variants (versus the old B2 isolate) are more likely to be infected and are more likely to transmit the virus to others. 

In our last three updates we summarized a research letter published in Clinical Infectious Diseases about a patient in the UK who was first infected in April with a B2 isolate and experienced only mild symptoms but was infected with the new B.1.1.7 variant in December and became critically ill. The patient described in this research letter was not protected by a natural infection with a B2 lineage SARS-CoV-2 isolate in April 2020 from having a potentially lethal second infection with a B.1.1.7 lineage variant in December 2020, suggesting that folks who have had a past SARS-CoV-2 infection should not expect to have any immunity to new variants such as B.1.1.7. All of the currently available vaccines were developed with spike protein from B2 lineages. Moderna, Pfizer, and AstraZeneca/Oxford are currently remaking their spike protein vaccines to address the mutations in the South African variant of SARS-CoV-2 because the AstraZeneca/Oxford vaccine did not work in a small trial in South Africa, where most of the patients had the South African mutant (B.1.351). 

A California Mutant

A fourth mutant isolate of SARS-CoV-2, B.1.429 + B.1.427 (CAL.20C), has been identified in California. This isolate does not have any of the mutations mentioned above, but contains five mutations, three of which are in the spike protein, but not in the receptor binding motif. This mutant may be partially responsible for the massive increase in infections in California, to include infections of people who had already recovered from a SARS-CoV-2 infection earlier. In California to date, we have had 3,618,594 infections and 55,455 total deaths. California is averaging 249 deaths per day in the last 14 days. Currently, 9.15% of the population in California is infected. Nationally, we rank 29th in the percentage of people in the state infected. To my knowledge, only one privately held company is currently modifying their vaccine to cover the B.1.429 + B.1.427 mutant. 

Watching the Data

Over the next few months, we’ll be paying close attention to correlations between the SARS-CoV-2 data, the number of isolates identified in various countries and states, and the non-pharmaceutical interventions (like mask mandates and lockdowns) put in place by state and national governments. Data on infections, deaths, and percent of population infected was compiled from Worldometers. Data for this table for SARS-CoV-2 Isolates Currently Known in Location was compiled from GISAID and the CDC. It’s worth noting that GISAID provided more data than the CDC. 

SARS-CoV-2, Children, and MIS-C/PIMS

I’m pleased to see that COVID-19 cases and MIS-C (PIMS) cases in children in the US are finally getting national attention. The CDC now tracks total MIS-C cases and deaths in children and young adults up to 20 years old in the United States. As of March 1, CDC reported 2,617 cases of MIS-C that meet the case definition and 33 deaths. (As of March 26, 2021, the CDC has not updated its MIS-C data from the March 1 data. We’re sure why the CDC would wait a whole month to update this data.) 

Schools in the United States have been open throughout the pandemic, with teachers and education support professionals demonstrating their extraordinary ability to adapt in adverse circumstances. Teachers all over the country reinvented their teaching, taking their classrooms online in order to provide safe and remote learning experiences for students. The so-called “reopening” of schools, which more accurately refers to the opening of school buildings, as schools never closed, has been highly politicized, with many governors issuing mandates for in-person instruction, even as case counts, hospitalizations, and deaths in their states rose exponentially. The CDC has maintained that transmission risk in schools is minimal, provided that adequate safety measures are taken; however, we know that many states have not properly enforced universal masking (and some are repealing mask mandates this week), and we know that many school facilities are not equipped with the proper air handling systems. With more school buildings opening, there is a growing body of research that suggests that COVID-19 transmission can and does happen in schools. 

After recommending for months that school buildings be open, in mid-February (a year into the pandemic), The American Academy of Pediatrics, in collaboration with the Children’s Hospital Association, finally began tracking data on COVID-19 in children at the state and national level. Data reporting by states is still voluntary, and every state is different in its willingness to collect and disclose data on infections, hospitalizations, deaths, and testing rates in children. 

As of the AAP’s March 18 report, only 11 states provide age distribution for testing. This makes it difficult to hold states accountable for testing each age group in proportion to its population. We’ve seen a trend in states where testing data with age distribution is available that children are tested at lower rates than adults. Hospitalization data by age group is only available in 24 states and New York City, so we only understand the severity of COVID-19 infections in children for about half the country. Age distribution for cases is provided by 49 states, New York City, the District of Columbia, Puerto Rico, and Guam. It’s worth noting that New York State does not provide age data for cases, testing, hospitalizations, and deaths. Two states, Florida and Utah, only report cases in children aged 0-14, so the number of cases, hospitalizations, and deaths in children ages 15-17 is unknown in these states. 

As of March 18, A total of 268 child deaths due to COVID-19 were reported in 43 states (an increase of 15 child deaths since March 4). In the United States, The following states do not report child mortality due to COVID-19: Michigan, Montana, New Mexico, New York, Rhode Island, South Carolina, and West Virginia. Texas only reports age data for 3% of confirmed COVID-19 cases, so state-level data from Texas is extremely limited for assessing the incidence of COVID-19 in children. Even considering this, Texas reported 47 (+3) child deaths. Arizona reported 24, California 15 (+1), Georgia 10, Illinois 16, Maryland 10, Pennsylvania 9 (+2), New Jersey 6 (+2) and New York City 21. 

The United Kingdom tracks hospitalizations by age group, and with the increased incidence of B.1.1.7 saw the number of child hospitalizations double from November 2020 to January 2021. This data likely influenced the decision to close school buildings and go into total lockdown there on January 4, 2021. If we truly want to keep children safe, especially as many school buildings open for in-person instruction, we need to collect more complete data in every state on child testing rates, cases, hospitalizations, and deaths.

The Road Ahead

We are just on Day 66 of the Biden-Harris administration.The President has made the pandemic a first priority and has now ordered enough vaccine to vaccinate everyone who wants a vaccination by July 2021. We have been averaging 2.6 million vaccinations a day for the last seven days after having opened mass vaccination sites in multiple cities and states. To date, 138 million doses of vaccine have been administered. The new goal of the Biden administration is to administer 200 million doses of vaccine in the first 100 days of his administration. 

Testing, wearing masks, social distancing and washing our hands frequently should no longer be political issues. These are non-pharmaceutical interventions used by most successful countries and some states to protect their citizens and their economies. New Zealand, Taiwan, and Australia are three countries that have done this successfully.  In the United States, Vermont and Hawaii are doing a better job handling the pandemic than many of our states. These interventions with vaccination should keep the pandemic from overwhelming our health care delivery system. New mutations like B.1.429 + B.1.427 (Cal.20C), the UK, Brazillian and South African variants will probably spread rapidly throughout the United States over the next 90 days as several states (including Texas, Florida, Iowa, Mississippi) open up everything and do away with masking and social distancing. We are starting to see increased numbers of infections occurring in the United States. In the last seven days, we’ve averaged 4,377 infections per day greater than the preceding seven days. In the UK, B.1.1.7, has increased the number of infections, hospitalizations and deaths. This mutant may be doing the same thing in the USA.

The Pfizer and Moderna RNA vaccines and the Johnson & Johnson single dose vaccination adenovirus vaccine are all being used to immunize people in the USA. The Oxford-AstraZeneca vaccine and Novavax vaccine should also be available in the second quarter of 2021. 

The bad news is that all currently available vaccines are based on the Chinese spike protein sequence from December 2019. Mutated isolates, as discussed above, may overtake our ability to produce new vaccines and vaccinate the populace. Like Influenza vaccines, we may have to reformulate vaccines based on active, worldwide surveillance at least every 4 to 6 months. The FDA is currently putting together a guidance document for how to develop booster vaccines for SARS-CoV-2 mutations. A surrogate marker of protection like antibody to the mutated Receptor Binding Domains of SARS-CoV-2 should be considered for vaccine approval. 

I still feel the current approach of companies and governments of making new vaccines against just the South African variant is wrong. In Brazil, where the P.1 isolate is dominant, they’ve had 1,039,036 infections and 32,046 deaths in the last 14 days. In South Africa, the total number of infections ever is 1,543,079, and they’ve had 56,602 deaths. Brazil is on track to have more infections and deaths in two weeks than South Africa has had for the entire pandemic. It makes no sense to make a vaccine based on the South African mutant and not make one for the Brazilian P.1 mutant. 

The ideal approach to these spreading major mutations on at least four continents would be to make vaccines against each of the mutations. I’d get all of the vaccine companies and contract production companies on a call and “suggest” that two companies at least make and mass produce each of the four mutations. The government would pay the cost and buy at least 200 million doses in advance for each variant at say $40 a dose. The total cost to purchase the vaccine (800 million doses) would only be 32 billion dollars. Give each company a billion dollars each for development costs (another 8 billion dollars). Spend another two billion dollars for syringes and you’ve got enough booster doses to vaccinate 200 million people for all 4 variants. 42 billion dollars would be a small price to pay to catch up with the current mutations. Even if you had to do this every two years, it would be well worth the dollars spent. 

We are not doing adequate numbers of PCR or antigen detection assays in the United States. According to JHU, in January of 2021, we were doing up to 2,307,949 tests per day. In March 2021 so far, the highest number of tests per day has been 1,709,210, so we’re doing nearly 600,000 fewer tests per day. We still need to perform more virus isolations and perform more DNA sequencing of viruses in each country, state, populous city, and county if we are to rapidly identify new mutations. I’m more hopeful that we will have the facilities, the equipment, and the trained staff needed to perform this work. As a nation we are finally preparing to make more vaccine, new vaccines directed against mutants, and the necessary rapid tests and protective equipment needed by medical staff, first responders, essential workers and especially teachers and students. I’m still hopeful we can work together on our and the world’s infectious disease problems. 

COVID-19

Check out Dr. Wright’s new vlog: Close Reading COVID-19!

Close Reading COVID-19 is hosted by Dr. Wright and his daughter Emily, who has served as Dr. Wright’s research assistant since 2011. In this program, we take a deep dive into the research on SARS-CoV-2 using the same close reading strategies that Emily, a high school English teacher, uses with her students.

In the very first episode of Close Reading COVID-19, we take a look at the research on SARS-CoV-2 Variant of Concern B.1.1.7, which was first detected in the United Kingdom in fall of 2020 and has now been detected in 45 states in the US. We also examine hospitalization data to see how B.1.1.7 might be affecting youth in the UK and explore the data on PIMS/MIS-C, the inflammatory syndrome that some children and young adults develop after a COVID-19 infection. Finally, Dr. Wright offers his advice on masking, indoor gatherings, and vaccinations.

For links to the articles mentioned in the program, check out the slide show.