
It’s time for our next 14-day moving average determinations for SARS-CoV-2 for the United States and my thoughts on vaccines and mutant viruses. We use the WORLDOMETERS aggregators data set to make any projections since it includes data from the Department of Veterans Affairs, the U.S. Military, federal prisons and the Navajo Nation.

SARS-CoV-2 infections are accelerating at a rapid rate in the United States and many other countries including the United Kingdom, France, Germany, and Italy. This is caused by the Delta variants and the Omicron variant of concern. Omicron is at least four times as infectious as the already highly infectious Delta variants. UK scientists have found that the household secondary attack rate for Omicron is 21.6%, compared to 10.7% with Delta, meaning people infected with Omicron are twice as likely to infect household members as they would be if infected with Delta. They also estimate a “three- to eight-fold increased risk of reinfection with the Omicron variant.”
I would expect the Omicron variant to continue to mutate just like Delta. There are already two Omicron variants, BA.1 and BA.2. We expect to see additional Omicron variants as this isolate spreads rapidly around the USA and the World. As of 12/18/21 the Omicron variant, which was first seen in South Africa on 11/08/21, is now in 40 states, Puerto Rico and the District of Columbia. It has also been identified in at least 70 countries.
Omicron has mutations which decrease the effectiveness of current vaccines and monoclonal antibodies. The effectiveness of the new Pfizer drug, PAXLOVIDTM, should not be compromised by any of the current mutations in Omicron or Delta variants. Pfizer completed their filing with the FDA on 11/15/21. That’s 33 days ago and still no word from the FDA on approval. No deaths occurred in their study in the treatment group. We are averaging over 1,000 deaths per day in the USA and Russia. If the drug were available and just 90% effective in preventing deaths, each country could prevent over 900 deaths per day. If the FDA takes another 30 days for approval and drug distribution doesn’t occur rapidly then that’s at least 27,000 additional deaths in each country that could have been prevented. For now only masking (N95 rated masks, please!), social distancing and vaccination will have any effect on these variants.
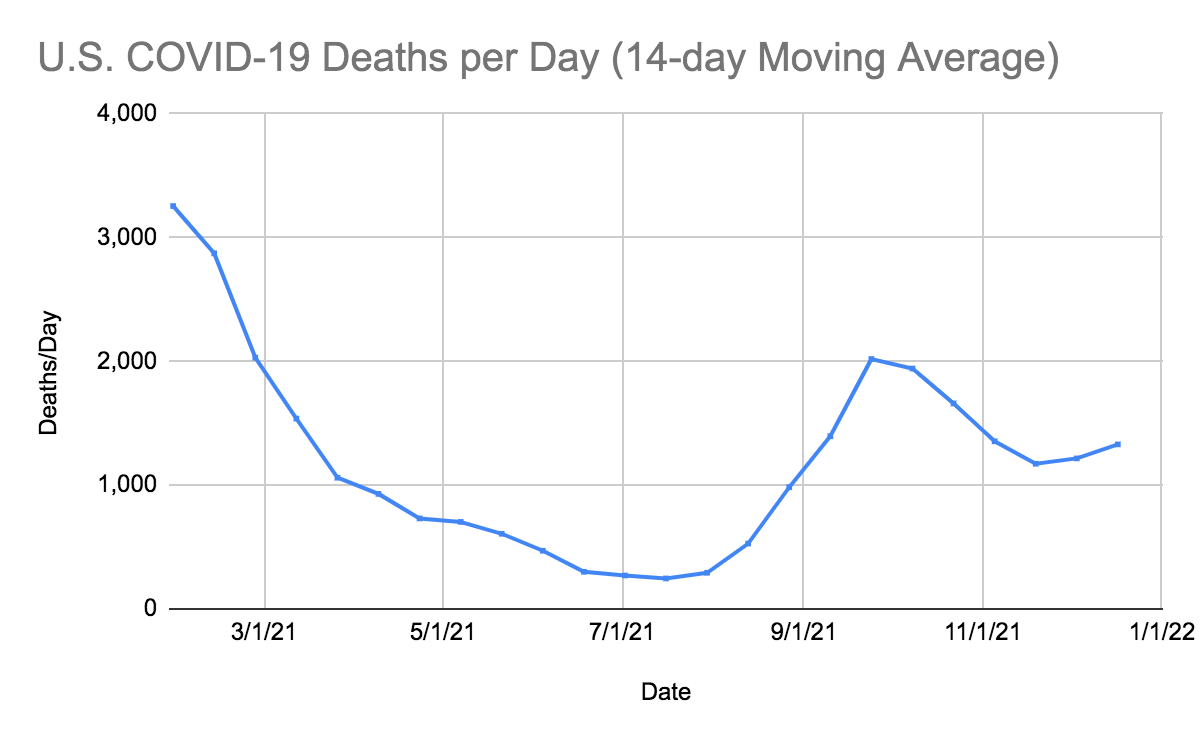
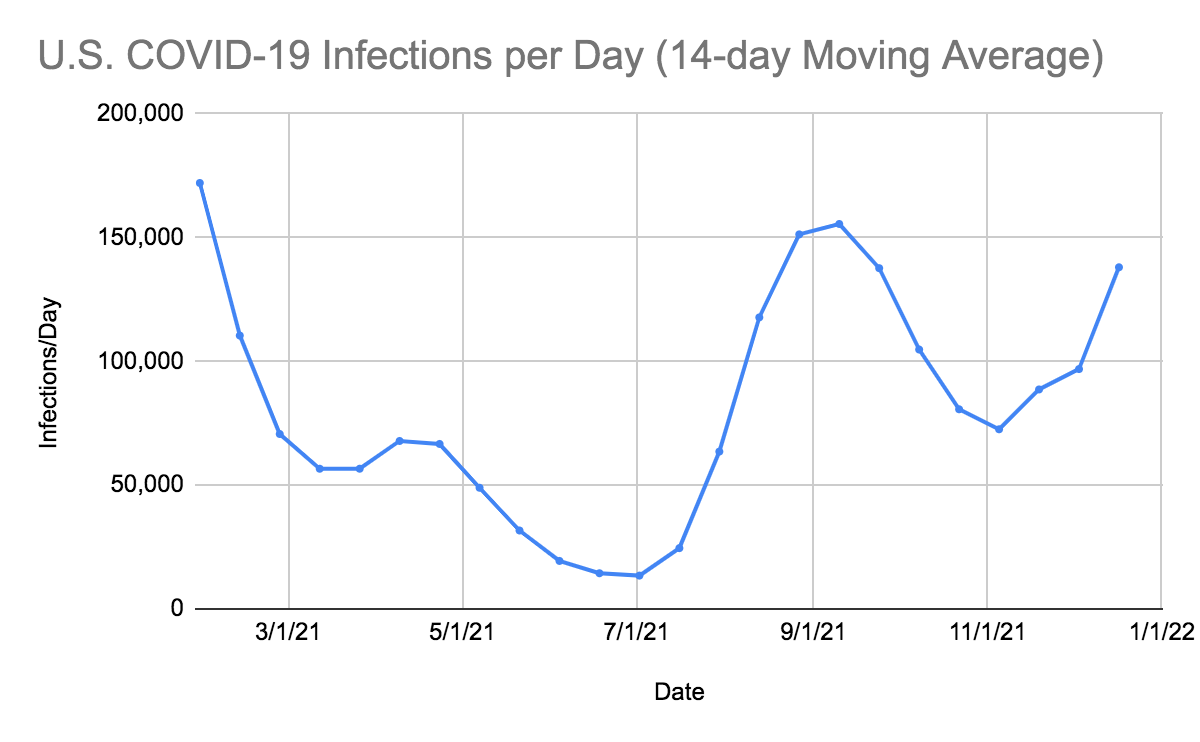
In the United States, SARS-CoV-2 deaths have increased for the second time in six 14-day periods. There were 113 more deaths per day than in the last 14-day period. In the last 14 days, the number of infections has increased by 41,127 infections per day compared to the preceding 14-day period. Our infections per day have increased for the third time over the last 14 weeks. With travel and multiple holidays and events occurring in the next 60 days, we expect the infections to continue to increase. Unless people get vaccinated and get their third dose of the vaccine, we will see further spread of Delta variants like AY4.2 and an increase in deaths particularly in people with risk factors and over the age of 55. Anyone over the age of 5 years can now get vaccinated in the United States at no cost. This should get done immediately.
A new variant, B.1.1.529 (Omicron), was first seen in South Africa on 11/8/21 with multiple new mutations, deletions and an insertion that is causing a doubling of new infections every 1.3 days in Gauteng, South Africa. In just 40 days, as of 12/17/21, Omicron has been found in 70 countries and 40 states in the United States. Unlike Delta variants in South Africa, Omicron is infecting and hospitalizing patients in all age groups but particularly children under five years of age and adults greater than 60 years of age. Increased vaccinations, vaccines against new mutants, drugs against 3C-like protease, increased mask usage and social distancing, which are part of the Biden SARS-CoV-2 plan, are all necessary to continue to stop further spread of mutants and reduce infections, hospitalizations, and deaths. The Delta variants still account for 97% of new infections in the United States. Omicron accounted for 3% of infections by 12/11/21.
On 12/17/21, the United States had 163,707 new infections with two states failing to report (Iowa and Maryland). There were also 1,653 deaths (with five other states failing to report deaths). Florida continues to consistently under-report daily infections and deaths. The number of hospitalized patients has been increasing in many areas, and now 15,602 patients are seriously or critically ill; that number was 13,714 two weeks ago. The number of critically ill patients has increased by 1,888 in the last 14 days, while at least 18,603 new deaths occurred. The number of critically ill patients has increased for the third time in twelve 14-day periods and a large number of patients are still dying each day (average 1,329/day).
As of 12/17/21, we have had 826,719 deaths and 51,510,281 SARS-CoV-2 infections in the United States. We have had 1,932,232 new infections in the last 14 days. We are adding an average of 966,166 infections every seven days. For the pandemic in the United States we are averaging one death for every 62.3 infections reported or over 16,050 deaths for each one million infections. As of 12/17/21, thirty-one states have had greater than 500,000 total infections, and 36 states have had greater than 5,000 total deaths. Eleven states (Ohio, Michigan, Georgia, Illinois, New Jersey, Pennsylvania, Florida, Texas, New York, Arizona and California) have had greater than 20,000 deaths. Four states (Florida, Texas, New York, and California) have had greater than 50,000 deaths.
On 11/20/20 in the United States, 3.70% of the population had a documented SARS-CoV-2 infection. California was ranked 41st in infection percentage at 2.77%. In North Dakota, 9.18% of the population was infected (ranked #1), and in South Dakota, 8.03% of the population was infected (ranked #2). As of 12/17/21, in the United States, 15.45% of the population has had a documented SARS-CoV-2 infection. In the last 13 months, 11.75% of our country became infected with SARS-CoV-2. On 11/20/20, there were 260,331 (cumulative) deaths in the US from SARS-CoV-2. In the last 13 months, there were 566,388 new deaths from SARS-CoV-2. For ten of those months, vaccines have been available to all adults. During these ten months, 221,946 people have died of SARS-CoV-2 infections. Many of these hospitalizations and deaths could have been prevented by vaccination, proper masking, and social distancing.
As of 12/17/21, California was ranked 42nd in infection percentage at 12.80% and 10.04% of Californians were infected in the last 13 months. And now let’s look at the top 27 infected states, all greater than 16%, which is not a list that you’d like to be on in 2021. North Dakota was at 22.17% (ranked #1), Alaska was at 20.39% (ranked #2), Tennessee was at 19.71% (ranked #3), Rhode Island was at 19.70% (ranked #4), South Dakota was at 19.62% (ranked #5), Wyoming 19.60% (ranked #6), , Utah at 19.26% (ranked #7), Iowa was at 18.93% (ranked #8), Kentucky was at 18.48% (ranked #9), Arizona was at 18.28% (ranked #10), Montana was at 18.22% (ranked #11), South Carolina was at 18.18% (ranked #12), Wisconsin was at 18.10% (ranked #13), Arkansas was at 17.97% (ranked #14), Florida was at 17.59% (ranked #15), Indiana was at 17.55% (ranked#16), Mississippi was at 17.55% (ranked #17), Idaho was at 17.53% (ranked #18), West Virginia was at 17.49% (ranked #19), Alabama was at 17.47% (ranked #20), Oklahoma was at 17.30% (ranked #21), Minnesota was at 17.15% (ranked#22), Kansas was at 16.93%(ranked #23), Nebraska was at 16.27% (ranked #24), Louisiana was at 16.79% (ranked #25), Delaware was at 16.74%(ranked #26) and Michigan at 16.01% of the population infected (ranked #27). Forty-two states now have greater than 12% of their population infected. Only one state has less than 7% of their population infected: Hawaii (6.43%). Hawaii and the US Virgin Islands still remain the safest places in the United States. Hawaii had its first patient with an Omicron (B.1.1.529) SARS-CoV-2 infection two weeks ago.
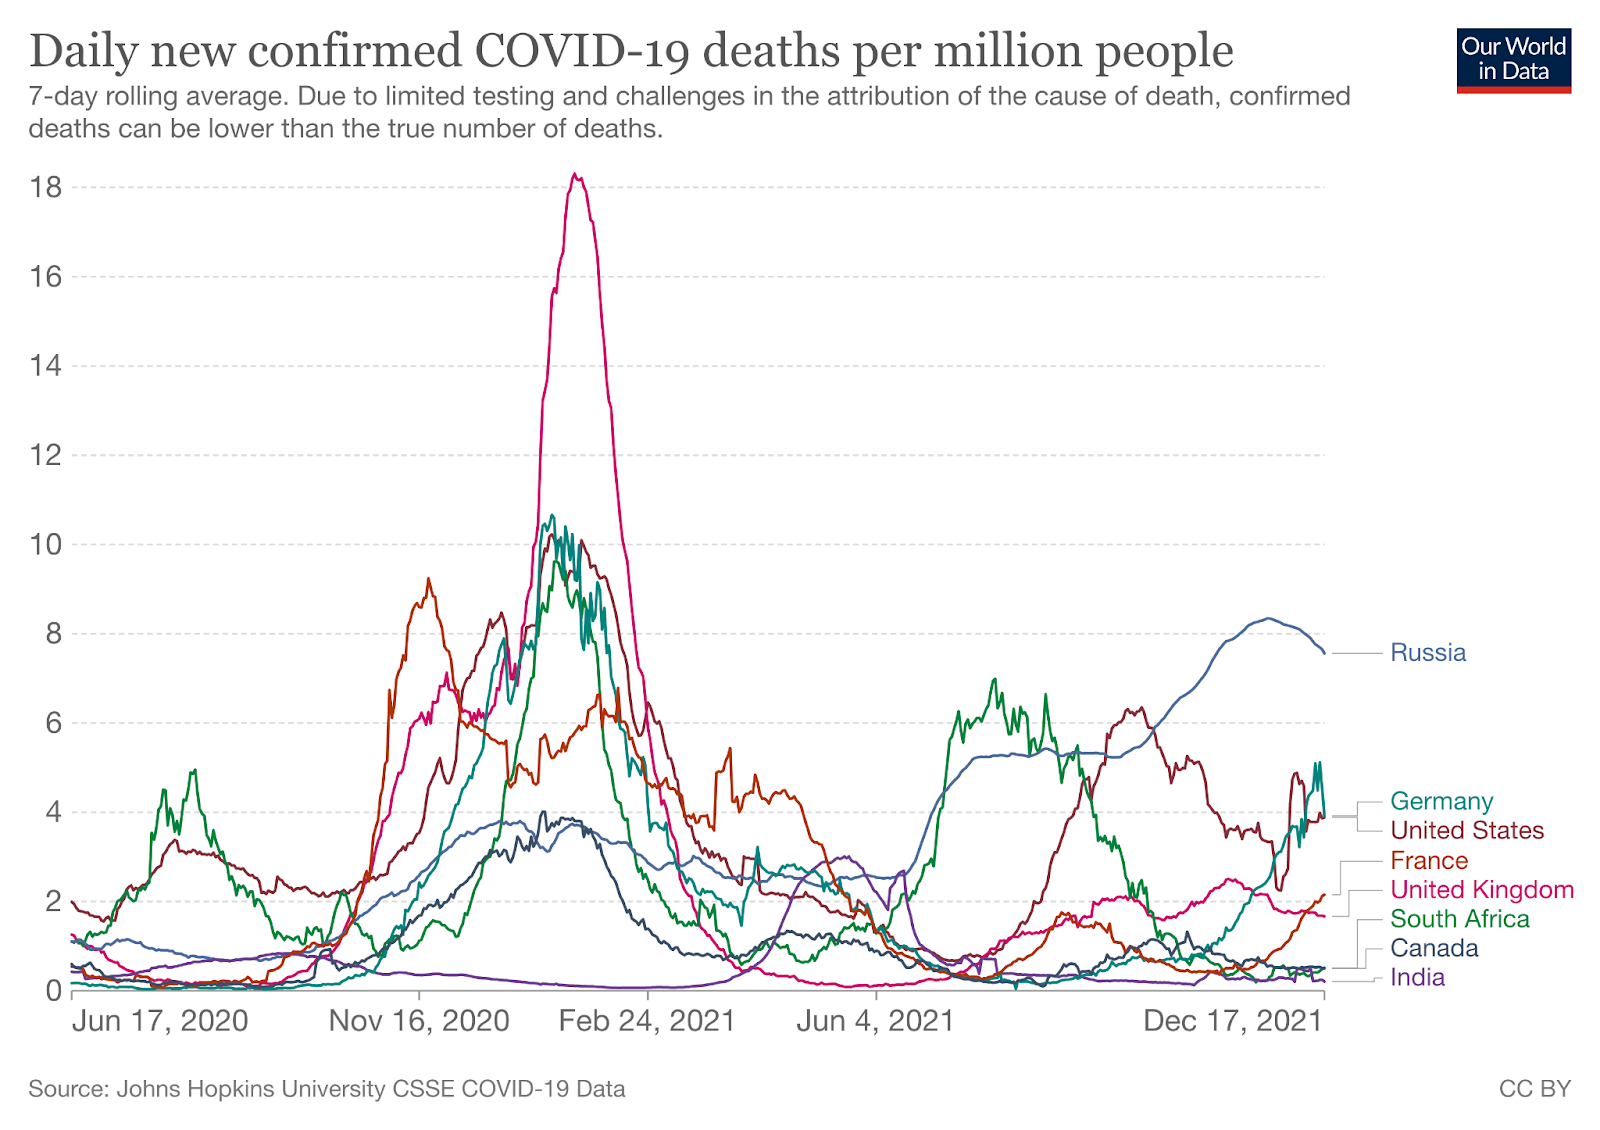
The table below shows that if we rank the US states with the highest death rates per million population within the world rankings, we see that Mississippi has the fifth highest COVID-19 deaths per million in the world. New York, New Jersey and Arizona would be tied at the 9th highest number of deaths per million in the world, followed by Louisiana at 10th, Arkansa at 11th, Arizona, Florida at 12th, Massachusetts and Rhode Island tied at 14th. The United States as a whole ranks 20th in the world for deaths per million population (2,495 deaths per million). California ranks 35th in the USA (and 36th in the world). If we look at the death rates per million in South Korea (89), Iceland (105), Japan (146), and Israel (882), they suggest that treatment outcomes are somehow different in these four countries. The same phenomenon can be seen in Scandinavia, where the death rate in Sweden is 1,491 per million, compared to 219 per million in Norway and 260 per million in Finland. The United States should take a closer look at how countries with low death rates (like South Korea, Iceland, Japan, Finland, and Norway) are preventing COVID-19 infections and treating COVID-19 patients.
| State or Country | COVID-19 Deaths per million population | Rank in USA | Ranked within World |
| Mississippi | 3,479 | 1st | 5th |
| New Jersey | 3,228 | 3rd | 9th tied |
| Louisiana | 3,210 | 5th | 10th |
| New York | 3,033 | 6th | 9th tied |
| Alabama | 3,333 | 2nd | 7th |
| Arizona | 3,227 | 4th | 9th tied |
| Massachusetts | 2,870 | 11th | 14th tied |
| Rhode Island | 2,824 | 13th | 14th tied |
| Arkansas | 2,959 | 7th | 11th |
| Florida | 2,896 | 9th | 12th |
| California | 1,920 | 35th | 36th |
| USA | 2,495 | 20th | |
| Peru | 6,007 | 1st | |
| Bosnia-Herzegovina | 4,036 | 3rd | |
| North Macedonia | 3,741 | 6th | |
| Hungary | 3,899 | 4th | |
| Montenegro | 3,776 | 5th | |
| Bulgaria | 4,356 | 2nd | |
| Gibraltar | 2,969 | 10th | |
| Czechia | 3,264 | 7th | |
| Brazil | 2,875 | 13th | |
| San Marino | 2,762 | 14th | |
| Georgia | 3,261 | 8th | |
| Sweden | 1,491 | 56th | |
| Israel | 882 | 87th | |
| Canada | 785 | 94th | |
| Finland | 260 | 135th | |
| Norway | 219 | 139th | |
| Japan | 146 | 153rd | |
| Iceland | 105 | 163rd | |
| South Korea | 89 | 167th |
A New Drug for SARS-CoV-2 Treatment
Pfizer has developed a reversible inhibitor of C3-like protease of SARS-CoV-2. The drug inhibits this key enzyme that is crucial for virus production. The compound, called Compound 6, is part of the drug combination PAXLOVID™ (PF-07321332; ritonavir), which just successfully completed a Phase 2-3 trial in humans in multiple countries. The preliminary results were announced on 11/5/21 by Pfizer. The results show that 89% of the hospitalizations and deaths were prevented in the drug treatment arm. The drug was administered twice a day for five days. No deaths occurred in the treatment group, and ten deaths occurred in the placebo group. The study was stopped by an independent data safety monitoring board, and the FDA concurred with this decision. Pfizer applied for an Emergency Use Authorization for this drug on 11/15/21. I had anticipated that the drug would be approved in the next 7 days. In my opinion, this agent, if approved, will markedly alter the course of every coronavirus infection throughout the world.
The Threat of SARS-CoV-2 Variants
In response to the need for “easy-to-pronounce and non-stigmatising labels,” at the end of May, the World Health Organization assigned a letter from the Greek alphabet to each SARS-CoV-2 variant. GISAID, Nextstrain, and Pango will continue to use the previously established nomenclature. For our purposes, we’ll be referring to each variant by both its Greek alphabet letter and the Pango nomenclature.
The WHO has sorted variants into two categories: Variants of Concern (VOC) and Variants of Interest (VOI). The criteria for Variants of Concern are as follows:
- Increase in transmissibility or detrimental change in COVID-19 epidemiology; or
- Increase in virulence or change in clinical disease presentation; or
- Decrease in effectiveness of public health and social measures or available diagnostics, vaccines, therapeutics.
The WHO categorizes the following five variants as Variants of Concern (VOC):

Source: World Health Organization
The criteria for Variants of Interest (VOI) are as follows:
- has been identified to cause community transmission/multiple COVID-19 cases/clusters, or has been detected in multiple countries; OR
- is otherwise assessed to be a VOI by WHO in consultation with the WHO SARS-CoV-2 Virus Evolution Working Group.
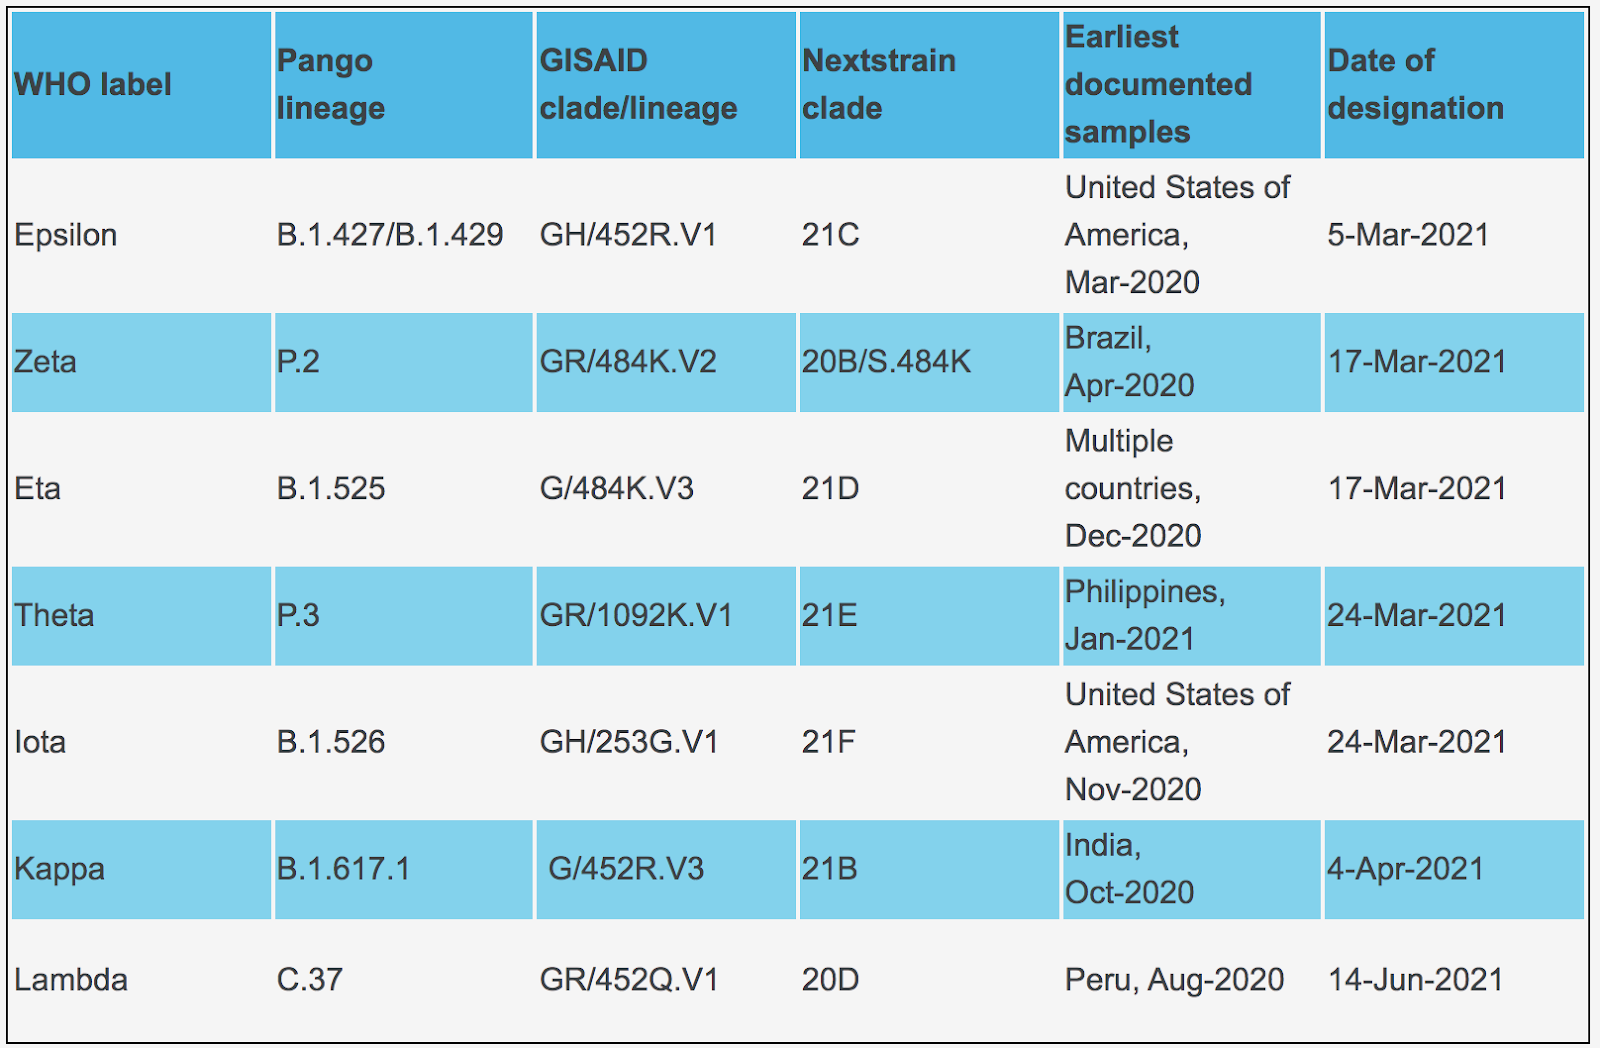
The WHO categorizes the following six variants as Variants of Interest (VOI):
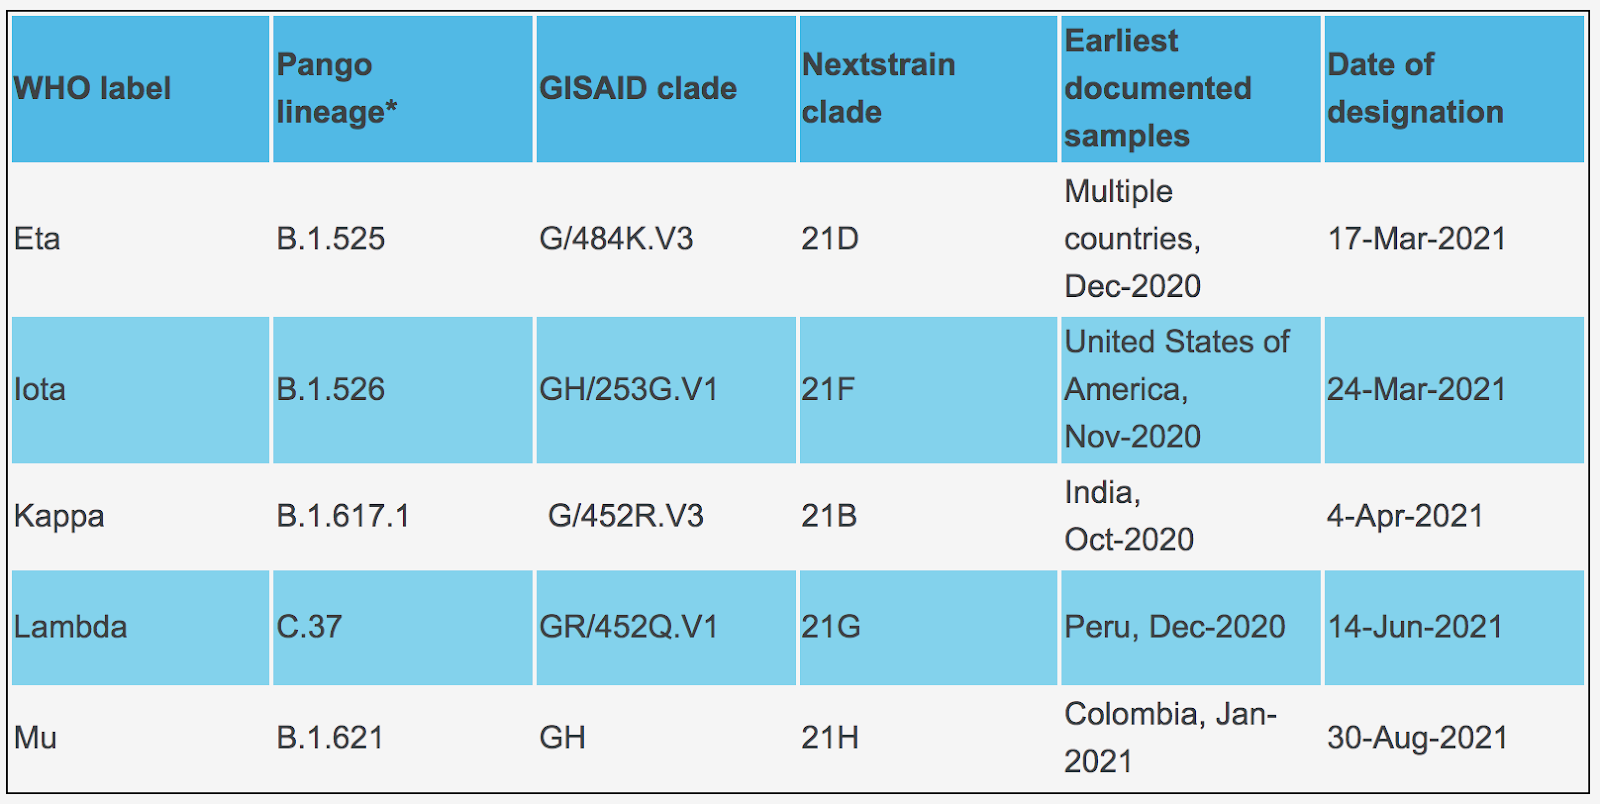
Omicron cases sequenced as of 12/17/21:
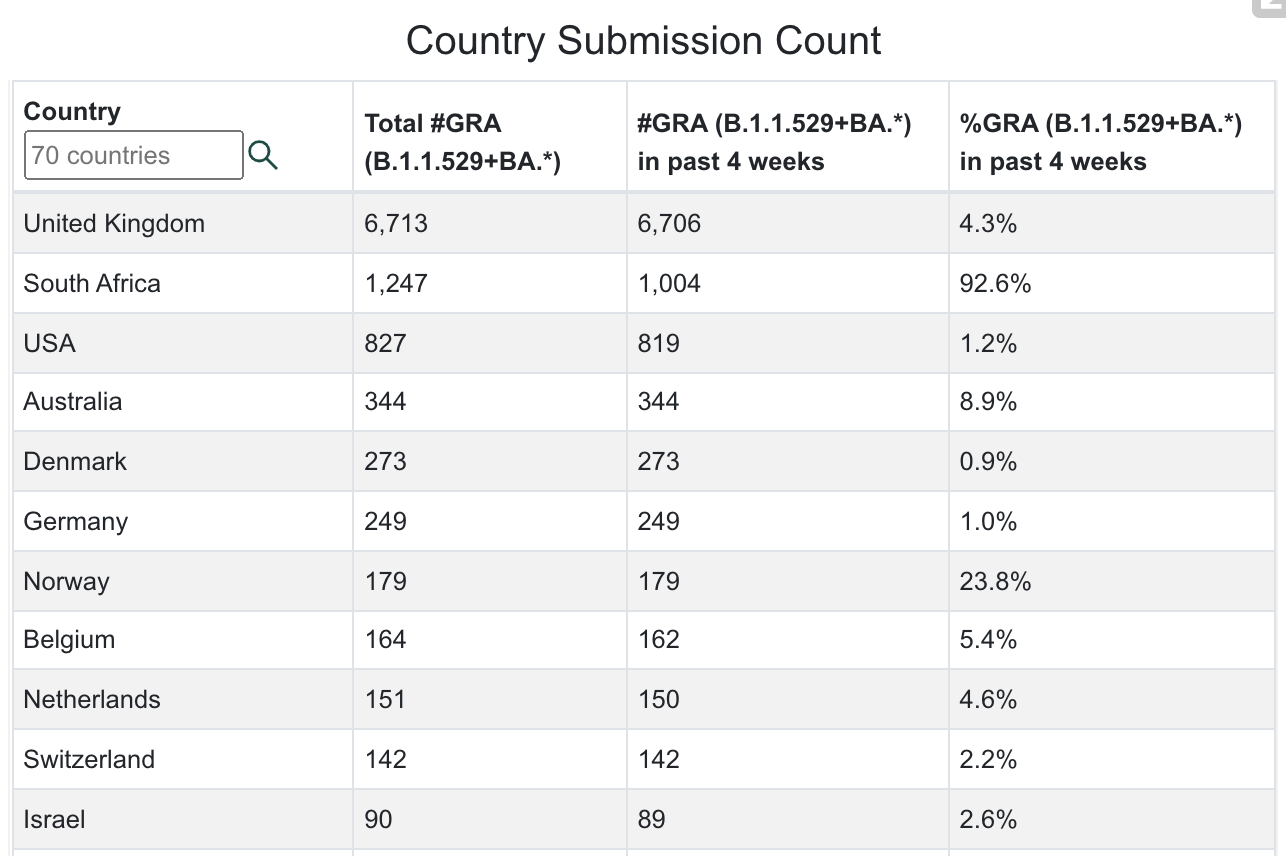
Source: GISAID
Delta cases sequenced as of 12/17/21:
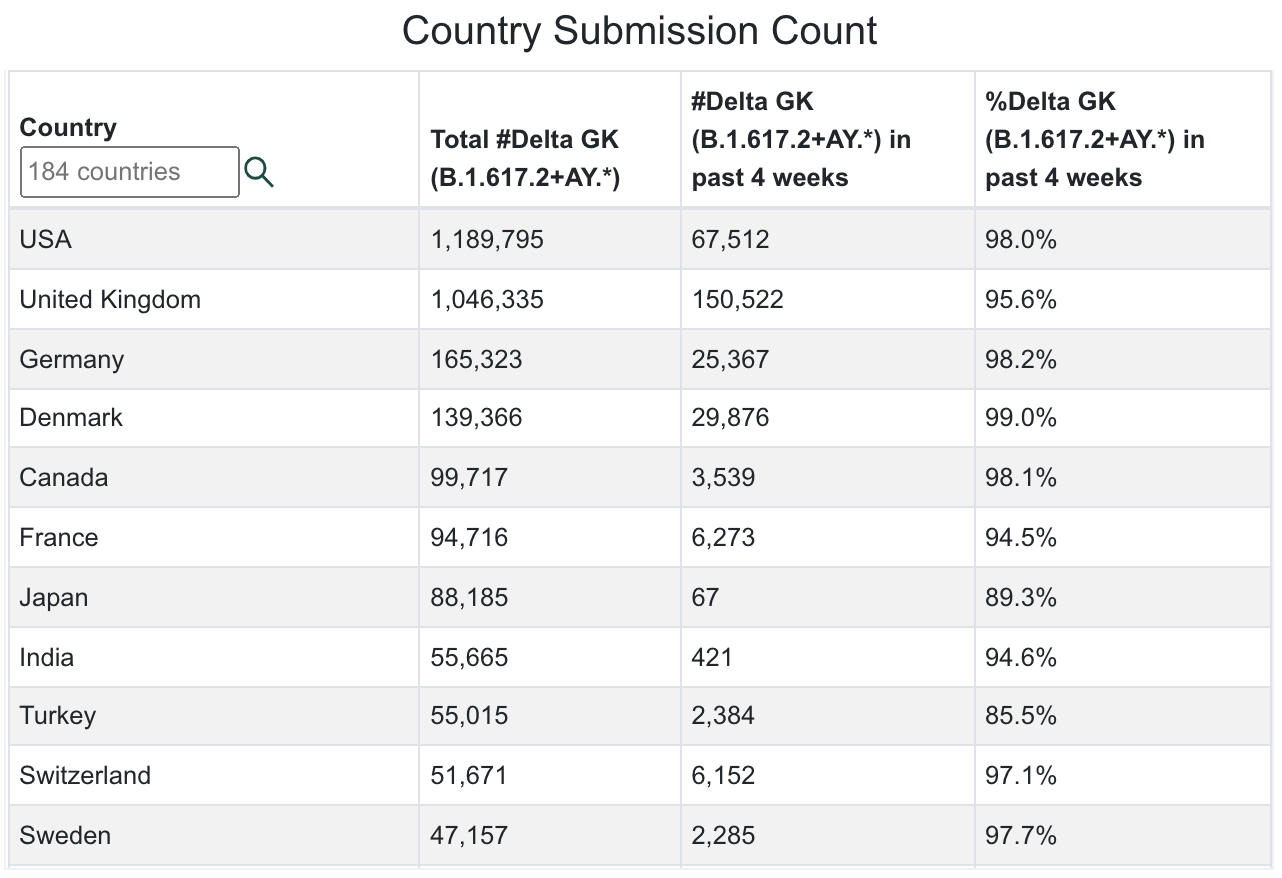
Source: GISAID
Map of Delta sequenced transmissions:
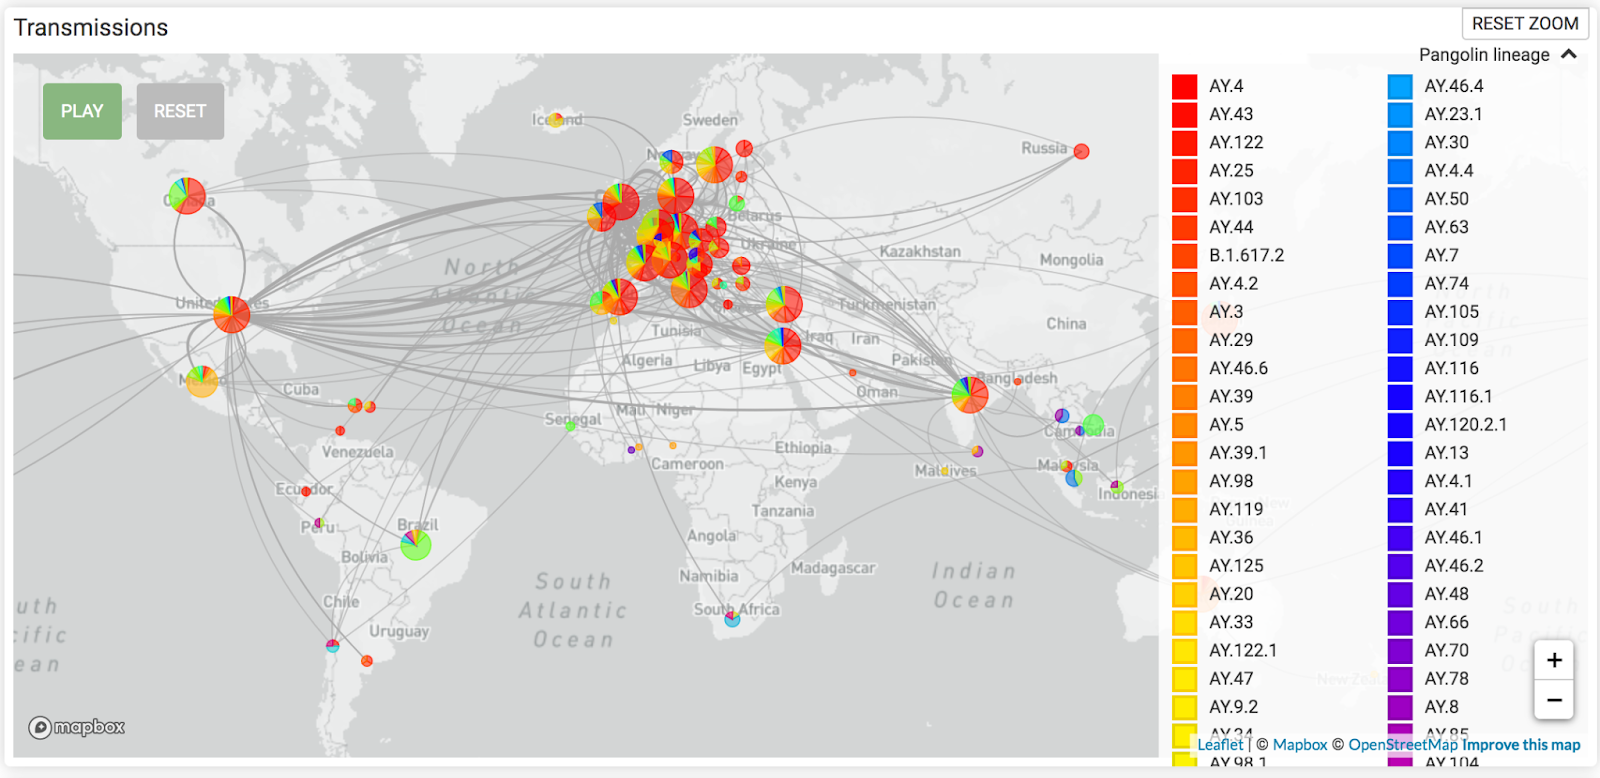
Source: GISAID
B.1.640 cases sequenced as of 12/17/21:
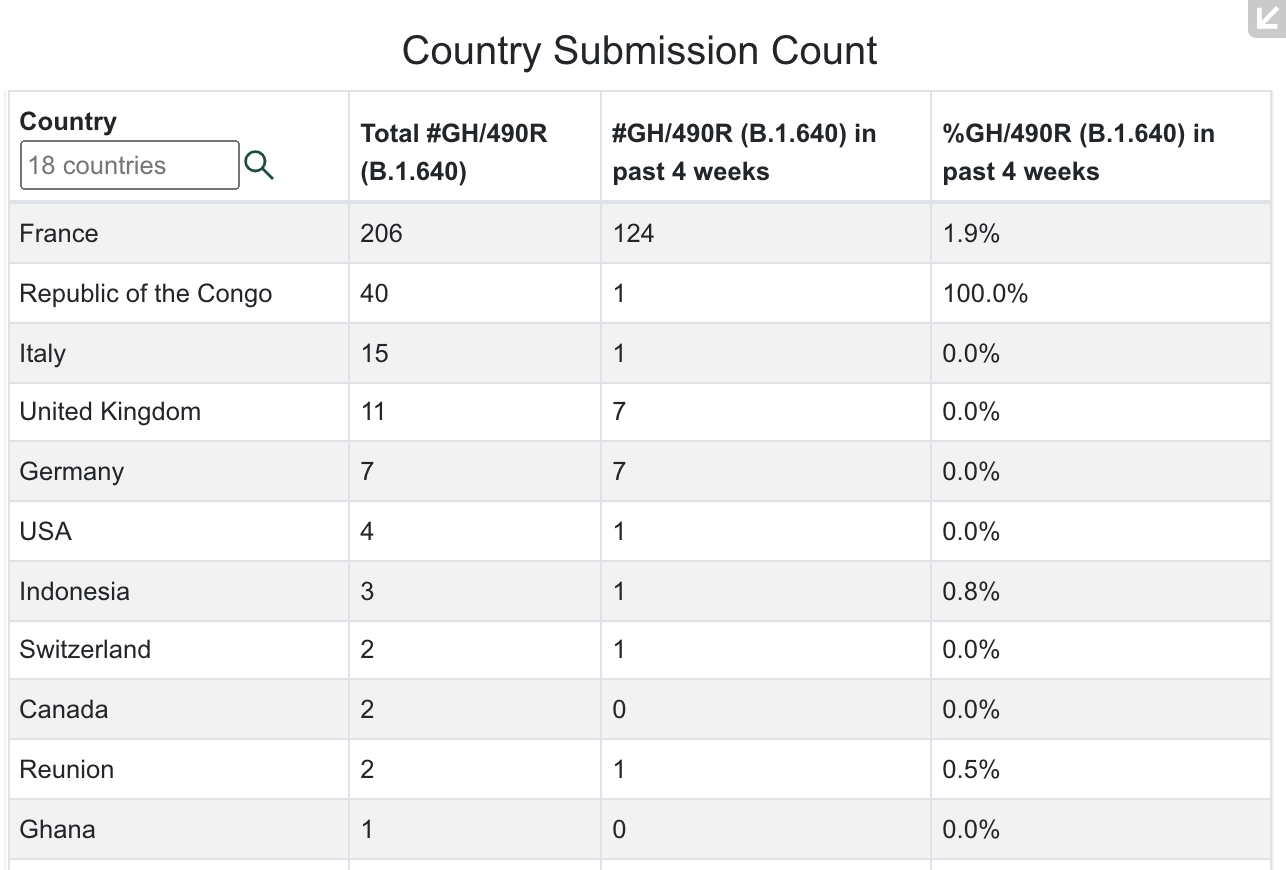
Source: GISAID
Gamma cases sequenced as of 12/17/21:
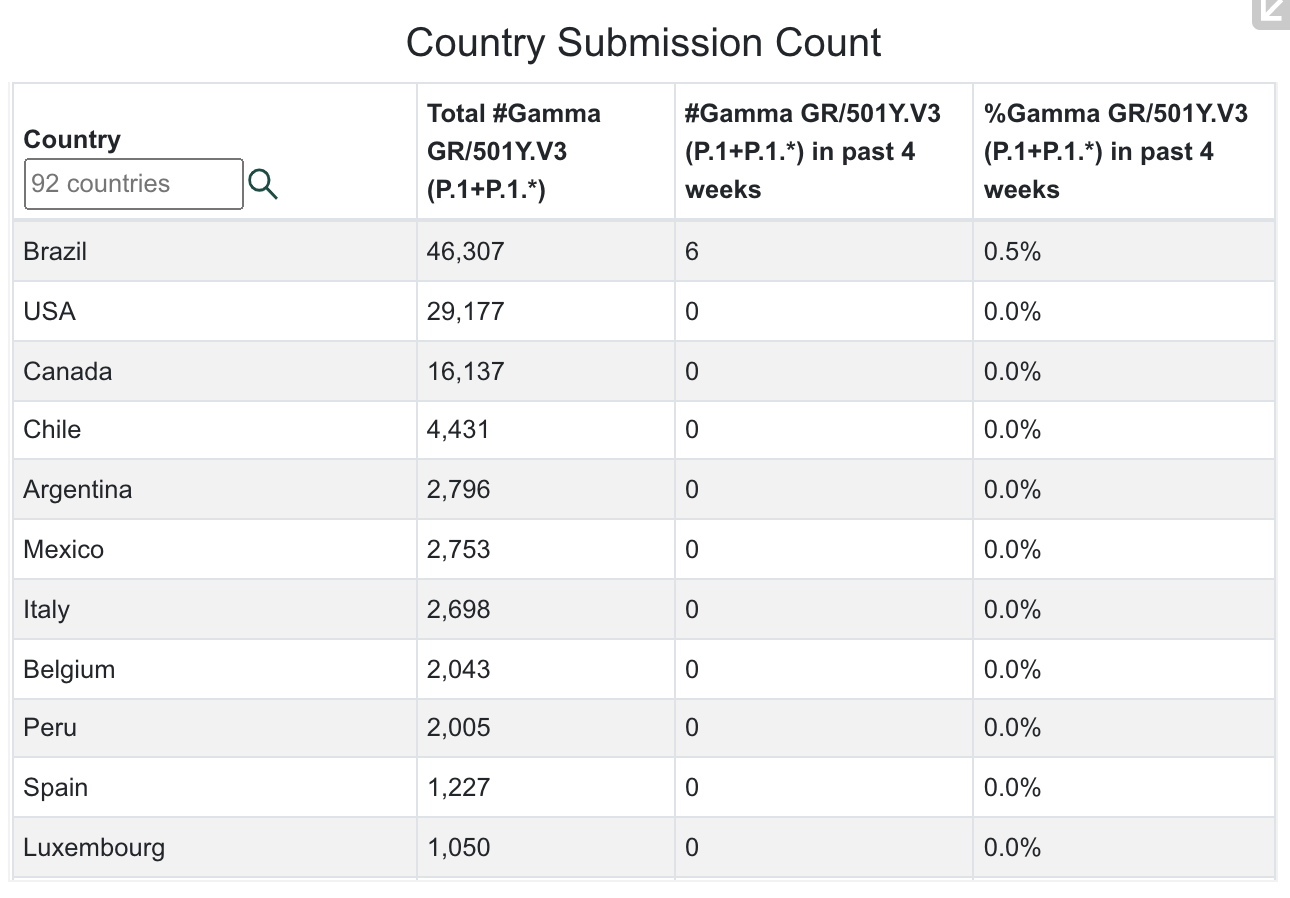
Source: GISAID
Mu cases sequenced as of 12/17/21:
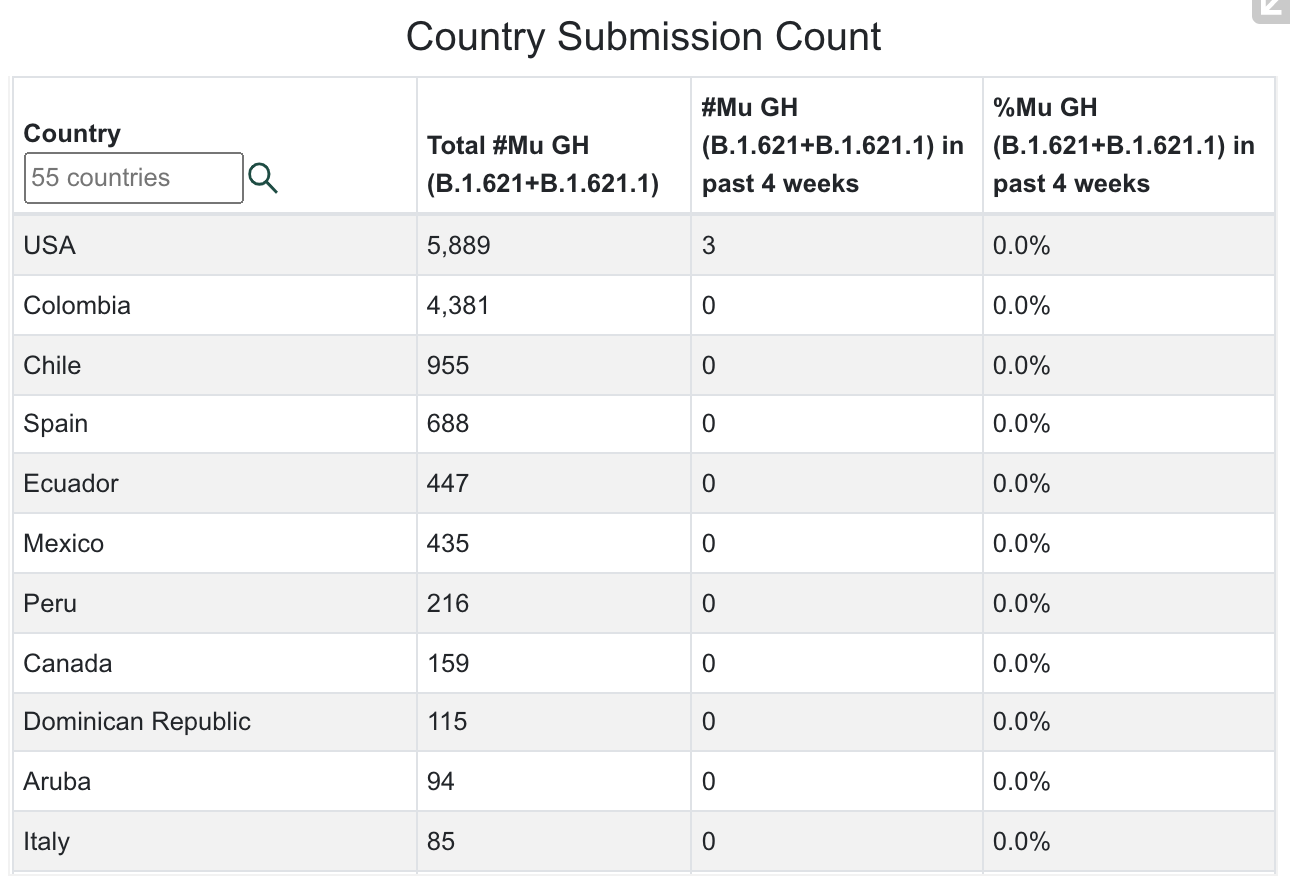
Source: GISAID
Watching World Data
Over the next few months, we’ll be paying close attention to correlations between the SARS-CoV-2 data, the number of isolates identified in various countries and states, and the non-pharmaceutical interventions (like mask mandates and lockdowns) put in place by state and national governments. Data on infections, deaths, and percent of population infected was compiled from Worldometers. Data for this table for SARS-CoV-2 Isolates Currently Known in Location was compiled from GISAID and the CDC. It’s worth noting that GISAID provided more data than the CDC.
| Location | Total Infections as of 12/17/21 | New Infections on 12/17/21 | Total Deaths | New Deaths on 12/17/21 | % of Pop.Infected | SARS-CoV-2 Isolates Currently Known in Location | National/ State Mask Mandate? | Currently in Lockdown? |
| World | 273,960,234(8,798,529 new infections in 14 days). | 730,090 | 5,360,728(102,682 new deaths in last 14 days; | 7,297 | 3.51% | B2 lineageAlpha/B.1.1.7 (UK)Eta/B.1.525 (Nigeria/UK)Iota/B.1.526 (USA-NYC)Beta/B.1.351 (SA)Epsilon/B.1.427 + B.1.429 (USA)*Gamma/P.1 (Brazil)Zeta/P.2 (Brazil)A lineage isolateV01.V2 (Tanzania)APTK India VOC 32421Delta/B.1.617.2 (India)BV-1 (Texas, USA)Kappa/B.1.617.1 (India)Lambda/C.37 (Peru)Theta/P.3 (Philippines) Mu/B.1.621 (Colombia)C.1.2 (South Africa 2% of isolates in July 2021)R1 (Japan)Omicron/B.1.1.529 (South Africa November 2021)B.1.640 (Congo/France) | No | No |
| USA | 51,510,281 (ranked #1) 1,932,232 new infections in the last 14 days) | 163,707 (ranked #1) | 826,719 (ranked #1)18,603 new deaths in the last 14 days) | 1,653 | 15.45% | B2 lineageAlpha/B.1.1.7 (UK)Eta/B.1.525 (Nigeria/UK)Iota/B.1.526 (USA-NYC)Beta/B.1.351 (SA)Epsilon/B.1.427 + B.1.429 (USA)*Gamma/P.1 (Brazil)Zeta/P.2 (Brazil)Delta/B.1.617.2 (India)BV-1 (Texas, USA)Theta/P.3 (Philippines) Theta/P.3 (Philippines) Kappa/B.1.617.1 (India)Lambda/C.37 (Peru)Mu/B.1.621 (Colombia)R1(Japan) Omicron/B.1.1.529 (South Africa November 2021)B.1.640 (Congo/France) | No | No |
| Brazil | 22,209,020(ranked #3) | 4,079 | 617,647(ranked #2) | 126 | 10.34% | B2 lineageAlpha/B.1.1.7 (UK)Beta/B.1.351 (SA)Gamma/P.1 (Brazil)Zeta/P.2 (Brazil)Lambda/C.37 (Peru)Mu/B.1.621 (Colombia) Omicron/B.1.1.529 (South Africa November 2021) | No | No |
| India | 34,732,592(ranked #2) | 6,543 | 476,897(ranked #3) | 38 | 2.48% | B2 lineageAlpha/B.1.1.7 (UK)Beta/B.1.351 (SA)Gamma/P.1 (Brazil)Epsilon/B.1.427 + B.1.429 (USA)*Eta/B.1.525 (Nigeria/UK)APTK India VOI 32421Delta/B.1.617.2 (India)Kappa/B.1.617.1 (India)Iota/B.1.526 (USA-NYC) Omicron/B.1.1.529 (South Africa November 2021)B.1.640 (Congo/France) | No | No |
| United Kingdom | 11,190,354(ranked #4; was #6 sixrteen weeks ago) | 93,045 | 147,048(ranked #7 in world) | 111 | 16.35% | B2 lineageAlpha/B.1.1.7 (UK)Eta/B.1.525 (Nigeria/UK)Beta/B.1.351 (SA)Epsilon/B.1.427 + B.1.429 (USA)*Gamma/P.1 (Brazil)Delta/B.1.617.2 (India)Theta/P.3 (Philippines) Kappa/B.1.617.1 (India)Lambda/C.37 (Peru)Mu/B.1.621 (Colombia)C.1.2 (South Africa)Omicron/B.1.1.529 (South Africa November 2021)B.1.640 (Congo/France) | No | No |
| California, USA | 5,067,329(ranked #14 in world) | 9,125 | 75,935(ranked #20 in world) | 113 | 12.82% | B2 lineageAlpha/B.1.1.7 (UK)Eta/B.1.525 (Nigeria/UK)Beta/B.1.351 (SA)Gamma/P.1 (Brazil)Epsilon/B.1.427 + B.1.429 (USA)*Zeta/P.2 (Brazil)Delta/B.1.617.2 (India)Theta/P.3 (Philippines) Kappa/B.1.617.1 (India)Lambda/C.37 (Peru) Mu/B.1.621 (Colombia) Omicron/B.1.1.529 (South Africa November 2021) | No | No |
| Mexico | 3,927,265(ranked #15) | 2,627 | 297,356(ranked #4) | 169 | 3.00% | B2 lineageAlpha/B.1.1.7 (UK)Epsilon/B.1.427 + B.1.429 (USA)*Gamma/P.1 (Brazil)Delta/B.1.617.2 (India)Kappa/B.1.617.1 (India)Lambda/C.37 (Peru)Mu/B.1.621 (Colombia)Omicron/B.1.1.529 (South Africa November 2021) | No | No |
| South Africa | 3,276,529(ranked #18) Exponential growth of Omicron occurring in South Africa. Children under 5 are infected.Quadrupling of daily infections in last four days. | 20,713 on 12/17/21,16,055 on 12/3/21,11,535 on 12/2/21,8,561 on 12/1/21,4,373 on 11/30/21,789 on 11/19/21339 on 11/5/21 | 90,297 | 35 | 5.42% | B2 lineageAlpha/B.1.1.7 (UK)Beta/B.1.351 (SA)Delta/B.1.617.2 (India)Kappa/B.1.617.1 (India) C.1.2 (South Africa, July 2021)Omicron/B.1.1.529 South Africa, November 2021)B.1.640 (Congo/France) | No | No |
| Canada | 1,864,891(ranked #27) | 6,892 | 30,624 | 12 | 4.87% | B2 lineageAlpha/B.1.1.7 (UK)Eta/B.1.525 (Nigeria/UK)Epsilon/B.1.427 + B.1.429 (USA)*Gamma/P.1 (Brazil)Delta/B.1.617.2 (India)Kappa/B.1.617.1 (India)Lambda/C.37 (Peru)Mu/B.1.621 (Colombia)Omicron/B.1.1.529 (South Africa November 2021)B.1.640 (Congo/France) | Yes, except Alberta Province | No |
| Poland | 3,923,472(ranked #16) | 20,027 | 90,872 | 566 | 10.38% | B2 lineageAlpha/B.1.1.7 (UK)Eta/B.1.525 (Nigeria/UK)Beta/B.1.351 (SA)Delta/B.1.617.2 (India)Mu/B.1.621 (Colombia)Omicron/B.1.1.529 (South Africa November 2021) | No | No |
| Turkey | 9,136,565(ranked #6) | 18,141 | 80,053 | 190 | 10.66% | B2 lineageAlpha/B.1.1.7 (UK)Eta/B.1.525 (Nigeria/UK)Beta/B.1.351 (SA)Epsilon/B.1.427 + B.1.429 (USA)*Gamma/P.1 (Brazil)Lambda/C.37 (Peru)Mu/B.1.621 (Colombia)Omicron/B.1.1.529 (South Africa November 2021) | No | No |
| Russia | 10,159,389(ranked #5) | 27,743 | 295,104(ranked #5 in world) | 1,080 | 6.95% | B2 lineageAlpha/B.1.1.7 (UK)Beta/B.1.351 (SA)Delta/B.1.617.2 (India)R1(Japan) B.1.640 (Congo/France)Omicron/B.1.1.529 (South Africa November 2021) | No | No |
| Argentina | 5,382,290(ranked #11) | 5,648 | 116,892 | 18 | 11.75% | B2 lineageAlpha/B.1.1.7 (UK)Eta/B.1.525 (Nigeria/UK)Beta/B.1.351 (SA)Epsilon/B.1.427 + B.1.429 (USA)*Gama/P.1 (Brazil)Delta/B.1.617.2 (India)Lambda/C.37 (Peru)Omicron/B.1.1.529 (South Africa November 2021) | No | No |
| Colombia | 5,103,269(ranked #13) | 1,803 | 129,345 | 50 | 9.87% | B2 lineageAlpha/B.1.1.7 (UK)Beta/B.1.351 (SA)Gamma/P.1 (Brazil)Epsilon/B.1.427 + B.1.429 (USA)*Iota/B.1.526 (USA-NYC)Lambda/C.37 (Peru)Mu/B.1.621 (Colombia) | No | No |
| Peru | 2,269,180(ranked #23) | ——– | 202,076(ranked #6) | ——- | 6.71% | B2 lineageAlpha/B.1.1.7 (UK)Delta/B.1.617.2 (India)Gamma/P.1 (Brazil)Iota/B.1.526 (USA-NYC)Lambda/C.37 (Peru)Mu/B.1.621 (Colombia) | No | No |
| Indonesia | 4,260,148(ranked #14) | 291 | 143,986 | 7 | 1.53% | B2 lineageAlpha/B.1.1.7 (UK)Delta/B.1.617.2 (India)Beta/B.1.351 (SA)Eta/B.1.525 (Nigeria/UK)Theta/P.3 (Philippines) Iota/B.1.526 (USA-NYC)Kappa/B.1.617.1 (India)B.1.640 (Congo/France)Omicron/B.1.1.529 (South Africa November 2021) | No | No |
| Iran | 6,157,650(ranked 9th; was 12th sixteen weeks ago) | 2,196 | 130,992 | 46 | 7.20% | B2 lineageAlpha/B.1.1.7 (UK)Delta/B.1.617.2 (India)Beta/B.1.351 (SA) | No | No |
| Spain | 5,455,527(ranked 10th) | 33,359 | 88,708 | 41 | 11.66% | B2 lineageAlpha/B.1.1.7 (UK)Delta/B.1.617.2 (India)Beta/B.1.351 (SA)Gamma/P.1 (Brazil)Epsilon/B.1.427 + B.1.429 (USA)*Eta/B.1.525 (Nigeria/UK)Iota/B.1.526 (USA-NYC)Kappa/B.1.617.1 (India)Mu/B.1.621 (Colombia)Omicron/B.1.1.529 South Africa November 2021)B.1.640 (Congo/France) | No | No |
What Our Team Is Reading This Week
- Risk assessment for SARS-CoV-2 variant: Omicron VOC-21NOV-01 (B.1.1.529) (UK Health Security Agency) https://assets.publishing.service.gov.uk/government/uploads/system/uploads/attachment_data/file/1041896/15-december-2021-risk-assessment-for-SARS_Omicron_VOC-21NOV-01_B.1.1.529.pdf
- HKUMed finds Omicron SARS-CoV-2 can infect faster and better than Delta in human bronchus but with less severe infection in lung https://www.med.hku.hk/en/news/press/20211215-omicron-sars-cov-2-infection
- mRNA-based COVID-19 vaccine boosters induce neutralizing immunity against SARS-CoV-2 Omicron variant (Preprint) https://www.medrxiv.org/content/10.1101/2021.12.14.21267755v1/
- “Breakthrough” COVID-19 Hospitalizations Among Fully Vaccinated Patients Occur Most Often among Older Adults and Involve People with Chronic Health Conditions (KFF) https://www.kff.org/coronavirus-covid-19/press-release/breakthrough-covid-19-hospitalizations-among-fully-vaccinated-patients-occur-most-often-among-older-adults-and-involve-people-with-chronic-health-conditions/
- https://www.discovery.co.za/corporate/news-room#/documents/press-release-dot-pdf-417948
- SARS-CoV-2 variants of concern and variants under investigation in England, Technical Briefing 31 https://assets.publishing.service.gov.uk/government/uploads/system/uploads/attachment_data/file/1040076/Technical_Briefing_31.pdf
- Minimal cross-over between mutations associated with Omicron variant of SARS-CoV-2 and CD8+ T cell epitopes identified in COVID-19 convalescent individuals (Preprint) https://www.biorxiv.org/content/10.1101/2021.12.06.471446v1
- COVID-19 vaccines dampen genomic diversity of SARS-CoV-2: Unvaccinated patients exhibit more antigenic mutational variance (Preprint) https://www.medrxiv.org/content/10.1101/2021.07.01.21259833v1
- SARS-CoV-2 B.1.1.529 variant (Omicron) evades neutralization by sera from vaccinated and convalescent individuals (Preprint) https://www.medrxiv.org/content/10.1101/2021.12.08.21267491v1
- Myocarditis after Covid-19 Vaccination in a Large Health Care Organization (NEJM) https://www.nejm.org/doi/full/10.1056/NEJMoa2110737
- Myocarditis after BNT162b2 mRNA Vaccine against Covid-19 in Israel (NEJM) https://www.nejm.org/doi/full/10.1056/NEJMoa2109730
- Efficacy and Safety of NVX-CoV2373 in Adults in the United States and Mexico (NEJM) https://www.nejm.org/doi/full/10.1056/NEJMoa2116185
- Immune correlates analysis of the mRNA-1273 COVID-19 vaccine efficacy clinical trial (Science) https://www.science.org/doi/10.1126/science.abm3425
- Dissecting the early COVID-19 cases in Wuhan (Science) https://www.science.org/doi/10.1126/science.abm4454
- Neutralising antibody titres as predictors of protection against SARS-CoV-2 variants and the impact of boosting: a meta-analysis (The Lancet) https://doi.org/10.1016/S2666-5247(21)00267-6
- An oral SARS-CoV-2 Mpro inhibitor clinical candidate for the treatment of COVID-19 (Science) https://doi.org/10.1126/science.abl4784
- Pfizer’s Novel Covid-19 Oral Antiviral Treatment Candidate Reduced Risk Of Hospitalization Or Death By 89% In Interim Analysis Of Phase 2/3 Epic-Hr Study https://www.pfizer.com/news/press-release/press-release-detail/pfizers-novel-covid-19-oral-antiviral-treatment-candidate
- The county’s indoor mask mandate is triggered: masks will be required starting Nov. 5. (Monterey County Weekly) https://www.montereycountyweekly.com/blogs/news_blog/the-countys-indoor-mask-mandate-is-triggered-masks-will-be-required-starting-nov-5/article_1c375fd4-3b54-11ec-9dd8-d3ac853c92cc.html
- Community transmission and viral load kinetics of the SARS-CoV-2 delta (B.1.617.2) variant in vaccinated and unvaccinated individuals in the UK: a prospective, longitudinal, cohort study (The Lancet) https://www.thelancet.com/journals/laninf/article/PIIS1473-3099(21)00648-4/fulltext
- “Vaccination reduces the risk of delta variant infection and accelerates viral clearance. Nonetheless, fully vaccinated individuals with breakthrough infections have peak viral load similar to unvaccinated cases and can efficiently transmit infection in household settings, including to fully vaccinated contacts. Host–virus interactions early in infection may shape the entire viral trajectory.”
- Early Treatment for Covid-19 with SARS-CoV-2 Neutralizing Antibody Sotrovimab (NEJM) https://www.nejm.org/doi/full/10.1056/NEJMoa2107934
- COVID vaccine makers brace for a variant worse than Delta (Nature) https://www.nature.com/articles/d41586-021-02854-3
- SARS-CoV-2 variants of concern and variants under investigation in England Technical briefing 27 https://assets.publishing.service.gov.uk/government/uploads/system/uploads/attachment_data/file/1029715/technical-briefing-27.pdf
- SARS-CoV-2 variants of concern and variants under investigation in England Technical briefing 26 https://assets.publishing.service.gov.uk/government/uploads/system/uploads/attachment_data/file/1028113/Technical_Briefing_26.pdf
- Heterologous SARS-CoV-2 Booster Vaccinations – Preliminary Report (Preprint) https://doi.org/10.1101/2021.10.10.21264827
- An objective systematic comparison of the most common adverse events of COVID-19 vaccines (Preprint) https://doi.org/10.1101/2021.10.11.21264830
- LSU Health Shreveport has discovered a new variant of COVID-19 in Louisiana (Shreveport Times) https://www.shreveporttimes.com/story/news/local/2021/10/13/new-covid-variant-reported-louisiana-lsu-health/8437214002/
- Waning Immune Humoral Response to BNT162b2 Covid-19 Vaccine over 6 Months (NEJM) https://www.nejm.org/doi/full/10.1056/NEJMoa2114583
- Pandemics Throughout History (Frontiers in Microbiology) https://dx.doi.org/10.3389%2Ffmicb.2020.631736
- A novel B.1.1.523 SARS-CoV-2 variant that combines many spike mutations linked to immune evasion with current variants of concern (Preprint) https://www.biorxiv.org/content/10.1101/2021.09.16.460616v1
- Pediatric COVID-19 Cases in Counties With and Without School Mask Requirements — United States, July 1–September 4, 2021 (MMWR) http://dx.doi.org/10.15585/mmwr.mm7039e3
- Association Between K–12 School Mask Policies and School-Associated COVID-19 Outbreaks — Maricopa and Pima Counties, Arizona, July–August 2021 (MMWR) http://dx.doi.org/10.15585/mmwr.mm7039e1
- Distribution of SARS-CoV-2 Variants in a Large Integrated Health Care System — California, March–July 2021 (MMWR) http://dx.doi.org/10.15585/mmwr.mm7040a4
- Charlson Comorbidity Index (CCI) https://www.mdcalc.com/charlson-comorbidity-index-cci
- Decreased Incidence of Infections Caused by Pathogens Transmitted Commonly Through Food During the COVID-19 Pandemic — Foodborne Diseases Active Surveillance Network, 10 U.S. Sites, 2017–2020 (MMWR) http://dx.doi.org/10.15585/mmwr.mm7038a4
- Will Covid Overwhelm Our Vaccines? (Forbes) https://www.forbes.com/sites/williamhaseltine/2021/10/08/will-covid-overwhelm-our-vaccines/?sh=29b94be17cff
- Anti-Covid Drugs Are Coming, But At What Cost? (Forbes) https://www.forbes.com/sites/williamhaseltine/2021/10/08/anti-covid-drugs-are-coming-but-at-what-cost/?sh=7add6fa377a1
- Safety and Efficacy of NVX-CoV2373 Covid-19 Vaccine (NEJM) https://www.nejm.org/doi/full/10.1056/NEJMoa2107659
- Phase 3 Safety and Efficacy of AZD1222 (ChAdOx1 nCoV-19) Covid-19 Vaccine (NEJM) https://www.nejm.org/doi/full/10.1056/NEJMoa2105290?query=featured_coronavirus
- Mix-and-match COVID vaccines trigger potent immune response (Nature) https://www.nature.com/articles/d41586-021-01359-3
- Is the R.1 variant in the Bay Area? What to know about the highly mutated COVID strain (SF Chronicle) https://www.sfchronicle.com/health/article/Is-the-R-1-variant-in-the-Bay-Area-What-to-know-16483185.php
- Closest known relatives of virus behind COVID-19 found in Laos (Nature) https://www.nature.com/articles/d41586-021-02596-2
- Children of America, You’ve Been Gaslit at Lunchtime (Psychology Today) https://www.psychologytoday.com/us/blog/compassion-works/202109/children-america-you-ve-been-gaslit-lunchtime
- Who’s dying in California from COVID-19? (CalMatters) https://calmatters.org/health/coronavirus/2021/09/covid-california-deaths/
- The continuous evolution of SARS-CoV-2 in South Africa: a new lineage with rapid accumulation of mutations of concern and global detection (Preprint) https://www.medrxiv.org/content/10.1101/2021.08.20.21262342v1.full
- Is This The Next Variant Of Concern— C.1.2? (Haseltine for Forbes) https://www.forbes.com/sites/williamhaseltine/2021/09/03/is-this-the-next-variant-of-concern–c12/?sh=2860a8094680
- Personal protective equipment does not sufficiently protect against virus aerosol unless combined with advanced air purification or ventilation techniques | medRxiv https://www.medrxiv.org/content/10.1101/2021.09.02.21263008v1
- Israel’s home COVID-19 tests keep 180,000 students in school – Israel News – Haaretz.com https://www.haaretz.com/israel-news/.premium-israel-s-home-covid-19-tests-keep-180-000-students-in-school-1.10182409
- JCI – The autoimmune signature of hyperinflammatory multisystem inflammatory syndrome in children https://www.jci.org/articles/view/151520
- Patterns of SARS-CoV-2 aerosol spread in typical classrooms – ScienceDirect https://www.sciencedirect.com/science/article/pii/S0360132321005680
- Starr, T.N., Czudnochowski, N., Liu, Z. et al. SARS-CoV-2 RBD antibodies that maximize breadth and resistance to escape. Nature 597, 97–102 (2021). https://doi.org/10.1038/s41586-021-03807-6


You must be logged in to post a comment.