In 2023 our Covid-19 infection problems are being caused by XBB recombinant variants and still some BA.5 sub-variants BQ.1 and BQ.1.1. The Omicron BA.5 bivalent vaccine has had no effect on the immune evading BQ variants or XBB recombinant variants. In December the first highly infectious recombinant variant, XBB, began spreading around the world. Since then the XBB variant XBB.1.5, has rapidly spread across the country and the world. Another variant, CH.1.1 (BA.2.75.3.4.1.1.1.1) caused 5.9% of infections in the world from December 25 to January 14, 2023 and, from December 26 to January 1, 19.5% of infections in the United Kingdom. CH.1.1 has not become a predominant isolate in the USA. We follow all UK Technical bulletins and the 51st was released March 10, 2023.
In UK testing XBB.1.5 has a significant growth advantage over BQ and CH.1.1 isolates and has dominated infections in the USA. The new variant XBB.1.9.1 has a 15% growth advantage over XBB.1.5 (see Table 8 from UK Technical Bulletin 51 below). Whether an XBB.1.5 infection will provide any protection against other variants like XBB.1.9.1 is currently unknown. On January 13, the World Health Organization (WHO) updated its recommendations on mask wearing to specify that, given the global spread of COVID-19, masks should be worn “irrespective of the local epidemiological situation,” meaning that masks are now recommended for everyone, not just people in areas with high levels of transmission.
XBB.1.5 Variant Continues to Dominate in the United States
During the week ending in 4/07/23, the CDC estimates that based on genomic surveillance, XBB.1.5 accounted for 88.3% of infections, XBB.1.9.1 at 5.1% of infections, BQ.1.1 1.4% of infections, XBB.1.5.1 2.4% of infections, XBB at 1.9% of infections, followed by BQ.1 at 0.2%,, CH.1.1 at 0.4% and BA.2 at 0.1%. Variant XBB.1.9.1, unlike all other variants tested (UK Technical Bulletin 51), has a 15% growth advantage over XBB.1.5.
What happens next? History shows us that the variant with the most significant growth rate advantage will be the next dominant variant. Our bet is still on XBB.1.9.1.
The following is a quote from a recent paper by Madison Stoddard et al.: “At its heart, the problem is one of risk management-plausible risks do not need to be inevitable in order to warrant mitigation. In his book “The Black Swan”, a classic in the risk-management community, author Nassim Nicholas Talib describes a type of event known as a Grey Swan – a rare and highly consequential event that, unlike absolutely unforeseen Black Swan events, can be expected. Our work here shows that ahistorical and potentially destabilizing mortality events as a result of the COVID-19 pandemic are Grey Swans, very much within the realm of the possible. In this paper, we describe one mechanism by which this can occur-antigenic shift (a sudden jump in immune evasion) leading to a reversion to a higher death rate. Such an event, if it were to happen, would not only have been predictable, but can occur repeatedly in the absence of further corrective measures.”
We’re asking people to take those corrective measures; be respiratorily safe by wearing an N95 mask, avoiding in-person gatherings, and improving ventilation. This is the only way to prevent a possible Gray Swan event.
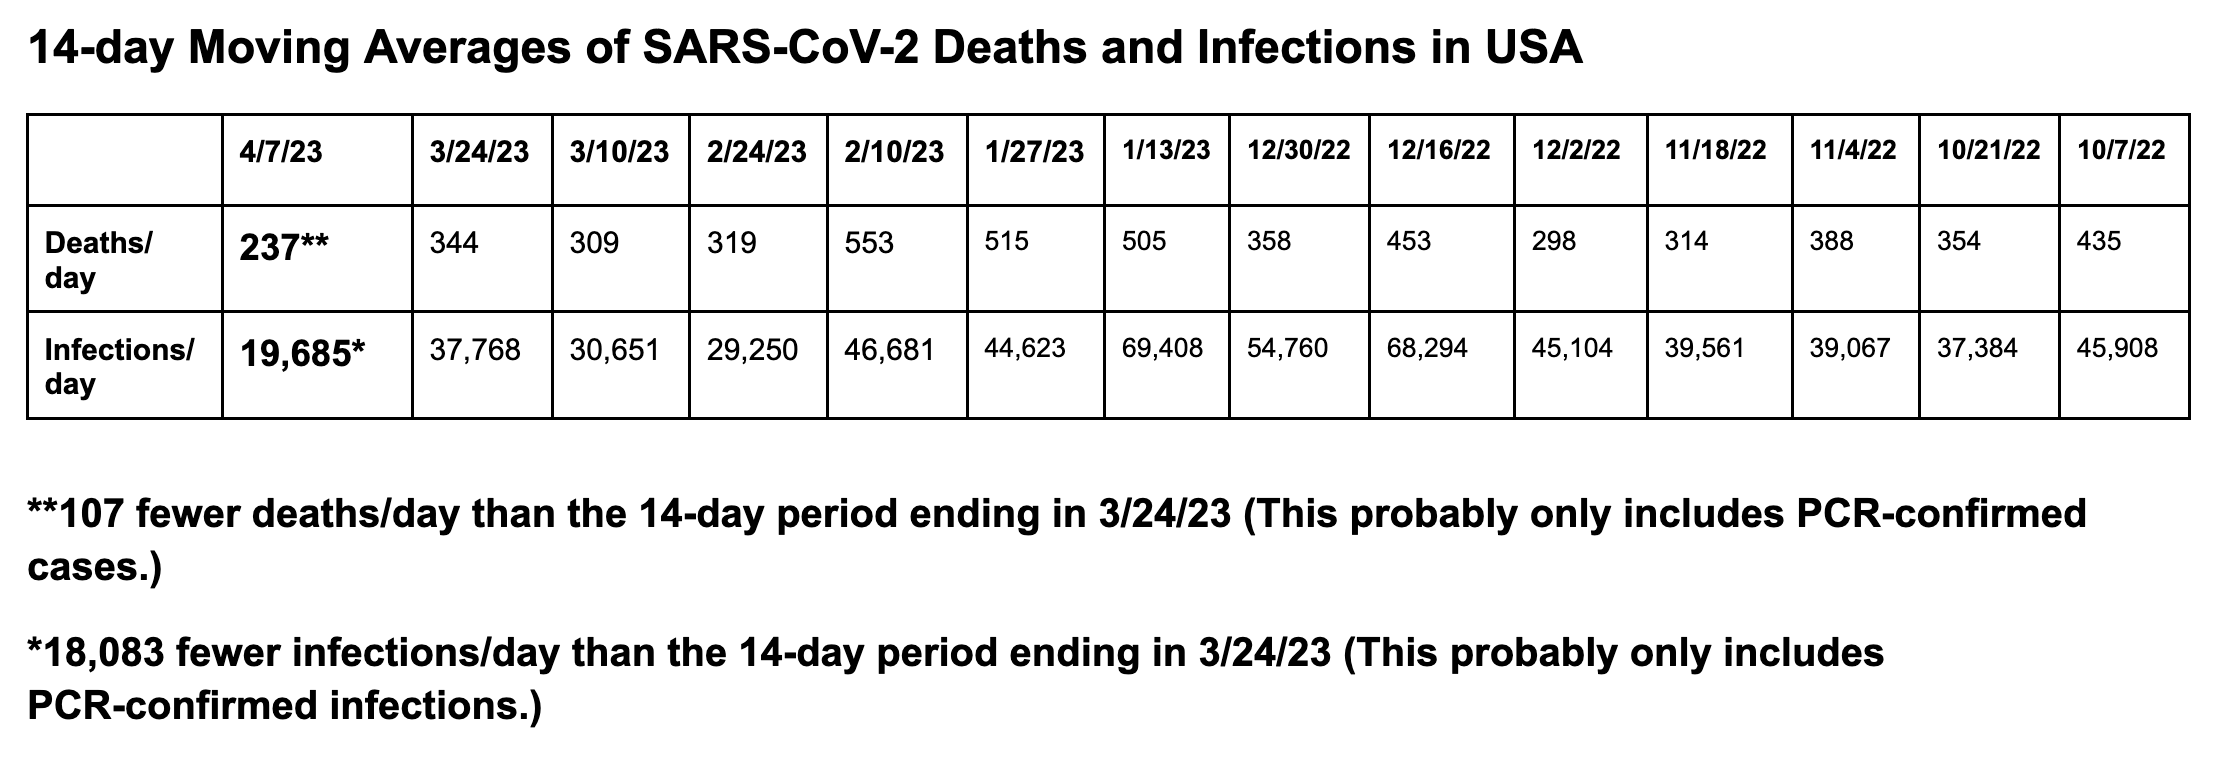
U.S. COVID Data
Here are our 14-day moving average determinations for SARS-CoV-2 for the United States. We use the WORLDOMETERS aggregators data set to make any projections since it includes data from the Department of Veterans Affairs, the U.S. Military, federal prisons and the Navajo Nation.
On 4/07/23, the United States had 3,301 documented new infections. There were also 46 deaths. Forty-three states and the District of Columbia did not report their infections, and 44 states and the District of Columbia and Puerto Rico didn’t report their deaths.
In the United States on 4/3/23 the number of hospitalized patients (5,673) had decreased (-6% compared to the previous 14 days). On 4/3/23 there were 2,678 patients who were seriously or critically ill. Patients are still dying each day (average 237/day, the last 14 days).
As of 4/07/23, we have had 1,156,896 deaths and 106,363,426 SARS-CoV-2 infections in the United States. We have had at least 275,591 new infections in the last 14 days. We are adding an average of 137,795 new infections every seven days. For the pandemic in the United States we are averaging one death for every 91.94 infections or over 10,876 deaths for each one million infections. As of 4/7/23, thirty-nine states have had greater than 500,000 total infections, and 39 states and Puerto Rico have had greater than 5,000 total deaths. Forty-seven states and Puerto Rico have had greater than 2,000 deaths. Only Vermont has had less than a thousand deaths (910 deaths). As of 4/7/23, 14 states have over 4,000 deaths per million population: Arizona (4,569, Mississippi (4,509), West Virginia (4,488), New Mexico (4,362), Arkansas (4,328, unchanged in 2 weeks), Alabama (4,310), Tennessee (4,294), Michigan (4,258), Kentucky (4,107), New Jersey (4,063), Florida (4,057, unchanged in 2 weeks), Louisiana (4,060), Georgia (4,013) and Oklahoma (4,041). Eighteen states (Alabama, Virginia, Missouri, North Carolina, Indiana, Tennessee, Massachusetts, Ohio, Michigan, Georgia, Illinois, New Jersey, Pennsylvania, Florida, Texas, New York, Arizona and California) have had greater than 20,000 deaths. Nine states have had greater than 40,000 deaths: Florida (87,141 deaths, unchanged in 2 weeks), Texas (94,126 deaths), New York (77,460 deaths), Pennsylvania (50,623 deaths, unchanged in 2 weeks), Georgia (42,608 deaths), Ohio (41,973 deaths), Illinois (41,758 deaths), Michigan (42,523), and California (102,043 deaths, 18th most deaths in the world).
On 11/20/20, there were 260,331 (cumulative) deaths in the US from SARS-CoV-2. Since 11/20/20 (28 months), there were 889,785 new deaths from SARS-CoV-2. For twenty-four of those months, vaccines have been available to all adults. During these twenty-four months, 584,697 people have died of SARS-CoV-2 infections. Clearly, a vaccine-only approach is not working anywhere, especially not in the United States. In addition to getting more people vaccinated, most of the hospitalizations and deaths could have been prevented by proper masking (N95 or better), social distancing, and treatment with oral antiviral agents like Paxlovid. We recommend all of these precautions and treatments to every patient in our clinic, and we have only lost one patient to COVID-19 in 3 years.
As of 4/07/23, California was ranked 31st in the USA in infection percentage at 30.83%. In California, 26.86% of the people were infected in the last 23 months. As of 4/07/23, 33 states have had greater than 30% of their population infected. Fifty states, the District of Columbia and Puerto Rico have greater than 20% of their population infected.
Watching World Data
Over the next few months, we’ll be paying close attention to correlations between the SARS-CoV-2 data, the number of isolates identified in various countries and states, and the non-pharmaceutical interventions (like mask mandates and lockdowns) put in place by state and national governments. Data on infections, deaths, and percent of population infected was compiled from Worldometers. Data for this table for SARS-CoV-2 Isolates Currently Known in Location was compiled from GISAID and the CDC. It’s worth noting that GISAID provided more data than the CDC.
| Location | Total Infections as of 4/07/23 | New Infections on 4/07/23 | Total Deaths | New Deaths on 4/07/23 | % of Pop.Infected | SARS-CoV-2 Isolates Currently Known in Location | National/ State Mask Mandate | Currently in Lockdown |
| World | 684,875,187(1,678,217 new infections in the last 14 days with an average of 119,878 infections per day). | 53,552 | 6,837,511(11,210 new deaths in the last 14 days with an average of 801 deaths per day.) | 220 | 8.79% | B2 lineageAlpha/B.1.1.7 (UK)Eta/B.1.525 (Nigeria/UK)Iota/B.1.526 (USA-NYC)Beta/B.1.351 (SA)Epsilon/B.1.427 + B.1.429 (USA)*Gamma/P.1 (Brazil)Zeta/P.2 (Brazil)A lineage isolateV01.V2 (Tanzania)APTK India VOC 32421Delta/B.1.617.2 (India)BV-1 (Texas, USA)Kappa/B.1.617.1 (India)Lambda/C.37 (Peru)Theta/P.3 (Philippines) Mu/B.1.621 (Colombia)C.1.2 (South Africa 2% of isolates in July 2021)R1 (Japan)Omicron/B.1.1.529 + BA.1 + BA.2 + BA.3 (South Africa November 2021)B.1.640.1 (Congo/France)B.1.640.2 (Cameroon/France)Four new recombinants 12/31 to 3/22)BA.2.12.1 (USA)BA.4 (South Africa)BA.5 (South Africa)BA.2.75 (India 7/22)BA.4.6 (USA 7/22)BF.7BJ.1XBB (new recombinant India)BQ.1BQ.1.1BS.1BN.1XBB.1XBB.1.5CH.1.1XBB.1.9.1XBB.1.5.1 | No | No |
| USA | 106,363,426(ranked #1) 275,591 new infections in the last 14 days with an average of 19,685 infections/day | 3,331(ranked #6) 43 states and D.C. failed to report infections on 4/07/23. | 1,156,896(ranked #1) 3,316 new deaths reported in the last 14 days or an average of 237 deaths/ day. | 46 44 states and D.C.and Puerto Rico failed to report deaths on 4/07/23. | 31.77% | B2 lineageAlpha/B.1.1.7 (UK)Eta/B.1.525 (Nigeria/UK)Iota/B.1.526 (USA-NYC)Beta/B.1.351 (SA)Epsilon/B.1.427 + B.1.429 (USA)*Gamma/P.1 (Brazil)Zeta/P.2 (Brazil)Delta/B.1.617.2 (India)BV-1 (Texas, USA)Theta/P.3 (Philippines) Theta/P.3 (Philippines) Kappa/B.1.617.1 (India)Lambda/C.37 (Peru)Mu/B.1.621 (Colombia)R1(Japan) Omicron/B.1.1.529 + BA.1 + BA.2 (South Africa November 2021)B.1.640.1 (Congo/France)Recombinant Delta AY.119.2- Omicron BA.1.1 (Tennessee, USA 12/31/21)\BA.2BA.2.12.1 (United States)BA.4 (South Africa 11/21)BA.5 (South Africa 11/21)BA.2.75 (India 7/22)BA.4.6 (USA 7/22)BA.4.6 (USA 7/22)BF.7BJ.1XBB (new recombinant India)BQ.1BQ.1.1BN.1XBB.1XBB.1.5XBB.1.5.1CH.1.1XBB.1.9.1 | No | No |
| Brazil | 37,319,254(ranked #5) 114,577 new infections in the last 14 days. | – | 700,556(ranked #2; 639 new deaths in the last 14 days) | – | 17.33% | No | No | |
| India | 44,745,104(ranked #2)42,847 new infections in the last 14 days.. | – | 530,934(ranked #3) 110 new deaths in the last 14 days) | 6 | 3.18% | No | No | |
| United Kingdom | 24,448,729(ranked #9) Unchanged in 4 weeks | – | 209,396 (ranked #7) Unchanged in 4 weeks | – | 35.69% Unchanged in 4 weeks | B2 lineageAlpha/B.1.1.7 (UK)Eta/B.1.525 (Nigeria/UK)Beta/B.1.351 (SA)Epsilon/B.1.427 + B.1.429 (USA)*Gamma/P.1 (Brazil)Delta/B.1.617.2 (India)Theta/P.3 (Philippines) Kappa/B.1.617.1 (India)Lambda/C.37 (Peru)Mu/B.1.621 (Colombia)C.1.2 (South Africa)Omicron/B.1.1.529 + BA.1 (South Africa November 2021)B.1.640.1 (Congo/France)XD (AY.4/BA.1) recombinantXF (Delta/BA.1) recombinantXE (BA.1/BA.2) recombinantBA.2BA.2.12.1 (United States)BA.4 (South Africa 11/21)BA.5 (South Africa 11/21)BA.2.75 (India 7/22)XBBXBB.1XBB.1.5XBB.1.5.1CH.1.1XBB.1.9.1 | No | No |
| California, USA | 12,183,512(ranked #13 in the world; 27,687 new infections in the last 14 days). | – | 102,043 (ranked #20 in world; 245 new deaths in the last 14 days | – | 30.83% | B2 lineageAlpha/B.1.1.7 (UK)Eta/B.1.525 (Nigeria/UK)Beta/B.1.351 (SA)Gamma/P.1 (Brazil)Epsilon/B.1.427 + B.1.429 (USA)*Zeta/P.2 (Brazil)Delta/B.1.617.2 (India)Theta/P.3 (Philippines) Kappa/B.1.617.1 (India)Lambda/C.37 (Peru) Mu/B.1.621 (Colombia) Omicron/ B.1.1.529 + BA.1 (South Africa November 2021)BA.2BA.2.12.1 (United States)BA.4 (South Africa 11/21)BA.5 (South Africa 11/21)BA.2.75 (India 7/22)BQ.1BQ.1.1BN.1XBBXBB.1XBB.1.5CH.1.1XBB.1. 5.1XBB.1.9.1 | No | No |
| Mexico | 7,552,726(ranked #19) 36,680 new infections in 14 days). | 2,178(rank #8) | 333,589(ranked #5) 227 new deaths in the last 14 days) | 19 | 5.74% | No | No | |
| South Africa | 4,075,101(ranked #38; 3,103 new infections in the last 14 days). | – | 102,595 (ranked #18) no new deaths reported in the last 70 days). | – | 6.70% | B2 lineageAlpha/B.1.1.7 (UK)Beta/B.1.351 (SA)Delta/B.1.617.2 (India)Kappa/B.1.617.1 (India) C.1.2 (South Africa, July 2021)Omicron/B.1.1.529 + BA.1 (South Africa November 2021)B.1.640.1 (Congo/France)BA.2BA.4 (South Africa 11/21)BA.5 (South Africa 11/21) | No | No |
| Canada | 4,634,277(ranked #34) 16,218 new infections in 14 days). | – | 52,121(ranked #24) 321 new deaths in the last 14 days. | – | 12.07% | No | No | |
| Russia | 22,698,025(ranked #10), 135,137 new infections in 14 days). | 8,915 (ranked #2) | 397,497(ranked #4)488 new deaths in 14 days | 38 | 15.56%0.09% increase in 14 days. | No | No | |
| Peru | 4,494,371(ranked #35, 3,880 new infections in 14 days).. | – | 219,849(ranked #6) 155 new deaths in the last 14 days. | – | 13.34% | No | No | |
| Spain | 13,798,747(ranked #12; 8,167 new infections in 14 days). | – | 120,426 (ranked #15) 256 new deaths in 14 days. | – | 29.54% | No | No | |
| France | 39,835,817 (ranked #3) 91,699 new infections in 14 days). | 8,786 (ranked #3) | 165,857 (ranked #10) 388 new deaths in 14 days. | 28 | 60.74% a 0.14% increase in 14 days. | No | No | |
| Germany | 38,368,891(ranked #4; 37,951 new infections in 14 days.) | – | 171,411 (ranked #9)1,090 new deaths in 14 days. | 100 | 45.70%0.10% increase in 14 days | No | No | |
| South Korea | 30,894,559 (ranked #7; 144,819 new infections in 14 days). | 10,735(ranked #1) | 34,318 (ranked #32) 107 new deaths in 14 days. | 9 | 60.19%0.28% increase in 14 days | No | No | |
| Netherlands | 8,610,372 (ranked #17; 2,249 new infections in 14 days). | – | 22,992 (ranked #42) Unchanged in 10 weeks | – | 50.02% | No | No | |
| Taiwan | 10,239.998(ranked #15); | – | 19,005 | – | 42.87% | No | No | |
| Japan | 33,508,380(ranked #6)101,205 new infections in the last 14 days | 8,338(ranked #4) | 74,060(ranked #20)379 new deaths in the last 14 days for an average of 27 deaths per day. | 31 | 26.68%0.08% of the population infected in the last 14 days. | No | No | |
| Hong Kong | 2,885,426(ranked# 41) 979 new infections in the last 14 days. | 98 | 13,483 (ranked #60)9 new deaths in the last 14 days. | – | 37.94%0.01% increase in the last 14 days.` | No | No | |
| China | 503,302 | – | – | – | – | – | – | – |
What Our Team Is Reading This Week
- Live-attenuated vaccine sCPD9 elicits superior mucosal and systemic immunity to SARS-CoV-2 variants in hamsters https://www.nature.com/articles/s41564-023-01352-8
- SARS-CoV-2 variants resistant to monoclonal antibodies in immunocompromised patients constitute a public health concern https://doi.org/10.1172/JCI168603
- “Super-Spreaders” and Person-to-Person Transmission of Andes Virus in Argentina https://www.nejm.org/doi/full/10.1056/NEJMoa2009040
- The gray swan: model-based assessment of the risk of sudden failure of hybrid immunity to SARS-CoV-2 https://doi.org/10.1101/2023.02.26.23286471
- The Black Swan by Nassim Nicholas Talib https://bookshop.org/p/books/the-black-swan-second-edition-the-impact-of-the-highly-improbable-with-a-new-section-on-robustness-and-fragility-nassim-nicholas-taleb/7841914?ean=9780812973815
- SARS-CoV-2 variants of concern and variants under investigation in England Technical briefing 51, 10 March 2023 https://assets.publishing.service.gov.uk/government/uploads/system/uploads/attachment_data/file/1141754/variant-technical-briefing-51-10-march-2023.pdf
- SARS-CoV-2 variants of concern and variants under investigation in England Technical briefing 50, 10 February 2023 https://assets.publishing.service.gov.uk/government/uploads/system/uploads/attachment_data/file/1135877/variant-technical-briefing-50-10-february-2023.pdf
- Identification of a molnupiravir-associated mutational signature in SARS-CoV-2 sequencing databases (Preprint) https://doi.org/10.1101/2023.01.26.23284998
- COVID drug drives viral mutations — and now some want to halt its use https://www.nature.com/articles/d41586-023-00347-z#ref-CR1
- SARS-CoV-2 variants of concern and variants under investigation in England Technical briefing 49, 11 January 2023 https://assets.publishing.service.gov.uk/government/uploads/system/uploads/attachment_data/file/1128554/variant-technical-briefing-49-11-january-2023.pdf
- Long COVID: major findings, mechanisms and recommendations (Nature) https://www.nature.com/articles/s41579-022-00846-2
- Enhanced fusogenicity and pathogenicity of SARS-CoV-2 Delta P681R mutation (Nature) https://doi.org/10.1038/s41586-021-04266-9
- Virological characteristics of the SARS-CoV-2 XBB variant derived from recombination of two Omicron subvariants (Preprint) https://doi.org/10.1101/2022.12.27.521986
- SARS-CoV-2 infection and persistence in the human body and brain at autopsy (Nature) https://doi.org/10.1038/s41586-022-05542-y
- Lifting Universal Masking in Schools — Covid-19 Incidence among Students and Staff (NEJM) https://www.nejm.org/doi/full/10.1056/NEJMoa2211029

You must be logged in to post a comment.