COVID-19

SARS-CoV-2 Update

In this update:

  • In the United States, daily COVID deaths and infections increased over the last two weeks, with an average loss of 453 lives per day. 
  • The US government is mailing free COVID test kits again, and US residents can anonymously report the results of at-home tests to NIH.
  • Immune-escaping BQ variants continue to dominate in the US, though recombinant XBB lineages, which have been demonstrated to evade neutralizing antibodies in vaccinated people, are on the rise. 
  • Bivalent booster uptake is still insufficient to protect the US population this winter, with only 14.1% of the population up to date on COVID vaccines. 
  • In Monterey County, just over half of the population has received three vaccine doses, and only 16.1% have received the bivalent booster. 
  • Dr. Wright continues to recommend that everyone wear N95 or P100 masks when gathering indoors. This will help protect not only against COVID-19, but also against other respiratory viruses that are on the rise around the country, including RSV, flu, and measles. Anyone who is not up to date on flu and measles vaccines should get vaccinated as soon as possible.

Don’t want to miss an update?

Get the latest COVID updates from Dr. Wright delivered to your inbox as soon as they’re published!

It’s time for our next 14-day moving average determinations for SARS-CoV-2 for the United States and my thoughts on vaccines, SARS-CoV-2 therapeutic agents and mutant viruses. We use the WORLDOMETERS aggregators data set to make any projections since it includes data from the Department of Veterans Affairs, the U.S. Military, federal prisons and the Navajo Nation.

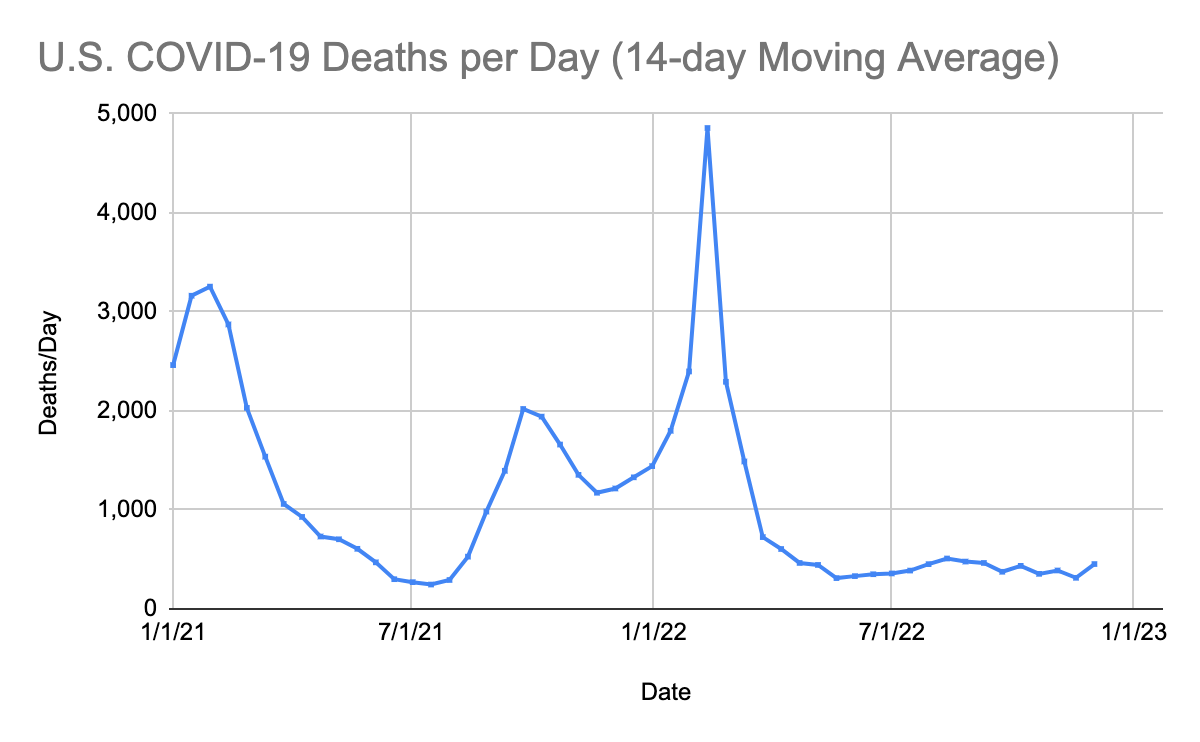
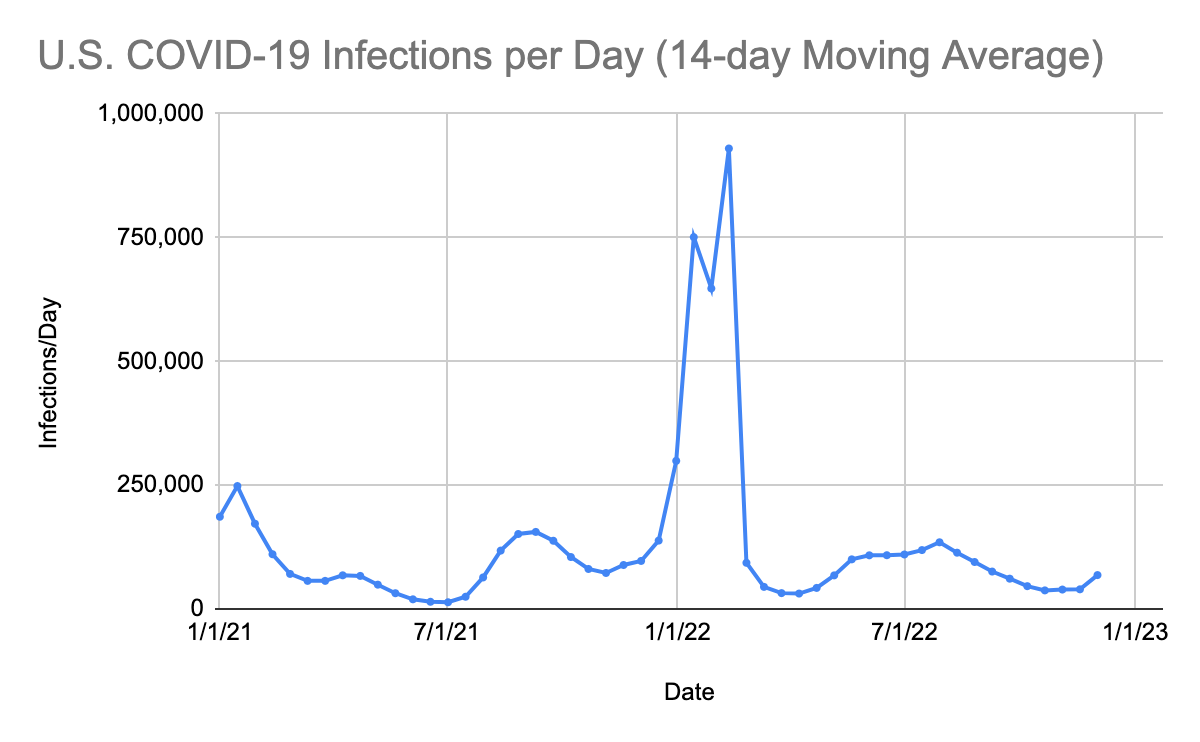
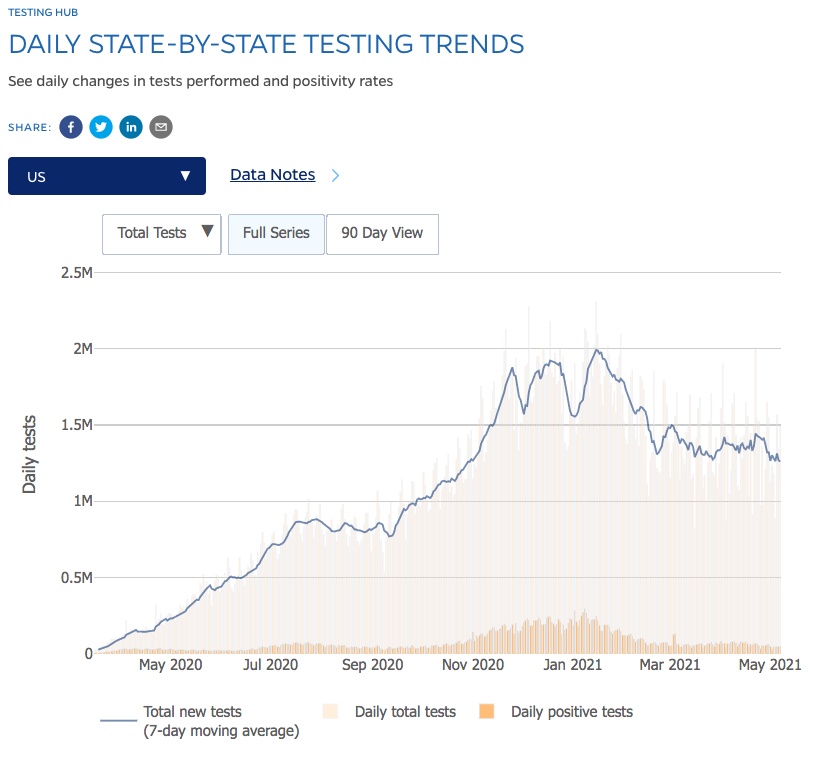
SARS-CoV-2 infections per day in the United States have increased for the fourth time in 8  weeks. There is still widespread underreporting by states, a failure to capture all positive home tests, and a decreased PCR screening program in most states. Deaths per day in the United States have increased by 157 deaths per day. Many states are not reporting deaths or infections in a timely manner. The number of infections per day has increased by 23,190 due to the lack of mask use in schools, businesses, and airports; a failure of adequate building ventilation; lack of social distancing; and low rates of bivalent booster uptake. Continued infection and death increases are expected in the next four weeks with 113 million people expected to travel during the holiday season. In late November of this year, the National Institutes of Health launched MakeMyTestCount.org, a website that allows users to anonymously report the results of at-home COVID tests. Unfortunately, it has thus far not been widely publicized. The US government has begun mailing free test kits again. Go to the following website to obtain free test kits: https://special.usps.com/testkits 

Drug-Evading Mutants Continue to Dominate the Variant Soup

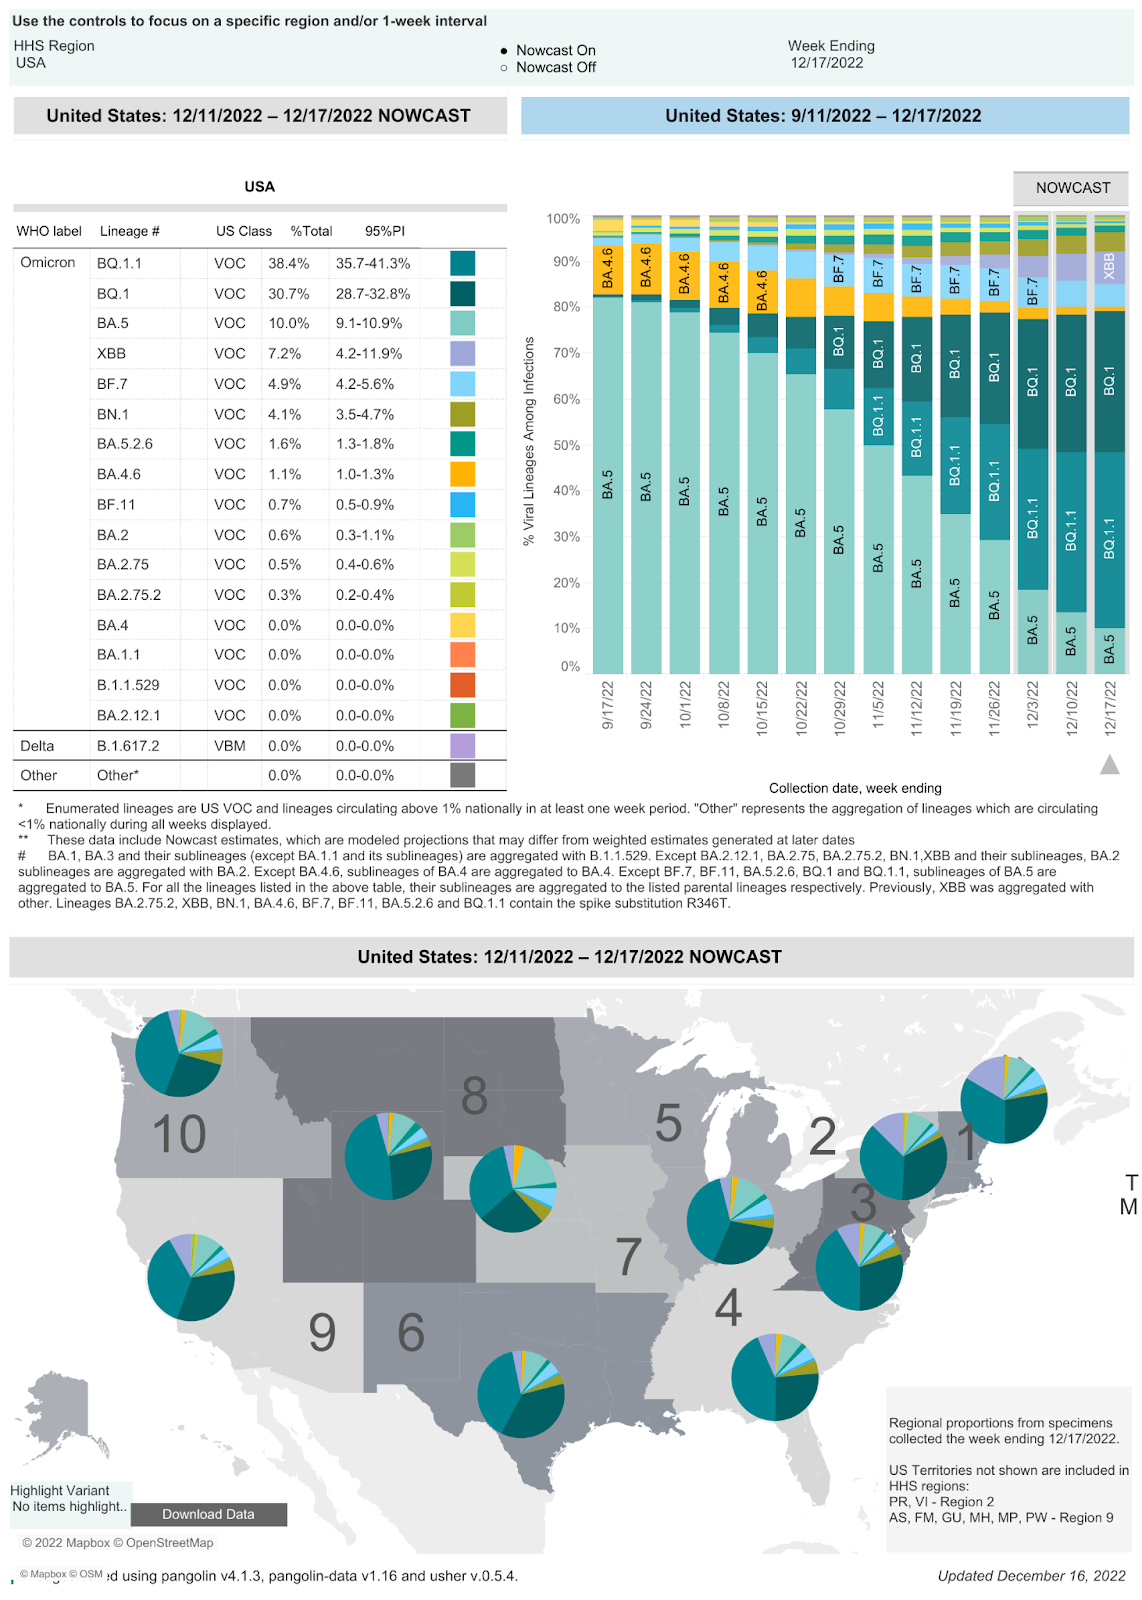
On 12/17/22 the CDC estimates that BA.5 accounted for 10% of infections (a 42.4% drop from 10/21/22), BQ.1 accounted for 30.7% (a 21.3% increase since 10/21/22), BQ.1.1 accounted for 38.4% (a 31.2% increase since 10/21/22), BA.4.6 accounted for 1.1% (a 8.4% decrease from 10/21/22), BF.7 accounted for 4.9% (a 4.1% decrease from 10/21/22), BN.1 accounted for 4.1% of isolates (a 1% decrease since 1/19/22), and BA.2.75.2 accounted for 0.3%. In the last four weeks, three isolates were added to the CDC’s reporting: XBB (7.2% an increase of 1.7% since 12/2/22), BA.5.2.6 (1.6% a decrease of 0.2% since 12/2/22), and BF.11 (0.7% decrease of 0.2% since 12/2/22). In the week ending December 17, 2022, BQ isolates accounted for 69.1% of infections (a 33.8% increase in infections caused by these BQ variants since 10/21/22). BQ.1.1 has five spike mutations that are different from BA.5. Four of these mutations allow escape from immunity from monoclonal antibodies, any prior infection (including Omicron BA.5), or any vaccine to include the bivalent Omicron BA.5 vaccine. Infections are occurring in our clinic in patients that received the Omicron BA.5 bivalent vaccine.

CDC
CDC

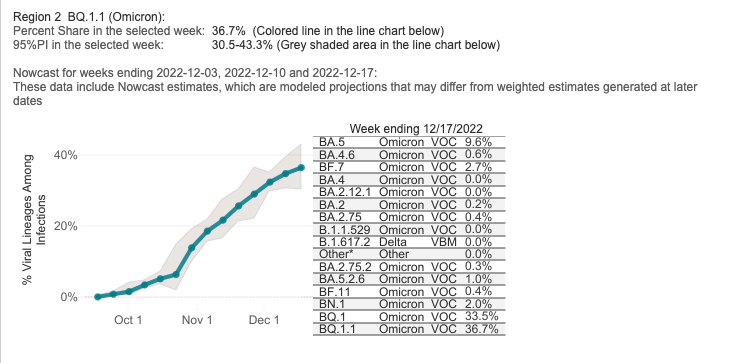
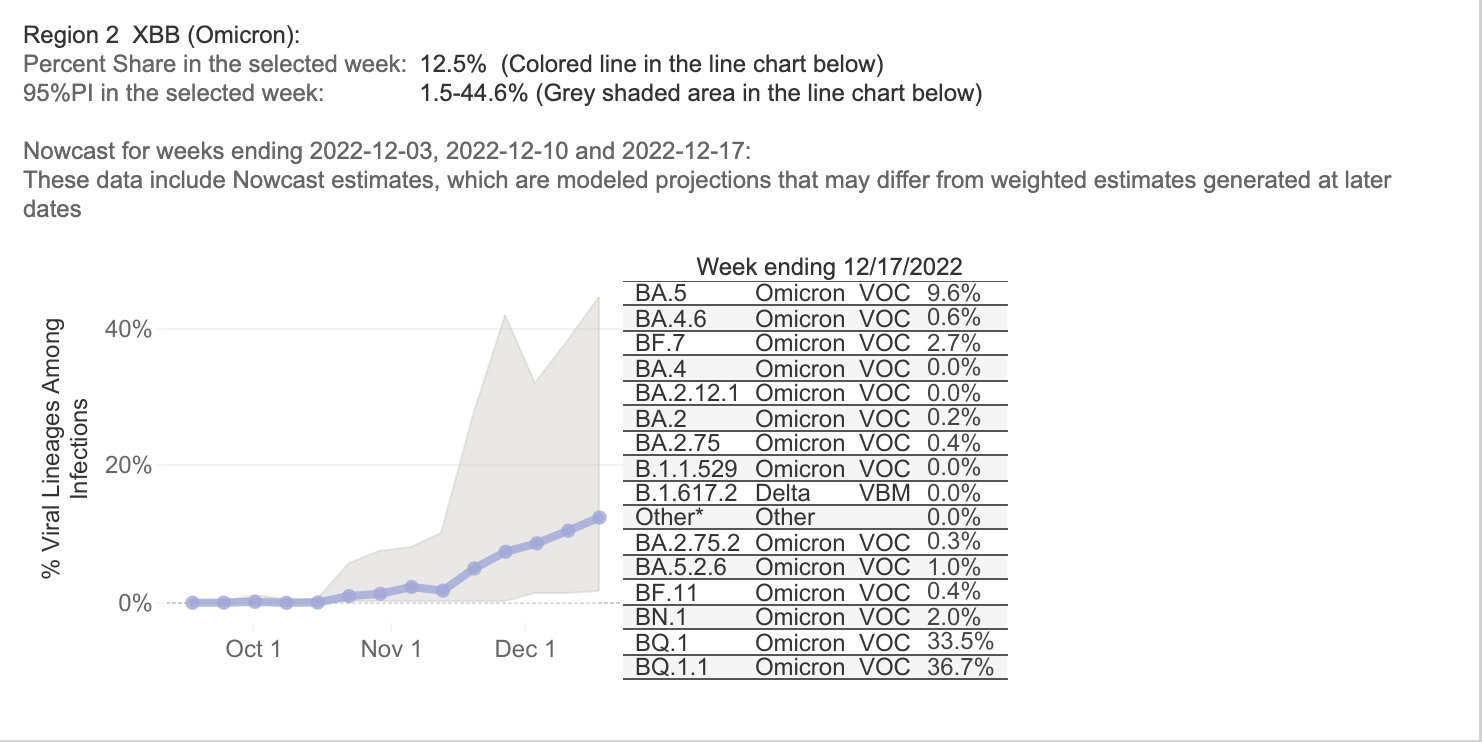
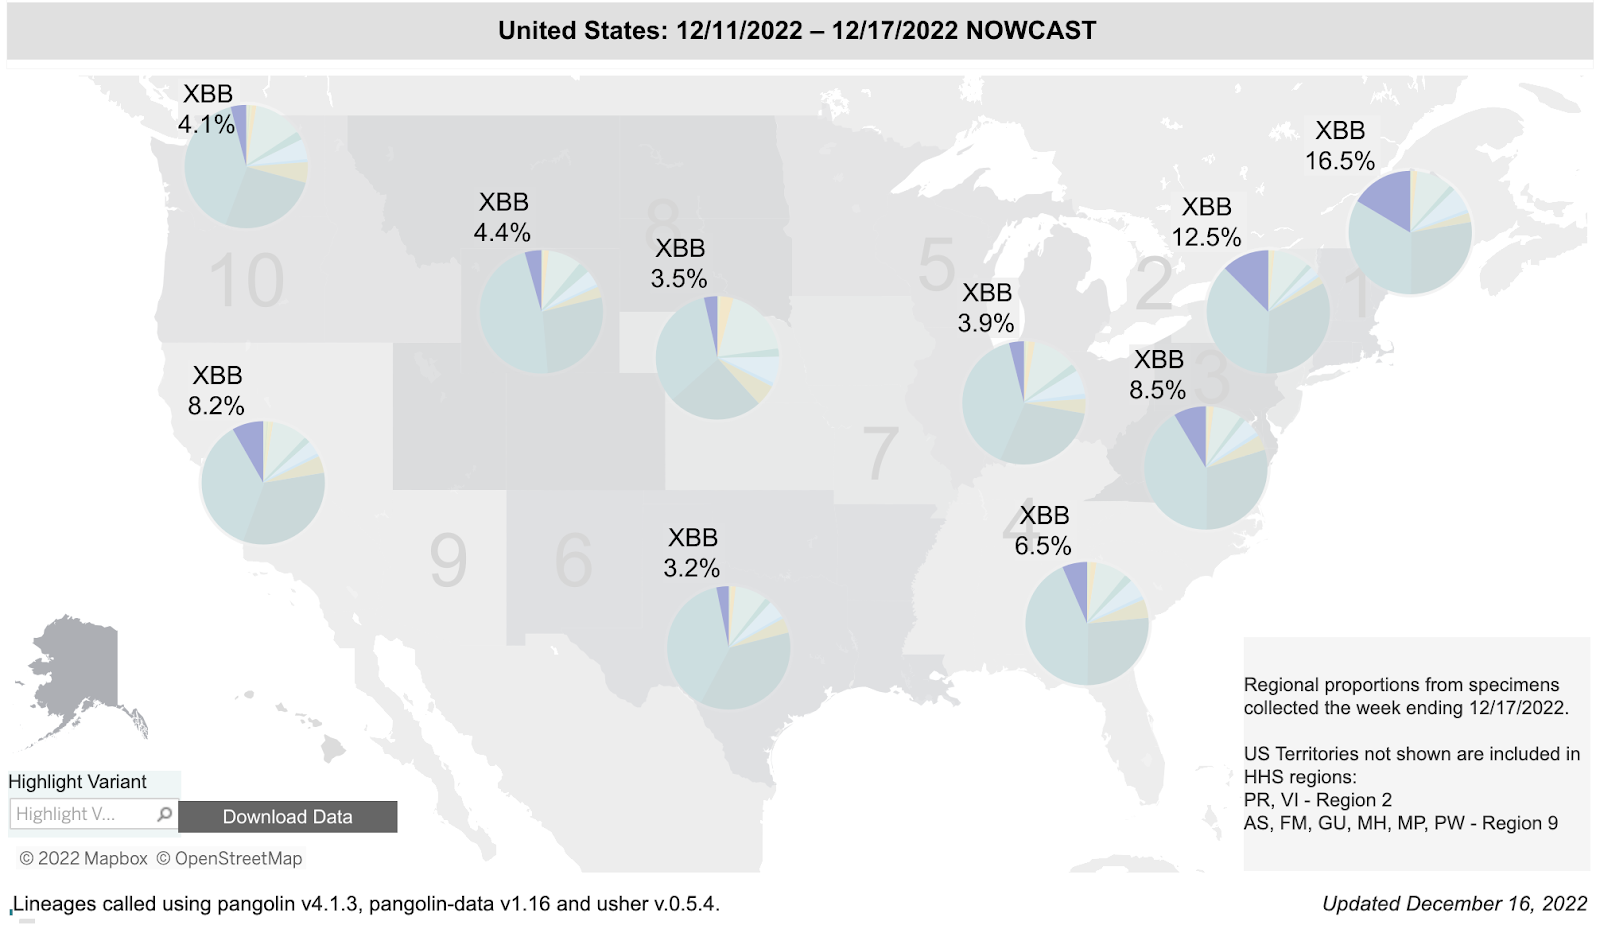
The total percentage of BQ variant infections in the region that includes New York and New Jersey was 72.4% two weeks ago and is now 70.2%. BA.5 accounts for 9.6% of infections, BF.7 accounts for 2.7%, BN.1 accounts for 2.0%, BA.5.2.6 accounts for 1%, and BA.2.75 lineages account for 0.7% of infections. XBB isolates (STILL not shown in above chart) are 12.5% of isolates in Region 2 (see below). 

CDC
CDC

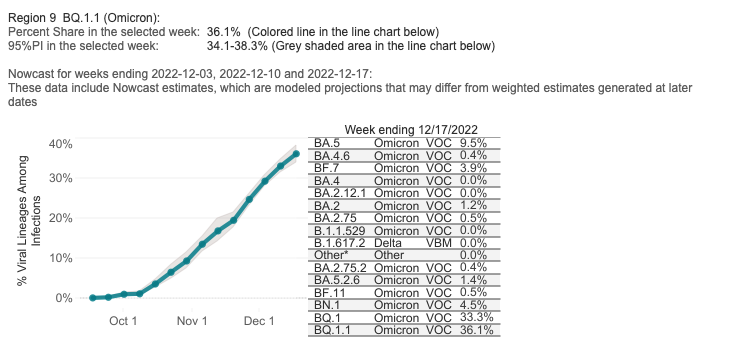
The total percentage of BQ variant infections in the region that includes California, Nevada, Arizona, and Hawaii was 62.6% on 12/3/22 and is now 69.4%. BA.5 accounts for 9.5% of isolates, and BA.5.2.6 accounts for 1.4%. The BA.2.75 lineages account for 1.2%. BF.7 accounts for 3.9%, BN.1 accounts for 4.5%, and BA.2 isolates account for 1.2%. Again, CDC is not reporting XBB in the Region 9 chart above. XBB isolates are 8.2% of isolates in region 9.

CDC

Data on the rapid spread of a dangerous variant category, the BQ variants, was withheld by the CDC in their weekly reports until seven weeks ago. This data on BQ.1 and BQ.1.1 should have been disclosed earlier.

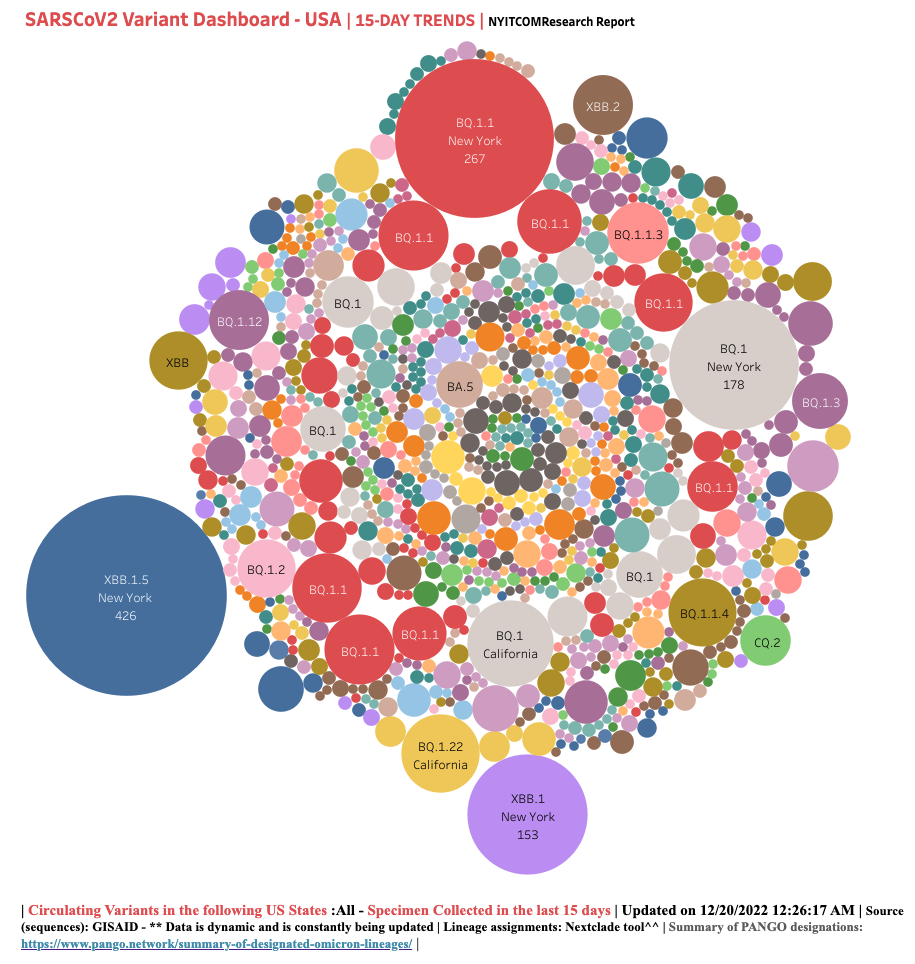
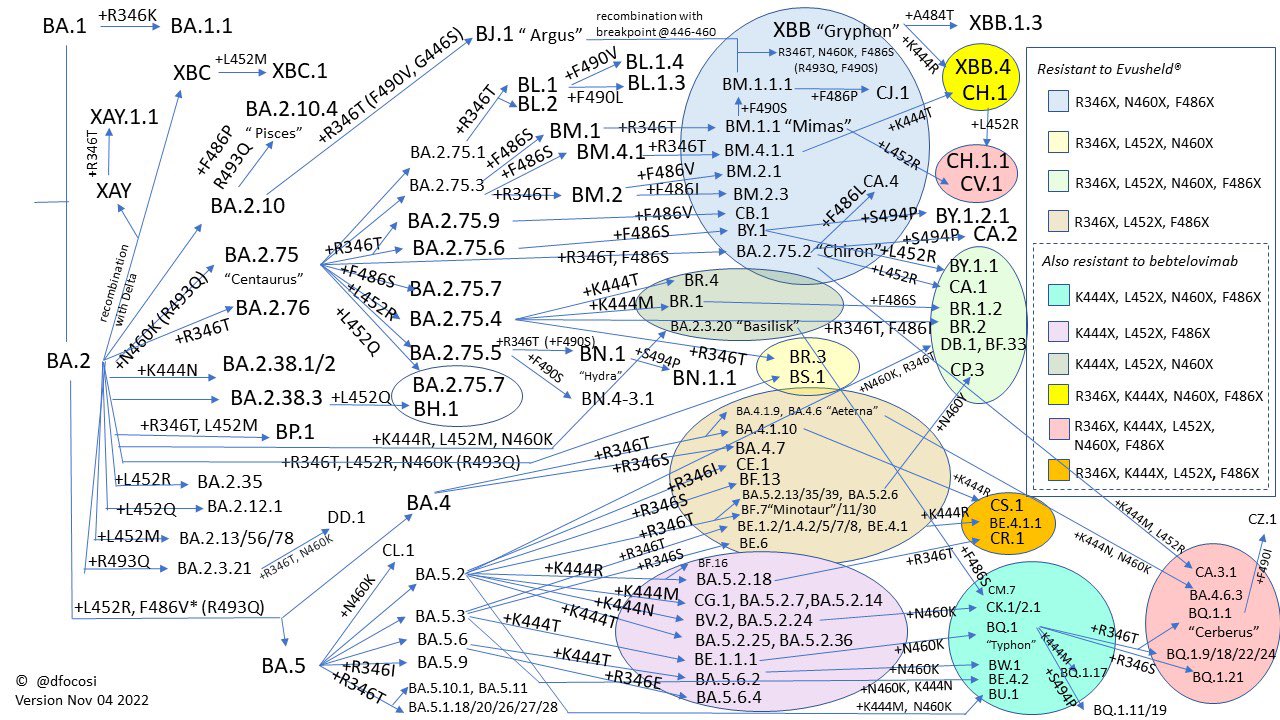
For a more detailed picture of COVID variant evolution in the United States, we recommend checking out the dashboard put together by Raj Rajnarayanan, Assistant Dean of Research and Associate Professor at NYITCOM at Arkansas State University. We can see that XBB already has a few subvariants that are gaining prevalence in New York. 

To understand the true impact of these variants, it’s helpful to examine their evolution. Two virologists collaborated on Twitter to create the figure below, which Professor Johnson titled “Convergent Evolution on Steroids.”  It shows the key mutations present in many of the currently-circulating Omicron subvariants and demonstrates that mutation at site 346 is becoming more and more common. 

From Daniele Focosi, M.D., Ph.D. @dfocosi on Twitter, November 4, 2022

Past infections with a BA.1, BA.2 or BA.5 variants will not prevent infections with any of the newer variants. Monoclonal antibodies are no longer effective against newer BQ variants and other spike protein mutated variants. The last remaining monoclonal antibody, bebtelovimab, was removed from use by the FDA on 12/2/22. Paxlovid was only 89% effective in the original clinical trials against SARS-CoV-2. If resistance develops this winter to oral Paxlovid, we will have more Paxlovid failures and increased hospitalizations and deaths.

The November 25 UK Health Security Agency Technical Briefing identifies lineages BA.5, BA.5.2.35, BA.5.7, BQ.1, BQ.1.1, XBB, and BN1 (BA.2.75.5.1) as isolates of concern.  

VariantSublineage ofMutationsGlobal Sequences outside UKUK Sequences
BQ.1BA.5L452RN460KK444T33,206 (81 countries)9,285
(> 40% of all sequenced samples)
BQ.1.1BA.5N460KK444TR346T17,621(70 countries)4,715
BA.5.2.35BA.5.2R346T, 2 synonymous single nucleotide polymorphisms (SNPs) G28423C and C7006T447848
BN.1BA.2.75.5R346T F490S 1,127190
XBBRecombinant of BJ.1 and BM.1.1.1 (both descended from BA.2), approximate break point between spike mutations G446S and N460KE: T11A, Spike: V83A, H146Q, Q183E, F486S, F490S.Spike mutations inherited from BJ.1 are G339H, R346T, V445P, G446S and from BM.1.1.1 areN460K, F486V, F490S, and R493Q4,831 (51 countries)345 

Disappointing Vaccine Uptake, Especially Among Children

Our monoclonal antibody therapies do not work for these isolates, but these emerging BQ variants are descendants of BA.5, so the new BA.5 bivalent vaccine should offer some protection, when combined with an N95 mask. It’s troubling that, despite the availability of this vaccine, few people are getting vaccinated. As of December 14, 2022, the CDC reports that 44,154,294 people in the United States (5 years and up) have received the bivalent vaccine. That’s only 19.4% of people (5 and up) who received the primary series and 14.1% of the overall population.  

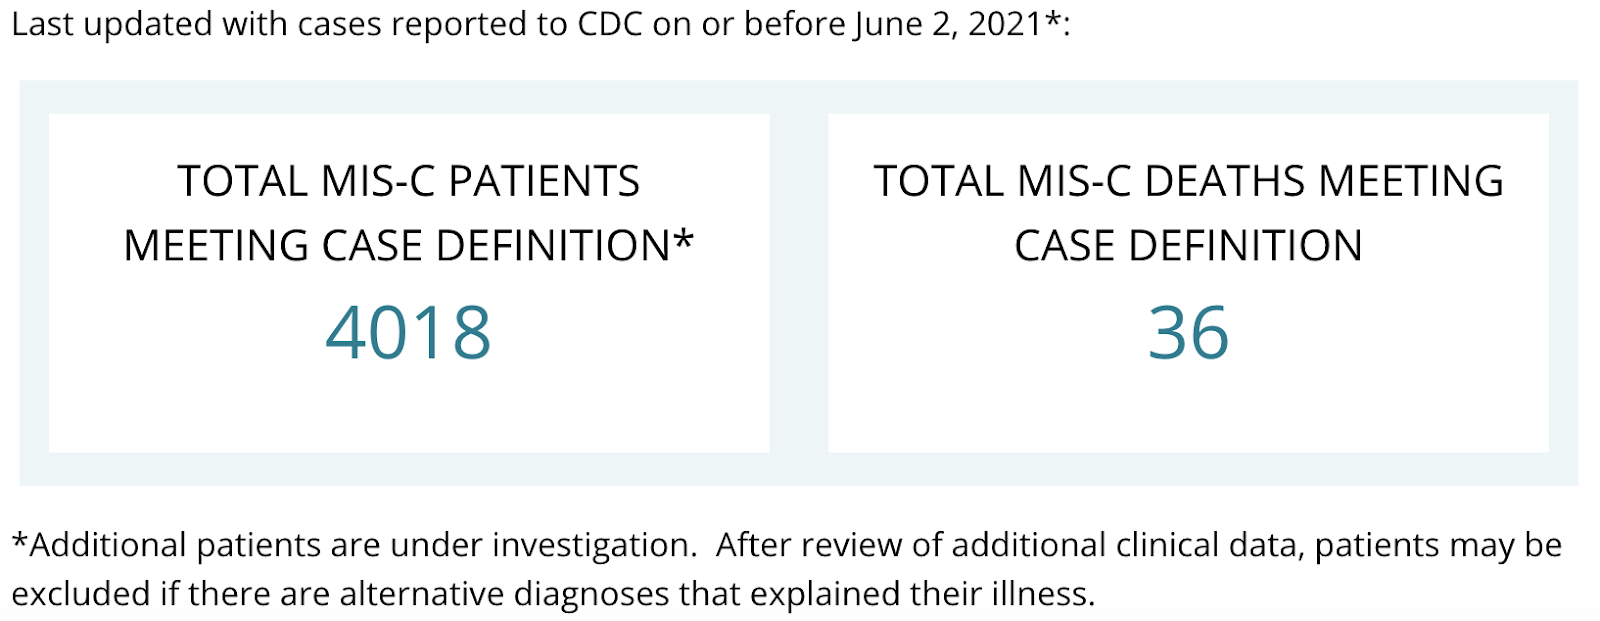
Children under the age of 5 have not been approved to receive either Omicron BA.5 mRNA booster. Sadly, in children between 0 and 5 years of age only 1.61 million have received at least one dose of any SARS-CoV-2 mRNA vaccine based on the original Wuhan isolate. In the United States, at least 1,390 children have died of COVID-19, and another 74 have died of multisystem inflammatory syndrome (MIS-C). Worldwide, according to UNICEF, over 16,100 children and young adults aged 0-20 have died of COVID-19. 

The Monterey County Health Department reports that, as of 12/19/22, 3.7% of 0-4 year-olds and 40.2% of 5-11 year-olds have received the first two doses of vaccine, while 73.4% of 12-17 year-olds have received two doses. Only 55.5% of Monterey County residents have received a third dose of the vaccine. The Monterey County Health Department does not publish data on how many residents have received the new BA.5 bivalent booster vaccine, but the Monterey Weekly reported on December 8 that only 16.1% of county residents had received it. On June 17, The FDA authorized both the Pfizer and Moderna vaccines for use in children ages 6 months to four years. We believe children under 5 should be vaccinated as soon as possible. All Monterey County residents should get up to date on COVID-19 vaccinations, including the bivalent BA.5 booster, as soon as possible.  

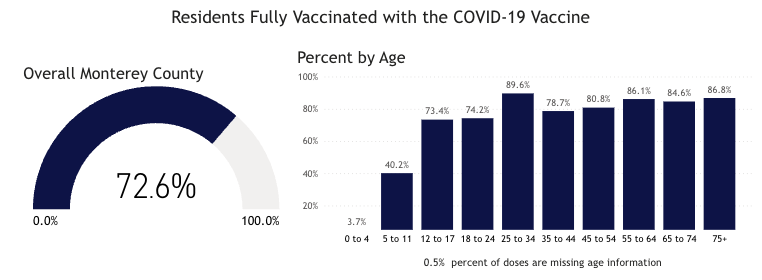
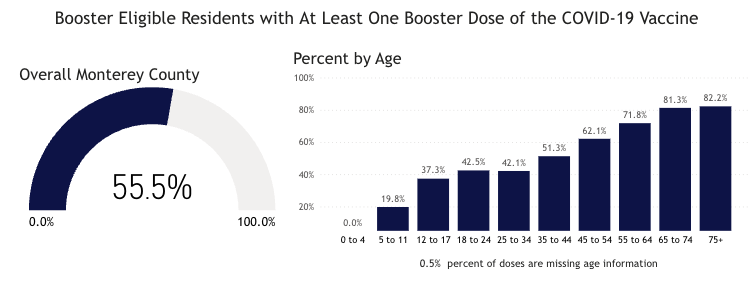
Source: Monterey County Health Department

Mask Up to Protect Against Additional Viral Threats This Winter

In a new preprint on respiratory syncytial virus (RSV) in young children, researchers from Case Western University write, “Among RSV-infected children in 2022, 19.2% had prior documented COVID-19 infection, significantly higher than the 9.7% among uninfected children, suggesting that prior COVID-19 could be a risk factor for RSV infection or that there are common risk factors for both viral infections.” Wearing a well-fitting, high-filtration mask not only protects against COVID but also protects against other viruses like RSV, influenza, and measles. The recent surge in respiratory infections among children that has overwhelmed hospitals around the country is most certainly a result of the removal of mask mandates throughout the United States. A new study of COVID infection data in Massachusetts public schools from February to June 2022, after many districts rescinded mask mandates, shows that “the lifting of masking requirements was associated with an additional 44.9 cases per 1000 students and staff,” compared to in schools where mask requirements were upheld. The authors explain that the districts which kept mask requirements in place were ones that tended to have less updated buildings and whose student populations had a greater percentage of low-income families, students with disabilities, English learners, and Black and Latinx students. As such, they conclude, “we believe that universal masking may be especially useful for mitigating effects of structural racism in schools, including potential deepening of educational inequities.” This is something that we’ve been saying since the beginning of the pandemic; removing nonpharmaceutical interventions always disproportionately harms the most vulnerable members of our society.  

Two weeks ago, we mentioned an Arstechnica report that the state of Ohio had had 54 cases of measles this year, 50 of which were in the Columbus area, 20 of which required hospitalization, and all of which were in unvaccinated people. As of December 20, the number of measles cases in Central Ohio has risen to 81, and 29 of these have been hospitalized.  

As of December 15, the CDC has reported 106 cases of measles in the United States in five (undisclosed) jurisdictions. We’re certain that with no airborne disease mitigations for holiday travel, measles cases will increase over the next month.

A Deeper Dive into U.S. COVID Data

On 12/16/22, the United States had 28,877 documented new infections. There were also 147 deaths. Thirty-five states did not report their infections, and 36 states didn’t report their deaths. In the United States on 12/17/22 the number of hospitalized patients (40,374)  has increased  (+16.5% compared to the previous 14 days) and was 34,646 on December 2. On 12/17/22 there were 4,627 patients who were seriously or critically ill (a 15.5% increase); that number was 4,005 two weeks ago. The number of critically ill patients has increased by 643 in the last 14 days, while at least 4,168 new deaths occurred. The number of critically ill patients has increased for the eighth time in thirty-two 14-day periods. Patients are still dying each day (average 298/day). 

As of 12/16/22, we have had 1,112,944 deaths and 101,743,845 SARS-CoV-2 infections in the United States. We have had 956,066 new infections in the last 14 days. We are adding an average of 478,033 new infections every seven days. For the pandemic in the United States we are averaging one death for every 91.41 infections or over 10,939 deaths for each one million infections. As of 12/16/22, thirty-nine states have had greater than 500,000 total infections, and 38 states and Puerto Rico have had greater than 5,000 total deaths. Forty-six states have had greater than 2,000 deaths, and 33 states have greater than 3,000 deaths per million population. Eight states have over 4,000 deaths per million population: Mississippi (4,389), Arizona (4,387), Alabama (4,223), West Virginia (4,275), New Mexico (4,179), Tennessee (4,160), Arkansas (4,194) and Michigan (4,056). Eighteen states (Alabama, Virginia, Missouri, North Carolina, Indiana, Tennessee, Massachusetts, Ohio, Michigan, Georgia, Illinois, New Jersey, Pennsylvania, Florida, Texas, New York, Arizona and California) have had greater than 20,000 deaths. Eight states have had greater than 40,000 deaths: Florida (83,380 deaths), Texas (92,108 deaths), New York (74,759 deaths), Pennsylvania (48,662 deaths), Georgia (41,244 deaths), Ohio (40,747 deaths) , Illinois (40,502 deaths), Michigan (40,508), and  California (98,034 deaths, 20th most deaths in the world). 

On 11/20/20, there were 260,331 (cumulative) deaths in the US from SARS-CoV-2. Since 11/20/20 (25 months), there were 845,843 new deaths from SARS-CoV-2. For twenty-one of those months, vaccines have been available to all adults. During these twenty-one months, 540,845 people have died of SARS-CoV-2 infections. Clearly, a vaccine-only approach is not working anywhere, especially not in the United States. In addition to getting more people vaccinated, most of the hospitalizations and deaths could have been prevented by proper masking (N95 or better), social distancing, and treatment with oral antiviral agents like Paxlovid. We recommend all of these precautions and treatments to every patient in our clinic, and we have only lost one patient to COVID in 2.5 years. 

As of 12/16/22, California was ranked 33rd in the USA in infection percentage at 29.45%. In California, 25.48% of the people were infected in the last 21 months. As of 12/16/22, 29 states have had greater than 30% of their population infected. Fifty states, the District of Columbia and Puerto Rico have greater than 20% of their population infected.                            

Worldwide, average deaths per day are 1,760 for the last 14 days. The United States accounts for 25.73% (453 per day) of all deaths per day in the world over the last two weeks. Worldwide infections per day were 546,064 the last two weeks. The United States accounts for 12.50% of those infections (or 68,294 infections per day). 

FDA-Approved Oral Drug Treatments for SARS-CoV-2

Pfizer has developed PAXLOVID™, an oral reversible inhibitor of C3-like protease of SARS-CoV-2. The drug inhibits this key enzyme that is crucial for virus production. The compound, also called Compound 6 (PF-07321332), is part of the drug combination PAXLOVID™ (PF-07321332; ritonavir), which just successfully completed a Phase 2-3 trial in humans in multiple countries. The preliminary results were announced on 11/5/21 by Pfizer. The results show that 89% of the hospitalizations and deaths were prevented in the drug treatment arm. The drug was administered twice a day for five days. No deaths occurred in the treatment group, and ten deaths occurred in the placebo group. The study was stopped by an independent data safety monitoring board, and the FDA concurred with this decision. Pfizer applied for an Emergency Use Authorization for this drug on 11/15/21. This drug was approved on 12/23/21. We have only been able to obtain PAXLOVID™ for two patients who we successfully treated with this drug obtained from CVS in Salinas (East Alisal Street; phone number 831-424-0026). They were expecting another shipment on 1/28/22. In my opinion, this agent, if more widely available, could markedly alter the course of every coronavirus infection throughout the world. 

Watching World Data

Over the next few months, we’ll be paying close attention to correlations between the SARS-CoV-2 data, the number of isolates identified in various countries and states, and the non-pharmaceutical interventions (like mask mandates and lockdowns) put in place by state and national governments. Data on infections, deaths, and percent of population infected was compiled from Worldometers. Data for this table for SARS-CoV-2 Isolates Currently Known in Location was compiled from GISAID and the CDC. It’s worth noting that GISAID provided more data than the CDC.

LocationTotal Infections as of 12/16/22New Infections on 12/16/22Total DeathsNew Deaths on 12/16/22% of Pop.InfectedSARS-CoV-2 Isolates Currently Known in LocationNational/ State Mask MandateCurrently in Lockdown
World656,953,845(7,644,889 new infections in 14 days).473,6156,669,730(24,636 new deaths in last 14 days)1,1048.42%B2 lineageAlpha/B.1.1.7 (UK)Eta/B.1.525 (Nigeria/UK)Iota/B.1.526 (USA-NYC)Beta/B.1.351 (SA)Epsilon/B.1.427 + B.1.429 (USA)*Gamma/P.1 (Brazil)Zeta/P.2 (Brazil)A lineage isolateV01.V2 (Tanzania)APTK India VOC 32421Delta/B.1.617.2 (India)BV-1 (Texas, USA)Kappa/B.1.617.1 (India)Lambda/C.37 (Peru)Theta/P.3 (Philippines) Mu/B.1.621 (Colombia)C.1.2 (South Africa 2% of isolates in July 2021)R1 (Japan)Omicron/B.1.1.529 + BA.1 + BA.2 + BA.3 (South Africa November 2021)B.1.640.1 (Congo/France)B.1.640.2 (Cameroon/France)Four new recombinants 12/31 to 3/22)BA.2.12.1 (USA)BA.4 (South Africa)BA.5 (South Africa)BA.2.75 (India 7/22)BA.4.6 (USA 7/22)BF.7BJ.1XBBBQ.1BQ.1.1BS.1BN.1  NoNo
USA101,743,845(ranked #1) 956,066 new infections in the last 14 days or 68,294/day.
28,877(ranked #5)
35 states and D,C. failed to report infections on 12/2/22.
1,112,944(ranked #1) 6,337 new deaths reported in the last 14 days or 388/day. 147
33 states  and D.C. failed to report deaths on 12/2/22.
30.38%
B2 lineageAlpha/B.1.1.7 (UK)Eta/B.1.525 (Nigeria/UK)Iota/B.1.526 (USA-NYC)Beta/B.1.351 (SA)Epsilon/B.1.427 + B.1.429 (USA)*Gamma/P.1 (Brazil)Zeta/P.2 (Brazil)Delta/B.1.617.2 (India)BV-1 (Texas, USA)Theta/P.3 (Philippines) Theta/P.3 (Philippines) Kappa/B.1.617.1 (India)Lambda/C.37 (Peru)Mu/B.1.621 (Colombia)R1(Japan)         Omicron/B.1.1.529 + BA.1 + BA.2 (South Africa November 2021)B.1.640.1 (Congo/France)Recombinant Delta AY.119.2- Omicron BA.1.1 (Tennessee, USA 12/31/21)\BA.2BA.2.12.1 (United States)BA.4 (South Africa 11/21)BA.5 (South Africa 11/21)BA.2.75 (India 7/22)BA.4.6 (USA 7/22)BQ.1BQ.1.1BN.1NoNo
Brazil35,874,528(ranked #5) 498,995 new infections in the last 14 days. 64,696 (ranked#3)691,776(ranked #2; 1,647 new deaths in 14 days)12416.65%B2 lineageAlpha/B.1.1.7 (UK)Beta/B.1.351 (SA)Gamma/P.1 (Brazil)Zeta/P.2 (Brazil)Lambda/C.37 (Peru)Mu/B.1.621 (Colombia) Omicron/B.1.1.529 + BA.1 (South Africa November 2021)BA.2BA.2.12.1 (United States)BA.4 (South Africa 11/21)BA.5 (South Africa 11/21)NoNo
India 44,676,911(ranked #2); 2,716 new infections in 2 weeks.220
530,663(ranked #3) 36 new deaths in 2 weeks.3.17%B2 lineageAlpha/B.1.1.7 (UK)Beta/B.1.351 (SA)Gamma/P.1 (Brazil)Epsilon/B.1.427 + B.1.429 (USA)*Eta/B.1.525 (Nigeria/UK)APTK India VOI 32421Delta/B.1.617.2 (India)Kappa/B.1.617.1 (India)Iota/B.1.526 (USA-NYC) Omicron/B.1.1.529 + BA.1 (South Africa November 2021)B.1.640.1 (Congo/France)BA.4 (South Africa 11/21)BA.5 (South Africa 11/21)BA.2.75 (India)NoNo
United Kingdom
24,053,576(ranked #9) 28,830 new infections in 2 weeks.197,723 (ranked #7) 470 new deaths in 2 weeks35.11%B2 lineageAlpha/B.1.1.7 (UK)Eta/B.1.525 (Nigeria/UK)Beta/B.1.351 (SA)Epsilon/B.1.427 + B.1.429 (USA)*Gamma/P.1 (Brazil)Delta/B.1.617.2 (India)Theta/P.3 (Philippines) Kappa/B.1.617.1 (India)Lambda/C.37 (Peru)Mu/B.1.621 (Colombia)C.1.2 (South Africa)Omicron/B.1.1.529 + BA.1 (South Africa November 2021)B.1.640.1 (Congo/France)XD (AY.4/BA.1) recombinantXF (Delta/BA.1) recombinantXE (BA.1/BA.2) recombinantBA.2BA.2.12.1 (United States)BA.4 (South Africa 11/21)BA.5 (South Africa 11/21)BA.2.75 (India 7/22)NoNo
California, USA11,639,487(ranked #13 in the world; 155,919 new infections in the last 14 days).3,23598,034 (ranked #20 in world)
176  new deaths in the last 14 days
2029.45%B2 lineageAlpha/B.1.1.7 (UK)Eta/B.1.525 (Nigeria/UK)Beta/B.1.351 (SA)Gamma/P.1 (Brazil)Epsilon/B.1.427 + B.1.429 (USA)*Zeta/P.2 (Brazil)Delta/B.1.617.2 (India)Theta/P.3 (Philippines) Kappa/B.1.617.1 (India)Lambda/C.37 (Peru) Mu/B.1.621 (Colombia) Omicron/B.1.1.529 + BA.1 (South Africa November 2021)BA.2BA.2.12.1 (United States)BA.4 (South Africa 11/21)BA.5 (South Africa 11/21)BA.2.75 (India 7/22)BQ.1BQ.1.1BN.1NoNo
Mexico7,174,464(ranked #19) 41,672 new infections in 14 days).330,743(ranked #5)218 new deaths in 14 days)5.45%NoNo
South Africa4,046,568(ranked #37; 4,347 new infections in 14 days).418102,568 (ranked #18) 104 new deaths in 14 days)6.66%B2 lineageAlpha/B.1.1.7 (UK)Beta/B.1.351 (SA)Delta/B.1.617.2 (India)Kappa/B.1.617.1 (India)       C.1.2 (South Africa, July 2021)Omicron/B.1.1.529 + BA.1 (South Africa November 2021)B.1.640.1 (Congo/France)BA.2BA.4 (South Africa 11/21)BA.5 (South Africa 11/21)NoNo
Canada4,440,839(ranked #34) 32,563 new infections in 14 days).48,353(ranked #25 ) 572  new deaths in the last 14 days11.56% NoNo
Poland6,360,843 (ranked #21; 6,993 new infections in 14 days). 604118,419 (ranked #15)87 new deaths in the last 14 days716.85%B2 lineageAlpha/B.1.1.7 (UK)Eta/B.1.525 (Nigeria/UK)Beta/B.1.351 (SA)Delta/B.1.617.2 (India)Mu/B.1.621 (Colombia)Omicron/B.1.1.529 + BA.1 + (South Africa November 2021),Omicron/B.1.1.529 +BA.3 NoNo
Russia21,701,321 (ranked #10), 103,708 new infections in 14 days).8,451 (ranked #10)392,891(ranked #4)831 new deaths in 14 days5914.88%NoNo
Peru4,405,843(ranked #35, 139,592 new infections in 14 days). 6,770 (ranked #11)217,821(ranked #6) 393 new deaths in the last 14 days3913.07%B2 lineageAlpha/B.1.1.7 (UK)Delta/B.1.617.2 (India)Gamma/P.1 (Brazil)Iota/B.1.526 (USA-NYC)Lambda/C.37 (Peru)Mu/B.1.621 (Colombia)Omicron/B.1.1.529 + BA.1 (South Africa November 2021)NoNo
Iran7,560,372(ranked #18; 635 new infections in last 14 days)49144,659(ranked #12) 25 new deaths in the last 14 days8.78%B2 lineageAlpha/B.1.1.7 (UK)Delta/B.1.617.2 (India)Beta/B.1.351 (SA)Omicron/B.1.1.529 + BA.1 (South Africa November 2021)NoNo
Spain13,651,239(ranked #12;   39,187 new infections in 14 days).2,656 (ranked #15)116,658 (ranked #16)577 new deaths in 14 days3229.21%B2 lineageAlpha/B.1.1.7 (UK)Delta/B.1.617.2 (India)Beta/B.1.351 (SA)Gamma/P.1 (Brazil)Epsilon/B.1.427 + B.1.429 (USA)*Eta/B.1.525 (Nigeria/UK)Iota/B.1.526 (USA-NYC)Kappa/B.1.617.1 (India)Mu/B.1.621 (Colombia)Omicron/B.1.1.529 + BA.1 (South Africa November 2021)B.1.640.1 (Congo/France)NoNo
France38,801,884 (ranked #3; 885,832 new infections in the last 14 days).56,361 (ranked #4)160,359 (ranked #10)1,333  new deaths in 14 days.13159.16%  a 1.35% increase in 14 days.B2 lineageAlpha/B.1.1.7 (UK)Delta/B.1.617.2 (India) Omicron/B.1.1.529 South Africa November 2021)B.1.640.1 (Congo/France)B.1.640.2 (Cameroon/France)GKA (AY.4/BA.1) recombinantBQ.1.1NoNo
Germany36,980,882(ranked #4; 450,862 new infections in 14 days.)34,308 (ranked #5)159,889 (ranked #11)1,776  new deaths in 14 days 14744.08%
0.54% increase in 14 days
B2 lineageAlpha/B.1.1.7 (UK)Delta/B.1.617.2 (India) Delta/B.1.617.2 (India) Omicron/B.1.1.529 South Africa November 2021)GKA (AY.4/BA.1) recombinantBQ.1.1NoNo
South Korea28,062,679 (ranked #6 906,866 new infections in 14 days).66,953(ranked #2)31,298 (ranked #35) 730  new deaths in 14 days6654.67%1.77% increase in 14 daysB2 lineageAlpha/B.1.1.7 (UK)Delta/B.1.617.2 (India) Delta/B.1.617.2 (India) Omicron/B.1.1.529 South Africa November 2021)NoNo
Vietnam11,522,431 (ranked #13; 5,942 new infections in 14 days).33343,179(ranked #26)11.64%B2 lineageAlpha/B.1.1.7 (UK)Delta/B.1.617.2 (India) Delta/B.1.617.2 (India) Omicron/B.1.1.529 South Africa November 2021)NoNo
Netherlands8,556,131 (ranked #16; 12,293 new infections in 14 days).86822,943 (ranked #41)49.71%B2 lineageAlpha/B.1.1.7 (UK)Delta/B.1.617.2 (India) Delta/B.1.617.2 (India) Omicron/B.1.1.529 South Africa November 2021)GKA (AY.4/BA.1) recombinantNoNo
Denmark3,157,132 (ranked #40) 8,922 new infections in 14 days. 5697,635(ranked #77  98 new deaths in the last 14 days)954.10%B2 lineageAlpha/B.1.1.7 (UK)Delta/B.1.617.2 (India) Delta/B.1.617.2 (India) Omicron/B.1.1.529 South Africa November 2021)GKA (AY.4/BA.1) recombinantNoNo


Taiwan8,547,306(ranked #17)218,306  new infections in 14 days15,407 (153,602ranked #9)14,820 (ranked #58 433 new deaths in the last 14 days)
2435.77%
0.41% of population has been infected in the last 14 days
B2 lineageAlpha/B.1.1.7 (UK)Delta/B.1.617.2 (India) Delta/B.1.617.2 (India) Omicron/B.1.1.529 South Africa November 2021)NoNo
Japan26,821,853(ranked #7)1,910,466 new infections in the last 14 days156,602(ranked #1)52,823(ranked #23)
2,997 new deaths in the last 14 days
18221.35%
1.52% of the population infected in the last 14 days.
B2 lineageAlpha/B.1.1.7 (UK)Delta/B.1.617.2 (India) Delta/B.1.617.2 (India) Omicron/B.1.1.529 South Africa November 2021)BA.2*BA.5*NoNo
Argentina9,766,975, (ranked #15)39,728 new infections in the last 14 days.130,041(ranked #14)21.22%NoNo
Italy24,884,034 (ranked #8) 556,370 new infections in the last 14 days.    183,138(ranked #8) 
1,405 new deaths in the last 14 days
41.29%
0.93% of population infected in last 14 days.
NoNo
Chile4,975,862(ranked #28) 50,811 new infections in14 days..4,009 (ranked#13)62,822(ranked #22) 
338 new deaths in the last 14 days.
2725.84%
0.56% of population infected in the last 14 days.
NoNo
Colombia6,330,843(ranked #22) 12,822 new infections in the last 14 days.141,996(ranked #13)12.28%
NoNo
Australia10,966,207(ranked #14) 240,968 new infections in 14 days.20,033 (ranked #7)16,673(ranked #55) 486 new deaths in 14 days.4242.06% 
0.82% of population infected in last 14 days.
NoNo
Turkey17,042,722(ranked #11)37,185 new infections in 14 days.101,492(ranked #19)   92 new deaths in 14 days..19.91%NoNo


Indonesia6,707,504 (ranked #20) 37,683 new infections in last 14 days.1,451160,362 (ranked #9)   478 new deaths in the last 14 days.2724.03%NoNo
Malaysia5,016,023 (ranked #27) 21,480 new infections in the last 14 days.1,13836,795 (ranked #29) 107 new deaths in the last 14 days.815.05%NoNo


Hong Kong2,323,123(ranked#44) 194,741 new infections in the last 14 days.15,726 (ranked #8)11,107 (ranked#64)345 new deaths in the last 14 days.3230.55%
2.57% of population infected in the last 14 days.
NoNo
China374,075 (ranked #98) 50,389 new infections in 14 days2,157 (ranked#19)

What Our Team Is Reading This Week

COVID-19

SARS-CoV-2 Update

It’s time for our next 14-day moving average determinations for SARS-CoV-2 for the United States and my thoughts on vaccines and mutant viruses. We use the WORLDOMETERS aggregators data set to make any projections since it includes data from the Department of Veterans Affairs, the U.S. Military, federal prisons and the Navajo Nation.

In the United States, SARS-CoV-2 deaths have decreased for the eleventh time in a 14-day period. There were 30 fewer deaths per day than in the last 14-day period. In the last 14 days, the number of infections has decreased by 947 infections per day.  Our infections per day are still high, probably secondary to SARS-CoV-2 mutant Delta/B.1.617.2. I would predict that the opening of schools, places of worship, bars, restaurants, indoor dining and travel all will contribute to further spread of SARS-CoV-2 mutants and rising numbers  in infections, hospitalizations and deaths in the coming months. Increased traveling as well as summer vacations, and the July 4 holiday will all cause further increases. Vaccinations, increased mask usage and social distancing, which are a part of the Biden SARS-CoV-2 plan (day 188 of plan) will be necessary to stop spread of mutants and cause  further reductions in infections, hospitalizations and deaths in the future. On 7/02/21, the United States had 18,399 new infections. There were also 322 deaths. The number of hospitalized patients is decreasing, but 3,866 patients are still seriously or critically ill. The number of critically ill patients has decreased by 294 in the last 14 days, while 3,785 new deaths occurred. The number of critically ill patients is decreasing for the sixth 14-day period, but a large number of patients are still dying each day (average 270/day). 

As of 7/02/21, we have had 621,161 deaths and 34,580,198 SARS-CoV-2 infections in the United States. We have had 188,327 new infections in the last 14 days. We are adding an average of 94,163 infections every 7 days. Each million infections usually results in 10,000 to 20,000 deaths. On 7/02/21, thirty-two states have had greater than 500,000 total infections, and 33 states have had greater than 5,000 total deaths. Ten states (Ohio, Michigan, Georgia, Illinois, New Jersey, Pennsylvania, Florida, Texas, New York and California) have had greater than 20,000 deaths. Four states (Florida, Texas, New York and California) have had greater than 35,000 deaths. In the world, 42 other countries have greater than 500,000 infections and 60 other countries have greater than 5,000 deaths.

On 11/20/20 in the United States, 3.70% of the population had a documented SARS-CoV-2 infection. California was ranked 41st in infection percentage at 2.77%. In North Dakota 9.18% of the population was infected (ranked #1), and in South Dakota 8.03% of the population was infected (ranked #2).

As of 7/02/21, in the United States, 10.38% of the population has had a documented SARS-CoV-2 infection. In the last 9 months, 7% of our country became infected with SARS-CoV-2. 

As of 7/02/21, California was ranked 38th in infection percentage at 9.66%. In North Dakota 14.53% of the population was infected (ranked #1), while Rhode Island was at 14.40% (ranked #2) and South Dakota was at 14.08% of the population infected (ranked #3). Thirty-three states have greater than 10% of their population infected and 42 states have greater than 9% of their population infected. Only one state has less than 3% of their population infected: Hawaii (2.67%).

The Threat of SARS-CoV-2 Variants

In a response for the need for “easy-to-pronounce and non-stigmatising labels,” at the end of May, the World Health Organization assigned a letter from the Greek alphabet to each SARS-CoV-2 variant. GISAID, Nextstrain, and Pango will continue to use the previously established nomenclature. For our purposes, we’ll be referring to each variant by both its Greek alphabet letter and the Pango nomenclature. 

The WHO has sorted variants into two categories: Variants of Concern (VOC) and Variants of Interest (VOI). The criteria for Variants of Concern are as follows:

  • Increase in transmissibility or detrimental change in COVID-19 epidemiology; or 
  • Increase in virulence or change in clinical disease presentation; or 
  • Decrease in effectiveness of public health and social measures or available diagnostics, vaccines, therapeutics.  

The WHO categorizes the following four variants as Variants of Concern (VOC):

The criteria for Variants of Interest (VOI) are as follows:

  • has been identified to cause community transmission/multiple COVID-19 cases/clusters, or has been detected in multiple countries; OR  
  • is otherwise assessed to be a VOI by WHO in consultation with the WHO SARS-CoV-2 Virus Evolution Working Group. 

The WHO categorizes the following six variants as Variants of Interest (VOI):

The two variants of concern that have garnered most of our attention recently are Alpha (B.1.1.7) and Delta (B.1.617.2). Alpha, first detected in the United Kingdom in September of 2020, has been detected in almost every country and all 50 states in the U.S. Up until this week, Alpha was the dominant variant in the United States, accounting for 60-70% of cases in May and early June.  

Alpha is more infectious than other previously circulating B2 lineage isolates. There are two deletions and six other mutations in its spike protein. One mutation involves a change of one amino acid, an asparagine at position 501 in the receptor binding motif with a tyrosine. This enhances binding (affinity) to the ACE-2 receptor and may alone be responsible for the increased infectivity of this isolate. A study published March 10 in the British Medical Journal (BMJ) found that the risk of death increased by 64% in patients infected with Alpha compared to all other isolates (known at the time). 

While Alpha continues to pose a threat, the increased prominence of the Delta variant (B.1.617.2), first identified in India, is a concern for several reasons. 

First, there is some evidence to suggest that Delta is more transmissible than other variants, including Alpha. This may be due to a mutation, P681R, near the furin cleavage site, and/or due to a deletion in the N-terminal domain (NTD) of the spike protein. In Australia, public health officials have described a handful of cases where transmission of the Delta variant occurred after “fleeting encounters”— five to ten seconds of close contact between strangers in a public place like a gym or a restaurant. 

Second, Delta leads to more severe infections. According to a recent study in Scotland, “Risk of COVID-19 hospital admission was approximately doubled in those with the Delta VOC when compared to the Alpha VOC.” 

Lastly, there is evidence of reduced vaccine effectiveness with Delta. The variant appears to be particularly evasive in people who have had only one dose of vaccine. A Scottish study estimated the vaccine effect against Delta after one dose to be 30% for the Pfizer vaccine and 18% for the AstraZeneca vaccine. After two doses, it was 79% for Pfizer and 60% for AstraZeneca. 

Considering these factors, it is not surprising that Delta is on track to overtake Alpha (B.1.1.7) as the dominant variant worldwide. In the past month, it accounted for 91% of isolations in India, 97% of isolations in the United Kingdom, 96% in Singapore, 90% in Russia, 99% in Israel, and 73% in Australia. In the United States, Delta is now the dominant variant; as of July 6, it accounted for 41.8% of isolations in the past four weeks, compared to 12.9% two weeks ago and 3.7% four weeks ago. This suggests the proportion of Delta cases is nearly doubling every week. 

Source: GISAID

To predict the potential impact of Delta in the U.S., one need only look across the pond. COVID-19 cases in Scotland (where 51% of the population is fully vaccinated) reached a record high last week, overwhelming hospitals and causing some to cancel elective surgeries and most outpatient care. In England, average daily COVID-19 hospital admissions have increased by 52% in the last week. ONS data also reveal a shift in the proportion of young people being hospitalized for COVID-19, with the number of hospitalized 15-24 year-olds increasing steadily since May. Meanwhile, the UK plans to end social distancing and mask mandates on July 19. (My daughter says this is where I should insert a facepalm emoji.)

In Israel, where 56% of the population have received two doses of the Pfizer vaccine, the Delta variant accounts for approximately 99% of cases over the past month. Israel’s health ministry now reports that the Pfizer vaccine is only 64% effective in preventing infection, compared to data from May (before Delta became dominant in Israel) that suggested the vaccine was 94% effective. Israel dropped its mask mandate on June 18, with exceptions for air travel and long-term healthcare facilities, but reinstated the mandate on June 28 after two school outbreaks

As of July 3, the CDC estimates that the Delta variant makes up 51% of US cases. The NY Times reports that nationwide, compared to the previous 14 days, COVID-19 cases are up 14%. One state getting hit particularly hard by Delta is Missouri, where Delta accounts for 73% of COVID-19 cases. As of July 5, new COVID-19 cases in Missouri were up 45% compared to the previous 14 days, hospitalizations were up 24%, and deaths were up 68%. Some Missouri hospitals have run out of ventilators. The NY Times reports that as of July 5, only 39% of Missouri residents have been fully vaccinated. In the 12-17 age group only 23% have been vaccinated. Missouri never implemented a state-wide mask mandate, and most local mask mandates were lifted at the end of May, along with distancing and capacity restrictions for businesses. All state workers in Missouri were directed to return to in-person work by May 17.  

Keeping in mind the potential of variants to evade vaccines, I believe it’s important that we pay attention to instances of vaccine failure. Prior to April 30, 2021, the CDC reported all breakthrough infections. From January 1, 2021 to April 30, 2021, there were 10,262 breakthrough infections, 27% of which were asymptomatic and 995 of which were hospitalized. Of the hospitalized patients, 160 (16%) died. 

Between May 1 and June 28, there were 4,686 breakthrough cases reported to the CDC that resulted in hospitalization or death. (The CDC no longer tracks breakthrough cases that do not result in hospitalization or death.) As of June 28, the CDC reports that 656 fully-vaccinated people have died of COVID-19. This means that 496 of those deaths occurred between May 1 and June 28. Whereas the period from January 1 to April 30 had an average of 40 COVID deaths per month in fully-vaccinated people, the period from May 1 to June 28 had an average of 248 deaths per month. This constitutes a 6-fold increase. We can’t say with certainty whether this increase in deaths is related to the rise in prevalence of the Delta variant, but there is certainly a correlation. Delta accounted for less than 1% of cases at the end of April, about 3% at the end of May, and an estimated 51% in the last two weeks of June. 

Indeed, reports of fully-vaccinated people infected with the Delta variant may become more common. Author John Pavlovitz recently described his family’s experience. Pavlovitz, his wife, and their 16 year-old son were all fully vaccinated, while their 11 year-old daughter was not yet eligible. Their daughter developed COVID-19 symptoms and tested positive while the family was traveling, and it presumably spread to the other three family members when they returned home to quarantine together. (However, there’s really no way of knowing which family member was the index case. For all we know, one of the vaccinated family members could have been infected asymptomatically and passed the virus to the daughter.) Pavlovitz and his wife both developed COVID-19 symptoms, and their son had an asymptomatic infection. Pavlovitz admits that they should have been more careful to prevent household transmission. They apparently did not wear masks in the house, even after they learned their daughter was infected. They thought that since they’d been vaccinated, they didn’t have to worry about being infected. 

The experience of the Pavlovitz family suggests that it is prudent for vaccinated people to follow the World Health Organization’s guidance on masking: everyone, regardless of vaccination status, should continue to wear a mask when gathering with folks from other households indoors, when in close contact with people who are unvaccinated, and when in close contact with people who may be infected. Some U.S. local public health agencies, like Los Angeles County, agree. 

Variants of (Slightly Less) Concern

At 2,284 cases, the United States has the second highest number of isolations of the Beta variant (B.1.351, first identified in South Africa), and 6 of these were in the last four weeks. The Beta variant now accounts for only 0.1% of isolations in the U.S., down from 0.3% two weeks ago. 

The United States still has the most isolations of the Gamma variant (P.1) in the world, with 18,391 overall and 527 in the past four weeks. Gamma accounted for 9.2% of isolations in the past month, down from 12.1% two weeks ago. 

The WHO has also recently labeled the Lambda variant (C.37), which was first identified in Peru in August of 2020, as a variant of interest. The United States has the second largest number of isolations of Lambda, after Chile, with 635 total and 17 in the past four weeks. Lambda causes over 80% of infections in Peru which experienced a surge in new cases this spring and, as of July 6, has had 2,069,051 infections and 193,588 deaths. Peru averaged 2,426 new cases per day over the last week. Strangely, a number of South American countries (Peru, Argentina, Colombia) have stopped reporting new isolations of Lambda to GISAID. 

COVID-19 in California

The following data were reported by the California Department of Public Health:

DateTotal CasesNew CasesTotal DeathsNew DeathsHospitalizedIn ICUFully Vaccinated
6/4/213,687,7361,04762,179871,06226017,662,712
6/5/213,688,8931,15762,242631,04224317,813,305
6/6/213,689,9941,10162,4702281,03522117,947,342
6/7/213,690,86887462,47331,01121918,011,744
6/8/213,691,66079262,47961,01522818,100,412
6/9/213,692,50684662,499201,03023118,240,912
6/10/213,693,36285662,538391,00123418,431,265
6/11/213,694,4981,13662,5935598223318,542,484
6/12/213,695,5301,03262,508-8595524018,637,504
6/13/213,696,47294262,512491524118,694,365
6/14/213,697,29982762,505-793923918,731,215
6/15/213,697,92762862,5151097725118,875,034
6/16/213,698,62669962,5341998124218,970,053
6/17/213,699,45582962,5653195623219,074,396
6/18/213,700,7501,29562,6225795123319,164,548
6/19/213,702,2371,48762,661391,27119,164,548
6/20/213,702,88264562,689281,24919,164,548
6/21/213,704,0051,12362,693492923819,343,396
6/22/213,704,64063562,701894924319,398,536
6/23/213,705,42778762,7414097828719,454,555
6/24/213,706,8461,41962,8228195527419,541,124
6/25/213,708,8612,01562,8906895927419,621,174
6/26/213,711,9283,06762,9596919,621,174
6/27/213,712,79586762,9903119,621,174
6/28/213,714,0511,25662,994498029019,880,275
6/29/213,714,81376262,99951,05028819,941,886
6/30/213,710,4542,01363,023241,08930720,014,043
7/1/213,712,1521,69863,096731,09030020,073,302
7/2/213,713,9441,79263,141451,07129520,073,302
7/3/213,715,3771,433*63,165241,07129520,073,302
7/4/213,716,8101,43363,189241,07129520,073,302
7/5/213,718,2431,43363,213241,07129520,073,302
7/6/213,719,6741,43363,238241,15329820,240,207
7/7/213,721,0061,33263,259211,22829920,296,653

*Data for 7/3/21-7/6/21 were reported in bulk on 7/6/21. We’ve divided the new cases evenly among the four days. 

California dropped its mask mandate and most public space capacity limits on June 15. Over the past two weeks, daily new cases in California have hovered between 635 and 3,067. The two-week high for daily new cases occurred on June 26. More than 1,200 Californians are still hospitalized with COVID-19, with nearly 300 of those in the ICU. Since the beginning of July, 236 Californians have died of COVID-19. 

Age of Confirmed COVID-19 Cases

Date0-17 yrs Total0-17 New Cases18-49 yrs Total18-49 New Cases50-64 yrs Total50-64 New Cases65+ yrs Total65+ New CasesUnknown TotalUnknown New Cases
6/4/21480,5561702,114,286621700,579150390,0211112,294-5
6/5/21480,7431872,114,961675700,764185390,1351142,290-4
6/6/21480,9762332,115,563602700,952188390,210752,2933
6/7/21481,1501742,116,061498701,074122390,290802,2930
6/8/21481,2861362,116,510449701,212138390,359692,2930
6/9/21481,4331472,116,998488701,346134390,436772,2930
6/10/21481,5761432,117,480482701,491145390,522862,2930
6/11/21481,7721962,118,129649701,671180390,6371152,289-4
6/12/21481,9651932,118,723594701,826155390,722852,2945
6/13/21482,1261612,119,276553701,972146390,812902,286-8
6/14/21482,2911652,119,756480702,101129390,866542,285-1
6/15/21482,4061152,120,111355702,212111390,912462,2861
6/16/21482,5241182,120,523412702,312100390,983712,284-2
6/17/21482,6631392,121,032509702,429117391,045622,2862
6/18/21482,8752122,121,782750702,635206391,1701252,2882
6/21/21483,4305552,123,7291,947703,148391,4072,291
6/22/21483,5631332,124,094365703,24597391,455482,283-8
6/23/21483,6941312,124,566472703,375130391,507522,2852
6/24/21483,8751812,125,416850703,600225391,6521452,30318
6/25/21484,1112362,126,6051,189703,957357391,8702182,31815
6/28/21484,9007892,129,6313,026704,847890392,3384682,35537
6/29/21485,0751752,130,090459704,93891392,372342,338-17
7/1/21484,86802,128,8900704,2430391,84702,304-34
7/2/21485,1482802,130,0491,159704,468225391,9771302,302-2
7/3/21485,4042562,130,959911704,658189392,053762,3020
7/4/21485,6602562,131,870911704,847189392,129762,3020
7/5/21485,9162562,132,781911705,036189392,205762,3020
7/6/21486,1722562,133,692911705,225189392,281762,3042
7/7/21486,3711992,134,547855705,414189392,368872,3062

An examination of cases broken down by age group reveals that the 18-49 age group continues to have the highest rate of infection. There was a marked increase in new daily cases in this age group from June 15 to June 18, with moderate increases for the other three age groups. 

Despite the availability of vaccines for children 12 and up, in California, we have not seen a marked decrease in the number of new cases in children over the past two weeks. From June 19 to July 2, the 0-17 age group averaged 276 new infections per day, a 69% increase compared to the previous 14-day period. (The daily average for June 4-18 was 163.) As of June 30, the California Department of Public Health reports 4 COVID-19 deaths in children under the age of 5 and 19 deaths in children ages 5-17. To date, 486,371 children in California have been infected with COVID-19. The US Census Bureau estimates that there are 8,890,250 children in California, so approximately 5.4% of children have had a documented case of COVID-19.

Watching World Data

Over the next few months, we’ll be paying close attention to correlations between the SARS-CoV-2 data, the number of isolates identified in various countries and states, and the non-pharmaceutical interventions (like mask mandates and lockdowns) put in place by state and national governments. Data on infections, deaths, and percent of population infected was compiled from Worldometers. Data for this table for SARS-CoV-2 Isolates Currently Known in Location was compiled from GISAID and the CDC. It’s worth noting that GISAID provided more data than the CDC.

LocationTotal Infections as of 7/02/21New Infections on 7/02/21Total DeathsNew Deaths on 7/02/21% of Pop.InfectedSARS-CoV-2 Isolates Currently Known in LocationNational/ State Mask Mandate?Currently in Lockdown?
World183,836,958(5,248,302 new infections in 14 days)437,5483,979,868(113,224 new deaths in 14 days)8,4952.35%B2 lineageAlpha/B.1.1.7 (UK)Eta/B.1.525 (Nigeria/UK)Iota/B.1.526 (USA-NYC)Beta/B.1.351 (SA)Epsilon/B.1.427 + B.1.429 (USA)*Gamma/P.1 (Brazil)Zeta/P.2 (Brazil)A lineage isolateV01.V2 (Tanzania)APTK India VOC 32421Delta/B.1.617.2 (India)BV-1 (Texas, USA)Kappa/B.1.617.1 (India)Lambda/C.37 (Peru)Theta/P.3 (Philippines) NoNo
USA34,580,198
(ranked #1)
18,399
621,161
(ranked #1)
32210.38%B2 lineageAlpha/B.1.1.7 (UK)Eta/B.1.525 (Nigeria/UK)Iota/B.1.526 (USA-NYC)Beta/B.1.351 (SA)Epsilon/B.1.427 + B.1.429 (USA)*Gamma/P.1 (Brazil)Zeta/P.2 (Brazil)Delta/B.1.617.2 (India)BV-1 (Texas, USA)Theta/P.3 (Philippines) Theta/P.3 (Philippines) Kappa/B.1.617.1 (India)Lambda/C.37 (Peru)NoNo
Brazil18,687,469(ranked #3)   65,165(ranked #1) 522,068(ranked #2)1,8798.72%B2 lineageAlpha/B.1.1.7 (UK)Beta/B.1.351 (SA)Gamma/P.1 (Brazil)Zeta/P.2 (Brazil)Lambda/C.37 (Peru)NoNo
India30,501,189(ranked #2)47,252(ranked #2)401,068(ranked #3)7872.18%B2 lineageAlpha/B.1.1.7 (UK)Beta/B.1.351 (SA)Epsilon/B.1.427 + B.1.429 (USA)*Eta/B.1.525 (Nigeria/UK)APTK India VOC 32421Delta/B.1.617.2 (India)Kappa/B.1.617.1 (India)NoNo
United Kingdom4,855,169(ranked #7)27,125128,189277.11%B2 lineageAlpha/B.1.1.7 (UK)Eta/B.1.525 (Nigeria/UK)Beta/B.1.351 (SA)Epsilon/B.1.427 + B.1.429 (USA)*Gamma/P.1 (Brazil)Delta/B.1.617.2 (India)Theta/P.3 (Philippines) Kappa/B.1.617.1 (India)Lambda/C.37 (Peru)NoNo
California, USA3,700,750(ranked #13 in world)1,29562,622579.66%B2 lineageAlpha/B.1.1.7 (UK)Eta/B.1.525 (Nigeria/UK)Beta/B.1.351 (SA)Gamma/P.1 (Brazil)Epsilon/B.1.427 + B.1.429 (USA)*Zeta/P.2 (Brazil)Delta/B.1.617.2 (India)Theta/P.3 (Philippines) Kappa/B.1.617.1 (India)Lambda/C.37 (Peru) NoNo
Mexico2,525,350(ranked #15)6,081233,248(ranked #4)2011.93%B2 lineageAlpha/B.1.1.7 (UK)Epsilon/B.1.427 + B.1.429 (USA)*Gamma/P.1 (Brazil)Delta/B.1.617.2 (India)Kappa/B.1.617.1 (India)Lambda/C.37 (Peru)NoNo
South Africa2,019,826(ranked #19)24,270621,3223033.36%B2 lineageAlpha/B.1.1.7 (UK)Beta/B.1.351 (SA)Delta/B.1.617.2 (India)Kappa/B.1.617.1 (India)NoNo
Canada1,416,317(ranked #24)1,00726,338433.72%B2 lineageAlpha/B.1.1.7 (UK)Eta/B.1.525 (Nigeria/UK)Epsilon/B.1.427 + B.1.429 (USA)*Gamma/P.1 (Brazil)Delta/B.1.617.2 (India)Kappa/B.1.617.1 (India)Lambda/C.37 (Peru)Yes, except Alberta ProvinceNo
Poland2,880,4107(ranked #14)9675,065217.61%B2 lineageAlpha/B.1.1.7 (UK)Eta/B.1.525 (Nigeria/UK)Beta/B.1.351 (SA)Delta/B.1.617.2 (India)NoNo
Turkey5,435,831(ranked #6)4,89149,829276.37%B2 lineageAlpha/B.1.1.7 (UK)Eta/B.1.525 (Nigeria/UK)Beta/B.1.351 (SA)Epsilon/B.1.427 + B.1.429 (USA)*Gamma/P.1 (Brazil)Lambda/C.37 (Peru)NoNo
Russia5,561,360(ranked #5)23,218                                                  136,5656793.80%B2 lineageAlpha/B.1.1.7 (UK)Beta/B.1.351 (SA)Delta/B.1.617.2 (India)NoNo
Argentina4,512,439(ranked #8)20,88895.3826109.69%B2 lineageAlpha/B.1.1.7 (UK)Eta/B.1.525 (Nigeria/UK)Beta/B.1.351 (SA)Epsilon/B.1.427 + B.1.429 (USA)*Gama/P.1 (Brazil)Delta/B.1.617.2 (India)Lambda/C.37 (Peru)NoNo
Colombia4,512,302(ranked #9)28,005107,72355868.35%B2 lineageAlpha/B.1.1.7 (UK)Beta/B.1.351 (SA)Gamma/P.1 (Brazil)Epsilon/B.1.427 + B.1.429 (USA)*Iota/B.1.526 (USA-NYC)Lambda/C.37 (Peru)NoNo
Peru2,060,344(ranked #18)2,790192,902(ranked #5)2156.16%B2 lineageAlpha/B.1.1.7 (UK)Gamma/P.1 (Brazil)Iota/B.1.526 (USA-NYC)Lambda/C.37 (Peru)NoNo
Indonesia2,228,938(ranked #17)25,83059,53453910.8%B2 lineageAlpha/B.1.1.7 (UK)Delta/B.1.617.2 (India)Beta/B.1.351 (SA)Eta/B.1.525 (Nigeria/UK)Theta/P.3 (Philippines) Iota/B.1.526 (USA-NYC)Kappa/B.1.617.1 (India)NoNo
*Also referred to as CAL.20C


SARS-CoV-2, Children, and MIS-C/PIMS

I’m pleased to see that COVID-19 cases and MIS-C (PIMS) cases in children in the US are finally getting national attention. The CDC now tracks total MIS-C cases and deaths in children and young adults up to 20 years old in the United States. As of June 28, CDC reported 4,196 cases of MIS-C that meet the case definition and 37 deaths—that’s 178 new cases and one new death since the June 2 report. The CDC notes, “As of October 1, the number of cases meeting the case definition for multisystem inflammatory syndrome in children (MIS-C) in the United States surpassed 1,000. As of February 1, this number surpassed 2,000, and exceeded 3,000 as of April 1.” This means it took seven months to reach 1,000 MIS-C cases, only four months to reach an additional 1,000 cases, and only two months to add an additional 1,185 cases. This suggests to us that variants are causing more MIS-C. 

Date of ReportingTotal MIS-C PatientsChange Since Last ReportTotal MIS-C DeathsChange Since Last Report
6/28/20214196+17837+1
6/2/20214018+27636+1
5/3/20213742+55735-1
3/29/20213185+56836+3
3/1/2021261733

Schools in the United States have been open throughout the pandemic, with teachers and education support professionals demonstrating their extraordinary ability to adapt in adverse circumstances. Teachers all over the country reinvented their teaching, taking their classrooms online in order to provide safe and remote learning experiences for students. The so-called “reopening” of schools, which more accurately refers to the opening of school buildings, as schools never closed, has been highly politicized, with many governors issuing mandates for in-person instruction, even as case counts, hospitalizations, and deaths in their states rose exponentially. The CDC has maintained that transmission risk in schools is minimal, provided that adequate safety measures are taken; however, we know that many states have not properly enforced universal masking (and some are repealing mask mandates this week), and we know that many school facilities are not equipped with the proper air handling systems. With more school buildings opening, there is a growing body of research that suggests that COVID-19 transmission can and does happen in schools. 

After recommending for months that school buildings be open, in mid-February (a year into the pandemic), The American Academy of Pediatrics, in collaboration with the Children’s Hospital Association, finally began tracking data on COVID-19 in children at the state and national level. Data reporting by states is still voluntary, and every state is different in its willingness to collect and disclose data on infections, hospitalizations, deaths, and testing rates in children. 

As of the APA’s July 1 report, only 11 states provide age distribution for testing. This makes it difficult to hold states accountable for testing each age group in proportion to its population. We’ve seen a trend in states where testing data with age distribution is available that children are tested at lower rates than adults. Hospitalization data by age group is only available in 24 states and New York City, so we only understand the severity of COVID-19 infections in children for about half the country. Age distribution for cases is provided by 49 states, New York City, the District of Columbia, Puerto Rico, and Guam. Age distribution for deaths is provided in 43 states, New York City, Puerto Rico, and Guam. It’s worth noting that New York State does not provide age data for cases, testing, hospitalizations, and deaths. Two states, Florida and Utah, only report cases in children aged 0-14, so the number of cases, hospitalizations, and deaths in children ages 15-17 is unknown in these states. 

As of July 1, children represented 14.2% of all COVID-19 cases reported to APA. A total of 335 child deaths due to COVID-19 were reported in 43 states. The following states do not report child mortality due to COVID-19: Michigan, Montana, New Mexico, New York, Rhode Island, South Carolina, and West Virginia. 

If we truly want to keep children safe, especially as many school buildings open for in-person instruction, we need to collect more complete data in every state on child testing rates, cases, hospitalizations, and deaths.

Vaccinating America’s Children

The New York Times reports that nationally, 55.6% of people 12 and up are fully vaccinated, while 58.4% of people 18 and up are fully vaccinated, according to the CDC. Only 47.5% of the total population is fully vaccinated. 

Some states are falling far behind when it comes to getting children—and the general population—fully vaccinated. Alabama and Mississippi have only fully vaccinated 33% of their population. Vermont, Maine, Massachusetts, and Connecticut have fully vaccinated more than 60% of their population, with Vermont having the highest vaccination rate at 74%. California has fully vaccinated 51% of their population. 

The Road Ahead

President Biden has made the pandemic a first priority and has now ordered enough vaccines to vaccinate everyone who wants a vaccination by the end of this month. As of 7/7/21, the CDC reports that 182.8 million people (approximately 55.1% of the population) have had one dose of any vaccine. 157.9 million people (47.6% of the population) are fully vaccinated. The rate of people who are fully vaccinated has increased by less than 3% in the past two weeks. 

As of May 10, all people in the U.S. over the age of 12 are eligible to receive a vaccine. The Biden administration has already exceeded its goal of administering 200 million doses of vaccine in the first 100 days of the administration. The Pfizer-BioNtech is already approved for ages 12-15 and the Moderna vaccine should be approved in June 2021. Moderna has applied for emergency use authorization to administer their mRNA vaccines to children aged 12-15. Testing is ongoing for children in younger age groups and may be approved for ages 2-11 by the end of September 2021. 

Testing, wearing masks, social distancing and washing our hands frequently should no longer be political issues. These are non-pharmaceutical interventions used by most successful countries and some states to protect their citizens and their economies. New Zealand, Taiwan, and Australia are three countries that have done this successfully. In the United States, Hawaii is doing a better job handling the pandemic than many of our states. These interventions and vaccination should keep the pandemic from overwhelming our health care delivery systems world-wide. New mutations like Epsilon/B.1.427 + B.1.429 and the Alpha, Beta, Gamma, and Delta variants will probably spread rapidly throughout the United States over the next 90 days as many states (ex. Texas, Florida, Iowa, Mississippi, Wyoming and South Carolina) open up everything and do away with masking and social distancing. We will probably see increased new infections per day in the United States. In the UK, Alpha/B.1.1.7, has increased the number of infections, hospitalizations and deaths. This and other mutants may do the same thing in the USA.

The Pfizer and Moderna RNA vaccines and the Johnson & Johnson single dose vaccination adenovirus vaccine are all being used to immunize people in the USA. The Oxford-AstraZeneca vaccine and the Novavax vaccine may be available in the fourth quarter of 2021. 

The bad news is that all currently available vaccines are based on the spike protein sequence identified in China in December 2019. Mutated isolates, as discussed above, may overtake our ability to produce new vaccines and vaccinate the populace. Like Influenza vaccines, we may have to reformulate vaccines based on active, worldwide surveillance at least every 4 to 6 months. The FDA is currently putting together a guidance document for how to develop booster vaccines for SARS-CoV-2 mutations. A surrogate marker of protection like antibody to the mutated Receptor Binding Domains of SARS-CoV-2 should be considered for vaccine approval. 

The ideal approach to addressing the major mutations on at least five continents would be to make vaccines against each of the mutations. I’d get all of the vaccine companies and contract production companies on a call and “suggest” that two companies at least make and mass produce one of the four mutations. The government would pay the cost and buy at least 200 million doses in advance for each variant at say $40 a dose. The total cost to purchase the vaccine (800 million doses) would only be 32 billion dollars. Give each company a billion dollars each for development costs (another 8 billion dollars). Spend another two billion dollars for syringes and you’ve got enough booster doses to vaccinate 200 million people for all 4 variants. 42 billion dollars would be a small price to pay to catch up with the current mutations. Even if you had to do this every two years, it would be well worth the dollars spent. 

We are not doing adequate numbers of PCR or antigen detection assays in the United States. According to JHU, in January of 2021, we were doing up to 2,307,949 tests per day. In March 2021, the highest number of tests per day was 1,709,210, and in April, the highest number of tests per day was 2,008,319. Currently, we’re doing 444,718 tests per day (7-day moving average); that’s 1,563,601 fewer tests per day than the April high. 

We still need to perform more virus isolations and perform more DNA sequencing of viruses in each country, state, populous city, and county if we are to rapidly identify new mutations. In December 2020, WHO asked countries to increase their sequencing rates, and the European Commission asked member states to set a goal of 10%. The CDC then set a goal of 5% for the United States. At the end of June 2021, the United States had a SARS-CoV-2 genome sequencing rate of 1.69%, whereas the United Kingdom had a genome sequencing rate of 10.2%. I’m more hopeful that we will have the facilities, the equipment, and the trained staff needed to perform this work. As a nation we still need to make and distribute more vaccines to other countries, new vaccines directed against mutants, and the necessary rapid tests and protective equipment needed by medical staff, first responders, essential workers and especially teachers and students. I’m still hopeful we can work together on our and the world’s infectious disease problems. 

What Our Team Is Reading This Week

COVID-19

SARS-CoV-2 Update

It’s time for our next 14-day moving average determinations for SARS-CoV-2 for the United States and my thoughts on vaccines and mutant viruses. We use the WORLDOMETERS aggregators data set to make any projections since it includes data from the Department of Veterans Affairs, the U.S. Military, federal prisons and the Navajo Nation.

In the United States, SARS-CoV-2 deaths have decreased for the eighth time in a 14-day period. There were 137 fewer deaths per day than in the last 14-day period. In the last 14 days, the number of infections has decreased by 12,293 infections per day.  Our infections per day are still high, probably secondary to SARS-CoV-2 mutants, to include the Alpha/B.1.1.7 isolate, the Iota/B.1.526 isolate, the Epsilon/B.1.427 + B.1.429 isolate, the Beta/B.1.351 isolate, the Gamma/P.1 and Zeta/P.2 isolates, and the new isolate, Deta/B.1.617+. I would predict that the opening of schools, places of worship, bars, restaurants, indoor dining and travel all will contribute to further spread of multiple SARS-CoV-2 mutants and rising numbers  in infections, hospitalizations and deaths in the coming months. Increased traveling as well as summer vacations, and the July 4 holiday will all cause further increases. Vaccinations, increased mask usage and social distancing, which are a part of the Biden SARS-CoV-2 plan (day 136 of plan) will be necessary to stop spread of mutants and cause  further reductions in infections, hospitalizations and deaths in the future. On 6/04/21, 16,925 new infections occurred in the United States. There were also 520 deaths. The number of hospitalized patients is decreasing, but 5,631 patients are still seriously or critically ill. The number of critically ill patients has decreased by 1,761 in the last 14 days, while 6,577 new deaths occurred. The number of critically ill patients is decreasing for the fourth 14-day period, but a large number of patients are still dying each day. 

As of 6/04/21, we have had 612,249 deaths and 34,192,023 SARS-CoV-2 infections in the United States. We have had 271,267 new infections in the last 14 days. We are adding an average of 135,633 infections every 7 days. Each million infections usually results in 10,000 to 20,000 deaths. On 6/04/21, twenty-two states have had greater than 500,000 total infections, and 33 states have had greater than 5,000 total deaths. Nine states (Michigan, Georgia, Illinois, New Jersey, Pennsylvania, Florida, Texas, New York and California) have had greater than 20,000 deaths. Four states (Florida, Texas, New York and California) have had greater than 35,000 deaths.

For comparison, on 11/20/20 in the United States, 3.70% of the population had a documented SARS-CoV-2 infection. California was ranked 41st in infection percentage at 2.77%. In North Dakota 9.18% of the population was infected (ranked #1), and in South Dakota 8.03% of the population was infected (ranked #2).

As of 6/04/21, in the United States, 10.32% of the population has had a documented SARS-CoV-2 infection. In the last 6 months, over 6% of our country became infected with SARS-CoV-2. 

As of 6/04/21, California was still ranked 36th in infection percentage at 9.60%. In North Dakota 14.45% of the population was infected (ranked #1), while Rhode Island was at 14.34% (ranked #2) and South Dakota was at 14.04% of the population infected (ranked #3). Thirty-one states have greater than 10% of their population infected and 42 states have greater than 9% of their population infected. Only one state has less than 3% of their population infected: Hawaii (2.52%).

New Mutants

In a response for the need for “easy-to-pronounce and non-stigmatising labels,” at the end of May, the World Health Organization assigned a letter from the Greek alphabet to each SARS-CoV-2 variant. GISAID, Nextstrain, and Pango will continue to use the previously established nomenclature. For our purposes, we’ll be referring to each variant by both its Greek alphabet letter and the Pango nomenclature. 

The WHO has sorted variants into two categories: Variants of Concern (VOC) and Variants of Interest (VOI). The criteria for Variants of Concern are as follows:

  • Increase in transmissibility or detrimental change in COVID-19 epidemiology; or 
  • Increase in virulence or change in clinical disease presentation; or 
  • Decrease in effectiveness of public health and social measures or available diagnostics, vaccines, therapeutics.  

The WHO categorizes the following four variants as Variants of Concern (VOC):

The criteria for Variants of Interest (VOI) are as follows:

  • has been identified to cause community transmission/multiple COVID-19 cases/clusters, or has been detected in multiple countries; OR  
  • is otherwise assessed to be a VOI by WHO in consultation with the WHO SARS-CoV-2 Virus Evolution Working Group. 

The WHO categorizes the following six variants as Variants of Interest (VOI):

A new mutant SARS-CoV-2 virus (lineage B.1.1.7, now referred to by WHO as Alpha), first seen in the UK in September 2020, has now been found in multiple other countries. This isolate has now been found in 50 states and the District of Columbia. This isolate is more infectious than other previously circulating B2 lineage isolates. There are two deletions and six other mutations in its spike protein. One mutation involves a change of one amino acid, an asparagine at position 501 in the receptor binding motif with a tyrosine. This enhances binding (affinity) to the ACE-2 receptor and may alone be responsible for the increased infectivity of this isolate. A study published March 10 in the British Medical Journal (BMJ) found that the risk of death increased by 64% in patients infected with the B.1.1.7 variant compared to all other isolates. Due to air and other travel, this isolate will become the dominant isolate worldwide. 

On 4/10/21, the CDC stopped providing data to the public on the number of reported cases of all variants of SARS-CoV-2, both nationally and by state. This data used to be available at https://www.cdc.gov/coronavirus/2019-ncov/transmission/variant-cases.html. The CDC claims that the data is available in its COVID-19 Data Tracker, but only percentages, not actual case numbers, are available, and the data ends on May 8, 2021.   

Luckily, GISAID is still reporting variant data. The United States has had more isolations of the Alpha variant (B.1.1.7) in the last four weeks (9,795) than any other country in the world, to include the United Kingdom. There have been a total of 160,842 cases of Alpha/B.1.1.7 identified in the US to date. (See chart below.)

At 1,842 cases, the United States has the fourth highest number of isolations of the Beta variant (B.1.351, first identified in South Africa), and 76 of these were in the last four weeks. 

And the United States has now surpassed Brazil for the most isolations of the Gamma variant (P.1) in the world, with 12,887 overall and 1,527 in the past four weeks. 

As for the Delta Variant (B.1.617+), the variant recently identified in India, only India and the United Kingdom have more isolated cases than in the United States, which has 1,888 total cases, 546 of which were identified in the last four weeks. 

The United States has also surpassed both the UK and Nigeria for the most isolations of the Eta varian (B.1.525) in the world, with 1,064 overall and 32 in the past four weeks. 

A disturbing report out of the UK has found a second mutation in Alpha/B.1.1.7. This mutation, which occurs in the loop sequence, has also been found in the Beta/B.1.351 and Gamma/P.1 variants. (The loop sequence is in the receptor binding motif in the receptor binding domain of the S1 sequence of the spike protein.) This mutation involves a change of one amino acid of the spike protein, number 484, from glutamic acid to lysine. This point mutation allows the virus to bind better to the ACE2 receptor, which increases infectivity. People who are exposed to one of these variants (versus the old B2 isolate) are more likely to be infected and are more likely to transmit the virus to others. 

In our last three updates we summarized a research letter published in Clinical Infectious Diseases about a patient in the UK who was first infected in April with a B2 isolate and experienced only mild symptoms but was infected with the new Alpha/B.1.1.7 variant in December and became critically ill. The patient described in this research letter was not protected by a natural infection with a B2 lineage SARS-CoV-2 isolate in April 2020 from having a potentially lethal second infection with a B.1.1.7 lineage variant in December 2020, suggesting that folks who have had a past SARS-CoV-2 infection should not expect to have any immunity to new variants such as Alpha/B.1.1.7. All of the currently available vaccines were developed with spike protein from B2 lineages. Moderna, Pfizer, and AstraZeneca/Oxford are currently remaking their spike protein vaccines to address the mutations in the South African variant of SARS-CoV-2 because the AstraZeneca/Oxford vaccine did not work in a small trial in South Africa, where most of the patients had the Beta/B.1.351 mutant. 

New Mutant Delta/B.1.617+ Arrives in California

Stanford University announced five weeks ago that they have identified five infections with the Delta/B.1.617+ variant in the San Francisco Bay Area. There are actually three different B.1.617 variants: B.1.617.1, B.1.617.2 and B.1.617.3. The most common variant appears to be B.1.617.2. This isolate is a double-mutant responsible for greater than 50% of the infections in India. The data from India the last 14 days ending on 6/04/21 is still disturbing. India has had 2,541,685 infections in the last 14 days or an average of 181,549 infections per day. During this 14-day period India reported 59,354 deaths or 4,240 deaths per day. On May 21, 2021, India reported 121,476 new infections and 3,382 new deaths. On 6/04/21 the total deaths due to SARS-CoV-2 infections in India stood at 344,101. India, with a population of 1,390,456,911, has had only 2.06% of the country infected. Their hospitals are still running out of vaccines, oxygen, medications, beds and ventilators. Sadly a health disaster continues in the world’s most populous country. I would predict that prior SARS-CoV-2 infection in India or first generation SARS-CoV-2 vaccines will have a decreased effect on this mutant discussed in the next paragraph. 

Many of you may now be familiar with the E484K mutation present in the Beta/B.1.351 isolate, the Gamma/P.1 isolate, the Iota/B.1.526 isolate, and the double mutant Eta/B.1.525. When vaccine manufacturers make booster vaccines to address these variants, they will only account for the E484K mutation. What sets this Delta/B.1.617+ variant apart from the other variants is that it has a different point mutation at amino acid 484 that involves a change of one amino acid of the spike protein, number 484, from glutamic acid to glutamine (E484Q). This point mutation, like E484K, probably allows the virus to bind to the ACE2 receptor and evade neutralizing antibodies directed against the original Wuhan sequence. A vaccine created to address E484K would not address this isolate. 

The second mutation in Delta/B.1.617+ is L452R, which is one of the same mutations seen in Epsilon/B.1.427 + B.1.429. This mutation is also not being covered by any vaccine currently being made as a booster. It’s possible that people in California who were infected by the Epsilon mutant in the last six months might have some additional cross protective antibodies to Delta/B.1.617+.

Watching the Data

Over the next few months, we’ll be paying close attention to correlations between the SARS-CoV-2 data, the number of isolates identified in various countries and states, and the non-pharmaceutical interventions (like mask mandates and lockdowns) put in place by state and national governments. Data on infections, deaths, and percent of population infected was compiled from Worldometers. Data for this table for SARS-CoV-2 Isolates Currently Known in Location was compiled from GISAID and the CDC. It’s worth noting that GISAID provided more data than the CDC, whose most recent data on variants is from May 8. 

LocationTotal Infections as of 6/04/21New Infections on 6/04/21Total DeathsNew Deaths on 5/21/21% of Pop.InfectedSARS-CoV-2 Isolates Currently Known in LocationNational/ State Mask Mandate?Currently in Lockdown?
World173,713,909400,0753,736,0999,2832.22%B2 lineageAlpha/B.1.1.7 (UK)Eta/B.1.525 (Nigeria/UK)Iota/B.1.526 (USA-NYC)Beta/B.1.351 (SA)Epsilon/B.1.427 + B.1.429 (USA)*Gamma/P.1 (Brazil)Zeta/P.2 (Brazil)A lineage isolateV01.V2 (Tanzania)APTK India VOC 32421Delta/B.1.617+ (India)BV-1 (Texas, USA)NoNo
USA34,192,023
(ranked #1)
16,925
612,240
(ranked #1)
52010.32%B2 lineageAlpha/B.1.1.7 (UK)Eta/B.1.525 (Nigeria/UK)Iota/B.1.526 (USA-NYC)Beta/B.1.351 (SA)Epsilon/B.1.427 + B.1.429 (USA)*Gamma/P.1 (Brazil)Zeta/P.2 (Brazil)Delta/B.1.617+ (India)BV-1 (Texas, USA)NoNo
Brazil16,841,954(ranked #3)   38,482(ranked #2) 470,968(ranked #2)1,1847.87%B2 lineageAlpha/B.1.1.7 (UK)Beta/B.1.351 (SA)Gamma/P.1 (Brazil)Zeta/P.2 (Brazil)NoNo
India28,693,835(ranked #2)121,476(ranked #1)344,101(ranked #3)3,3822.06%B2 lineageAlpha/B.1.1.7 (UK)Beta/B.1.351 (SA)Epsilon/B.1.427 + B.1.429 (USA)*Eta/B.1.525 (Nigeria/UK)APTK India VOC 32421Delta/B.1.617+ (India)NoNo
United Kingdom4,506,016(ranked #7)6,238127,823116.60%B2 lineageAlpha/B.1.1.7 (UK)Eta/B.1.525 (Nigeria/UK)Beta/B.1.351 (SA)Epsilon/B.1.427 + B.1.429 (USA)*Gamma/P.1 (Brazil)Delta/B.1.617+ (India)NoNo
California, USA3,794,271(ranked #10 in world)1,12963,395529..60%B2 lineageAlpha/B.1.1.7 (UK)Beta/B.1.351 (SA)Epsilon/B.1.427 + B.1.429 (USA)*Zeta/P.2 (Brazil)Delta/B.1.617+ (India)NoNo
Mexico2,426,822(ranked #15)2,894228,362(ranked #4)2161.86%B2 lineageAlpha/B.1.1.7 (UK)Epsilon/B.1.427 + B.1.429 (USA)*Gamma/P.1 (Brazil)Delta/B.1.617+ (India)NoNo
South Africa1,686,041(ranked #19)5,66856,832672.81%B2 lineageAlpha/B.1.1.7 (UK)Beta/B.1.351 (SA)Delta/B.1.617+ (India)NoNo
Canada1,389,508(ranked #23)2,06325,679353.65%B2 lineageAlpha/B.1.1.7 (UK)Eta/B.1.525 (Nigeria/UK)Epsilon/B.1.427 + B.1.429 (USA)*Gamma/P.1 (Brazil)Delta/B.1.617+ (India)Yes, except Alberta ProvinceNo
Poland2,874,409(ranked #14)31774,101267.60%B2 lineageAlpha/B.1.1.7 (UK)Eta/B.1.525 (Nigeria/UK)Beta/B.1.351 (SA)Delta/B.1.617+ (India)NoNo
Turkey5,276,,468(ranked #5)6,16947,976946.19%B2 lineageAlpha/B.1.1.7 (UK)Eta/B.1.525 (Nigeria/UK)Beta/B.1.351 (SA)Epsilon/B.1.427 + B.1.429 (USA)*Gamma/P.1 (Brazil)NoNo
Russia5,108,129(ranked #6)8,947                                                   123,0373773.49%B2 lineageAlpha/B.1.1.7 (UK)Beta/B.1.351 (SA)Delta/B.1.617+ (India)NoNo
Argentina3,915,397(ranked #9)30,95080,4115388.59%B2 lineageAlpha/B.1.1.7 (UK)Eta/B.1.525 (Nigeria/UK)Beta/B.1.351 (SA)Epsilon/B.1.427 + B.1.429 (USA)*Gama/P.1 (Brazil)Delta/B.1.617+ (India)NoNo

*Also referred to as CAL.20C

SARS-CoV-2, Children, and MIS-C/PIMS

I’m pleased to see that COVID-19 cases and MIS-C (PIMS) cases in children in the US are finally getting national attention. The CDC now tracks total MIS-C cases and deaths in children and young adults up to 20 years old in the United States. As of June 2, CDC reported 4,018 cases of MIS-C that meet the case definition and 36 deaths—that’s 276 new cases and one new death since the May 3 report. The CDC notes, “As of October 1, the number of cases meeting the case definition for multisystem inflammatory syndrome in children (MIS-C) in the United States surpassed 1,000. As of February 1, this number surpassed 2,000, and exceeded 3,000 as of April 1.” This means it took seven months to reach 1,000 MIS-C cases, only four months to reach an additional 1,000 cases, and only two months to add an additional 1,185 cases. This suggests to us that Alpha/B.1.1.7 is causing more MIS-C. 

Date of ReportingTotal MIS-C PatientsChange Since Last ReportTotal MIS-C DeathsChange Since Last Report
6/2/20214018+27636+1
5/3/20213742+55735-1
3/29/20213185+56836+3
3/1/2021261733

Schools in the United States have been open throughout the pandemic, with teachers and education support professionals demonstrating their extraordinary ability to adapt in adverse circumstances. Teachers all over the country reinvented their teaching, taking their classrooms online in order to provide safe and remote learning experiences for students. The so-called “reopening” of schools, which more accurately refers to the opening of school buildings, as schools never closed, has been highly politicized, with many governors issuing mandates for in-person instruction, even as case counts, hospitalizations, and deaths in their states rose exponentially. The CDC has maintained that transmission risk in schools is minimal, provided that adequate safety measures are taken; however, we know that many states have not properly enforced universal masking (and some are repealing mask mandates this week), and we know that many school facilities are not equipped with the proper air handling systems. With more school buildings opening, there is a growing body of research that suggests that COVID-19 transmission can and does happen in schools. 

After recommending for months that school buildings be open, in mid-February (a year into the pandemic), The American Academy of Pediatrics, in collaboration with the Children’s Hospital Association, finally began tracking data on COVID-19 in children at the state and national level. Data reporting by states is still voluntary, and every state is different in its willingness to collect and disclose data on infections, hospitalizations, deaths, and testing rates in children. 

As of the APA’s May 27 report, only 11 states provide age distribution for testing. This makes it difficult to hold states accountable for testing each age group in proportion to its population. We’ve seen a trend in states where testing data with age distribution is available that children are tested at lower rates than adults. Hospitalization data by age group is only available in 24 states and New York City, so we only understand the severity of COVID-19 infections in children for about half the country. Age distribution for cases is provided by 49 states, New York City, the District of Columbia, Puerto Rico, and Guam. Age distribution for deaths is provided in 43 states, New York City, Puerto Rico, and Guam. It’s worth noting that New York State does not provide age data for cases, testing, hospitalizations, and deaths. Two states, Florida and Utah, only report cases in children aged 0-14, so the number of cases, hospitalizations, and deaths in children ages 15-17 is unknown in these states. 

As of May 27, A total of 322 child deaths due to COVID-19 were reported in 43 states (an increase of 6 child deaths in one week). In the United States, The following states do not report child mortality due to COVID-19: Michigan, Montana, New Mexico, New York, Rhode Island, South Carolina, and West Virginia. Texas only reports age data for 3% of confirmed COVID-19 cases, so state-level data from Texas is extremely limited for assessing the incidence of COVID-19 in children. Even considering this, Texas reported 52 child deaths. Arizona reported 33, California 23, Colorado 15 (+2), Florida 7, Georgia 10, Illinois 18, Maryland 10, Tennessee 10, Massachusetts 8 (+1), Pennsylvania 11, and New York City 24. 

If we truly want to keep children safe, especially as many school buildings open for in-person instruction, we need to collect more complete data in every state on child testing rates, cases, hospitalizations, and deaths.

The New York Times reports that nationally, children 12 and up have higher vaccination rates than the general population, with 50% of children 12 and up vaccinated, and 53% of children 18 and up fully vaccinated, according to the CDC.

However, some states are falling far behind when it comes to getting children—and the general population—fully vaccinated. Idaho, Alabama, Mississippi, and Louisiana have given at least one shot to less than 10% of children 12-17 years old. Massachusetts, Hawaii, and Vermont are the only three states that have given at least one shot to at least 50% of children 12-15. California has given at least one shot to 36% of children 12-17 years old. 

The Road Ahead

We are on Day 122 of the Biden-Harris administration.The President has made the pandemic a first priority and has now ordered enough vaccines to vaccinate everyone who wants a vaccination by July 2021. As of 6/5/21, 170.8 million people (approximately 51.5% of the population) have had one dose of any vaccine. 138.9 million people (41.9% of the population) are fully vaccinated. 

As of May 10, all people in the U.S. over the age of 12 are eligible to receive a vaccine. The Biden administration has already exceeded its goal of administering 200 million doses of vaccine in the first 100 days of the administration. The Pfizer-BioNtech is already approved for ages 12-15 and the Moderna vaccine should be approved in June 2021. Moderna has applied for emergency use authorization to administer their mRNA vaccines to children aged 12-15. Testing is ongoing for children in younger age groups and may be approved for ages 2-11 by the end of September 2021. 

Testing, wearing masks, social distancing and washing our hands frequently should no longer be political issues. These are non-pharmaceutical interventions used by most successful countries and some states to protect their citizens and their economies. New Zealand, Taiwan, and Australia are three countries that have done this successfully. In the United States, Hawaii is doing a better job handling the pandemic than many of our states. These interventions and vaccination should keep the pandemic from overwhelming our health care delivery systems world-wide. New mutations like Epsilon/B.1.427 + B.1.429 and the Alpha, Beta, Gamma, and Delta variants will probably spread rapidly throughout the United States over the next 90 days as many states (ex. Texas, Florida, Iowa, Mississippi, Wyoming and South Carolina) open up everything and do away with masking and social distancing. We will probably see increased new infections per day in the United States. In the UK, Alpha/B.1.1.7, has increased the number of infections, hospitalizations and deaths. This and other mutants may do the same thing in the USA.

The Pfizer and Moderna RNA vaccines and the Johnson & Johnson single dose vaccination adenovirus vaccine are all being used to immunize people in the USA. The Oxford-AstraZeneca vaccine and the Novavax vaccine may be available in the fourth quarter of 2021. 

The bad news is that all currently available vaccines are based on the spike protein sequence identified in China in December 2019. Mutated isolates, as discussed above, may overtake our ability to produce new vaccines and vaccinate the populace. Like Influenza vaccines, we may have to reformulate vaccines based on active, worldwide surveillance at least every 4 to 6 months. The FDA is currently putting together a guidance document for how to develop booster vaccines for SARS-CoV-2 mutations. A surrogate marker of protection like antibody to the mutated Receptor Binding Domains of SARS-CoV-2 should be considered for vaccine approval. 

The ideal approach to addressing the major mutations on at least five continents would be to make vaccines against each of the mutations. I’d get all of the vaccine companies and contract production companies on a call and “suggest” that two companies at least make and mass produce one of the four mutations. The government would pay the cost and buy at least 200 million doses in advance for each variant at say $40 a dose. The total cost to purchase the vaccine (800 million doses) would only be 32 billion dollars. Give each company a billion dollars each for development costs (another 8 billion dollars). Spend another two billion dollars for syringes and you’ve got enough booster doses to vaccinate 200 million people for all 4 variants. 42 billion dollars would be a small price to pay to catch up with the current mutations. Even if you had to do this every two years, it would be well worth the dollars spent. 

We are not doing adequate numbers of PCR or antigen detection assays in the United States. According to JHU, in January of 2021, we were doing up to 2,307,949 tests per day. In March 2021, the highest number of tests per day was 1,709,210, and in April, the highest number of tests per day was 2,008,319. Currently, we’re doing 710,675 tests per day (7-day moving average); that’s 1,297,644 fewer tests per day than the April high. 

We still need to perform more virus isolations and perform more DNA sequencing of viruses in each country, state, populous city, and county if we are to rapidly identify new mutations. I’m more hopeful that we will have the facilities, the equipment, and the trained staff needed to perform this work. As a nation we still need to make and distribute more vaccines to other countries, new vaccines directed against mutants, and the necessary rapid tests and protective equipment needed by medical staff, first responders, essential workers and especially teachers and students. I’m still hopeful we can work together on our and the world’s infectious disease problems. 

What Our Team Is Reading This Week

COVID-19

SARS-CoV-2 Update

It’s time for our next 14-day moving average determinations for SARS-CoV-2 for the United States and my thoughts on vaccines and mutant viruses. We use the WORLDOMETERS aggregators data set to make any projections since it includes data from the Department of Veterans Affairs, the U.S. Military, federal prisons and the Navajo Nation.

In the United States, SARS-CoV-2 deaths have decreased for the sixth time in a 14-day period. There were 96 fewer deaths per day than in the last 14-day period. In the last 14 days, the number of infections has decreased by 17,267 infections per day.Our infections per day are still high, probably secondary to SARS-CoV-2 mutants, to include the B.1.1.7 (UK isolate), a New York isolate B.1.526, the CAL.20C isolate, the South African isolate B.1.351, the Brazilian isolates P.1 and P.2, and the new Indian isolate B.1.617. I would predict that the opening of schools, places of worship, bars, restaurants, indoor dining and travel all will contribute to further spread of multiple SARS-CoV-2 mutants and rising numbers  in infections, hospitalizations and deaths in the coming months. Increased traveling as well as upcoming Memorial Day weekend, summer vacations, and the July 4 holiday will all cause further increases. Vaccinations, increased mask usage and social distancing, which are a part of the Biden SARS-CoV-2 plan (day 122 of plan) will be necessary to stop spread of mutants and cause  further reductions in infections, hospitalizations and deaths in the future. On 5/21/21, 29,014 new infections occurred in the United States. There were also 603 deaths. The number of hospitalized patients is decreasing, but 7,392 patients are still seriously or critically ill. The number of critically ill patients has decreased by 1,748 in the last 14 days, while 8,497 new deaths occurred. The number of critically ill patients is decreasing for the third 14 day period but a large number of patients are still dying each day. 

As of 5/21/21, we have had 603,408 deaths and 33,862,398 SARS-CoV-2 infections in the United States. We have had 443,372 new infections in the last 14 days. We are adding an average of 221,686 infections every 7 days. Each million infections usually results in 10,000 to 20,000 deaths. On 5/21/21, twenty-two states have had greater than 500,000 total infections, and 33 states have had greater than 5,000 total deaths. Nine states (Michigan, Georgia, Illinois, New Jersey, Pennsylvania,Florida, Texas, New York and California) have had greater than 20,000 deaths. Four states (Florida, Texas, New York and California) have had greater than 35,000 deaths.

For comparison, on 11/20/20 in the United States, 3.70% of the population had a documented SARS-CoV-2 infection. California was ranked 41st in infection percentage at 2.77%. In North Dakota 9.18% of the population was infected (ranked #1), and in South Dakota 8.03% of the population was infected (ranked #2).

As of 5/21/21, in the United States, 10.17% of the population has had a documented SARS-CoV-2 infection. In the last 6 months, over 6% of our country became infected with SARS-CoV-2. 

As of 5/21/21, California was still ranked 36th in infection percentage at 9.55%. In North Dakota 14.30% of the population was infected (ranked #1), while Rhode Island was at 14.27% (ranked #2) and South Dakota was at 14.00% of the population infected (ranked #3). Thirty-one states have greater than 10% of their population infected and 41 states have greater than 9% of their population infected. Only one state has less than 3% of their population infected: Hawaii (2.52%). Ten states still have greater than 1,000 new infections per day with Florida leading again on 5/21/21 with 2,371 infections.

New Mutants

A new mutant SARS-CoV-2 virus (lineage B.1.1.7), first seen in the UK in September 2020, has now been found in multiple other countries. There are 3,170 reported cases in the USA as of 3/11/21, 8337 cases as of 3/25/21 and 20,915 cases as of 4/10/21 in the US. This isolate has now been found in 50 states and the District of Columbia. This isolate is more infectious than other previously circulating B2 lineage isolates. There are two deletions and six other mutations in its spike protein. One mutation involves a change of one amino acid, an asparagine at position 501 in the receptor binding motif with a tyrosine. This enhances binding (affinity) to the ACE-2 receptor and may alone be responsible for the increased infectivity of this isolate. A study published March 10 in the British Medical Journal (BMJ) found that the risk of death increased by 64% in patients infected with the B.1.1.7 variant compared to all other isolates. Due to air and other travel, this isolate will become the dominant isolate worldwide. 

On 4/10/21, the CDC stopped providing data to the public on the number of reported cases of all variants of SARS-CoV-2, both nationally and by state. This data used to be available at https://www.cdc.gov/coronavirus/2019-ncov/transmission/variant-cases.html. The CDC claims that the data is available in its COVID-19 Data Tracker, but only percentages, not actual case numbers, are available, and the data ends on April 10, 2021.   

Luckily, GISAID is still reporting variant data. The United States has had more isolations of B.1.1.7 in the last four weeks (15,909) than any other country in the world, to include the United Kingdom. There have been a total of 132,214 cases of B.1.1.7 identified in the US to date. 22,300 have occurred in the last 4 weeks. (See chart below.)

At 191 cases, the United States has the fourth highest number of isolations of B.1.351 (the South African variant) in the last four weeks and a total of 1,564 isolations. 

And the United States has now surpassed Brazil for the most isolations of P.1 in the world, with 10,362 overall and 3,003 in the past four weeks. 

As for B.1.617, the variant recently identified in India, only India and the United Kingdom have more isolated cases than in the United States, which has 1,051 total cases, 506 of which were identified in the last four weeks. 

The United States has also surpassed both the UK and Nigeria for the most isolations of B.1.525 in the world, with 938 overall and 109 in the past four weeks. 

A disturbing report out of the UK has found a second mutation in B.1.1.7. This mutation, which occurs in the loop sequence, has also been found in the South African (B.1.351) and Brazilian (P.1) variants. (The loop sequence is in the receptor binding motif in the receptor binding domain of the S1 sequence of the spike protein.) This mutation involves a change of one amino acid of the spike protein, number 484, from glutamic acid to lysine. This point mutation allows the virus to bind better to the ACE2 receptor, which increases infectivity. People who are exposed to one of these variants (versus the old B2 isolate) are more likely to be infected and are more likely to transmit the virus to others. 

In our last three updates we summarized a research letter published in Clinical Infectious Diseases about a patient in the UK who was first infected in April with a B2 isolate and experienced only mild symptoms but was infected with the new B.1.1.7 variant in December and became critically ill. The patient described in this research letter was not protected by a natural infection with a B2 lineage SARS-CoV-2 isolate in April 2020 from having a potentially lethal second infection with a B.1.1.7 lineage variant in December 2020, suggesting that folks who have had a past SARS-CoV-2 infection should not expect to have any immunity to new variants such as B.1.1.7. All of the currently available vaccines were developed with spike protein from B2 lineages. Moderna, Pfizer, and AstraZeneca/Oxford are currently remaking their spike protein vaccines to address the mutations in the South African variant of SARS-CoV-2 because the AstraZeneca/Oxford vaccine did not work in a small trial in South Africa, where most of the patients had the South African mutant (B.1.351). 

A California Mutant

A fourth mutant isolate of SARS-CoV-2, B.1.429 + B.1.427 (CAL.20C), is the predominant mutation identified in California. This isolate does not have any of the mutations mentioned above, but contains five mutations, three of which are in the spike protein, but not in the receptor binding motif. This mutant may be partially responsible for the massive increase in infections in California, to include infections of people who had already recovered from a SARS-CoV-2 infection earlier. In California to date, we have had 3,775,758 infections and 62,858 total deaths. California is averaging 45 deaths per day in the last 14 days, which is a 13 deaths per day decrease from the preceding 14 day period. Currently, 9.55% of the population in California is infected. Nationally, we rank 35th in the percentage of people in the state infected. To my knowledge, only one privately held company is currently modifying their vaccine to cover the B.1.429 + B.1.427 mutant. 

New Indian Mutant B.1.617 Arrives in California

Stanford University announced five weeks ago that they have identified five infections with the Maharashtra India VOC 32421 (new variant designation B.1.617) in the San Francisco Bay Area. There are actually three different B.1.617 variants: B.1.617.1, B.1.617.2 and B.1.617.3. The most common variant appears to be B.1.617.2 This isolate is a double-mutant responsible for greater than 50% of the infections in India. The data from India the last 14 days ending on 5/21/21 is still disturbing. India has had 4,398,458 infections in the last 14 days or an average of 314,176 infections per day. During this 14-day period India reported 57,243 deaths or 4,089 deaths per day. On May 21, 2021, India reported 254,395 new infections and 4,143 new deaths. On 5/21/21 the total deaths due to SARS-CoV-2 infections in India stood at 295,508. India, with a population of 1,390,456,911, has had only 1.88% of the country infected. Their hospitals are still running out of vaccines, oxygen, medications, beds and ventilators. Sadly a health disaster continues in the world’s most populous country. I would predict that prior SARS-CoV-2 infection in India or first generation SARS-CoV-2 vaccines will have a decreased effect on this mutant discussed in the next paragraph. 

Many of you may now be familiar with the E484K mutation present in the South African isolate, the Brazilian isolate, the New York isolate (B.1.256), and the new Nigerian/UK double mutant. When vaccine manufacturers make booster vaccines to address these variants, they will only account for the E484K mutation. What sets this Maharashtra India B.1.617 variant apart from the other variants is that it has a different point mutation at amino acid 484 that involves a change of one amino acid of the spike protein, number 484, from glutamic acid to glutamine (E484Q). This point mutation, like E484K, probably allows the virus to bind to the ACE2 receptor and evade neutralizing antibodies directed against the original Wuhan sequence. A vaccine created to address E484K would not address this isolate. 

The second mutation in Maharashtra India VOC B.1.617 is L452R, which is one of the same mutations seen in CAL.20C (B.1.429 + B.1.427). This mutation is also not being covered by any vaccine currently being made as a booster. It’s possible that people in California who were infected by the Cal.20C mutant in the last six months might have some additional cross protective antibodies to B.1.617.

Watching the Data

Over the next few months, we’ll be paying close attention to correlations between the SARS-CoV-2 data, the number of isolates identified in various countries and states, and the non-pharmaceutical interventions (like mask mandates and lockdowns) put in place by state and national governments. Data on infections, deaths, and percent of population infected was compiled from Worldometers. Data for this table for SARS-CoV-2 Isolates Currently Known in Location was compiled from GISAID and the CDC. It’s worth noting that GISAID provided more data than the CDC, whose most recent data on variants is from May 8. 

LocationTotal Infections as of 5/21/21New Infections on 5/21/21Total DeathsNew Deaths on 5/21/21% of Pop.InfectedSARS-CoV-2 Isolates Currently Known in LocationNational/ State Mask Mandate?Currently in Lockdown?
World166,465,183621,0483,457,50012,7782.13%B2 lineageB.1.1.7 (UK)B.1.525 (Nigeria/UK)B.1.526 (USA-NYC)B.1.351 (SA)B.1.429 + B.1.427 (USA)*P.1 (Brazil)P.2 (Brazil)A lineage isolateV01.V2 (Tanzania)APTK India VOC 32421B.1.617+ (India)BV-1 (Texas, USA)NoNo
USA33,862,398
(ranked #1)
29,014
(ranked #4)
603,408
(ranked #1)
65710.17%B2 lineageB.1.1.7 (UK)B.1.525 (Nigeria/UK)B.1.526 (USA-NYC)B.1.351 (SA)B.1.429 + B.1.427 (USA)*P.1 (Brazil)P.2 (Brazil)B.1.617+ (India)BV-1 (Texas, USA)NoNo
Brazil15,976,156(ranked #3)   77,598(ranked #2) 446,521(ranked #2)2,1367.46%B2 lineageB.1.1.7 (UK)B.1.351 (SA)P.1 (Brazil)P.2 (Brazil)NoNo
India26,285.069(ranked #2)254,395(ranked #1)295,508(ranked #3)4,1431.88%B2 lineageB.1.1.7 (UK)B.1.351 (SA)B.1.429 + B.1.427 (USA)*B.1.525 (Nigeria/UK)APTK India VOC 32421B.1.617+ (India)NoNo
United Kingdom4,457,752(ranked #7)2,829127,71096.53%B2 lineageB.1.1.7 (UK)B.1.525 (Nigeria/UK)B.1.351 (SA)B.1.429 + B.1.427 (USA)*P.1 (Brazil)B.1.617+ (India)NoNo
California, USA3,775,758(ranked #9 in world)1,22362,858469.55%B2 lineageB.1.1.7 (UK)B.1.351 (SA)B.1.429 + B.1.427 (USA)*P.2 (Brazil)B.1.617+ (India)NoNo
Mexico2,390,140(ranked #15)2,628221,080(ranked #4)2301.83%B2 lineageB.1.1.7 (UK)B.1.429 + B.1.427 (USA)*P.1 (Brazil)B.1.617+ (India)NoNo
South Africa1,628,335(ranked #20)3,33255,7191512.71%B2 lineageB.1.1.7 (UK)B.1.351 (SA)B.1.617+ (India)NoNo
Canada1,352,121(ranked #22)4,67625,162513.55%B2 lineageB.1.1.7 (UK)B.1.525 (Nigeria/UK)B.1.429 + B.1.427 (USA)*P.1 (Brazil)B.1.617+ (India)Yes, except Alberta ProvinceNo
Poland2,863,030(ranked #13)1,67872,6911917.57%B2 lineageB.1.1.7 (UK)B.1.525 (Nigeria/UK)B.1.351 (SA)B.1.617+ (India)NoNo
Turkey5,169,951(ranked #5)9,52845,8402146.07%B2 lineageB.1.1.7 (UK)B.1.525 (Nigeria/UK)B.1.351 (SA)B.1.429 + B.1.427 (USA)**P.1 (Brazil)NoNo
Russia4,983,845(ranked #6)8,937117,7393783.41%B2 lineageB.1.1.7 (UK)B.1.351 (SA)B.1.617+ (India)NoNo
Argentina3,482,512(ranked #11)35,46835,4686927.64%B2 lineageB.1.1.7 (UK)B.1.525 (Nigeria/UK)B.1.351 (SA)B.1.429 + B.1.427 (USA)**P.1 (Brazil)B.1.617+ (India)NoNo

*Also referred to as CAL.20C

SARS-CoV-2, Children, and MIS-C/PIMS

I’m pleased to see that COVID-19 cases and MIS-C (PIMS) cases in children in the US are finally getting national attention. The CDC now tracks total MIS-C cases and deaths in children and young adults up to 20 years old in the United States. As of May 3, CDC reported 3,742 cases of MIS-C that meet the case definition and 35 deaths—that’s 557 new cases and no new deaths since the March 29 report. The CDC notes, “As of October 1, the number of cases meeting the case definition for multisystem inflammatory syndrome in children (MIS-C) in the United States surpassed 1,000. As of February 1, this number surpassed 2,000, and exceeded 3,000 as of April 1.” This means it took seven months to reach 1,000 MIS-C cases, only four months to reach an additional 1,000 cases, and only two months to add an additional 1,185 cases. This suggests to us that B.1.1.7 is causing more MIS-C. We’re averaging over 500 new cases of MIS-C each month for the last two months, despite decreases in the number of SARS-CoV-2 infections in the United States. 

Date of ReportingTotal MIS-C PatientsChange Since Last ReportTotal MIS-C DeathsChange Since Last Report
5/3/20213742+55735-1
3/29/20213185+56836+3
3/1/2021261733

Schools in the United States have been open throughout the pandemic, with teachers and education support professionals demonstrating their extraordinary ability to adapt in adverse circumstances. Teachers all over the country reinvented their teaching, taking their classrooms online in order to provide safe and remote learning experiences for students. The so-called “reopening” of schools, which more accurately refers to the opening of school buildings, as schools never closed, has been highly politicized, with many governors issuing mandates for in-person instruction, even as case counts, hospitalizations, and deaths in their states rose exponentially. The CDC has maintained that transmission risk in schools is minimal, provided that adequate safety measures are taken; however, we know that many states have not properly enforced universal masking (and some are repealing mask mandates this week), and we know that many school facilities are not equipped with the proper air handling systems. With more school buildings opening, there is a growing body of research that suggests that COVID-19 transmission can and does happen in schools. 

After recommending for months that school buildings be open, in mid-February (a year into the pandemic), The American Academy of Pediatrics, in collaboration with the Children’s Hospital Association, finally began tracking data on COVID-19 in children at the state and national level. Data reporting by states is still voluntary, and every state is different in its willingness to collect and disclose data on infections, hospitalizations, deaths, and testing rates in children. 

As of the APA’s May 20 report, only 11 states provide age distribution for testing. This makes it difficult to hold states accountable for testing each age group in proportion to its population. We’ve seen a trend in states where testing data with age distribution is available that children are tested at lower rates than adults. Hospitalization data by age group is only available in 24 states and New York City, so we only understand the severity of COVID-19 infections in children for about half the country. Age distribution for cases is provided by 49 states, New York City, the District of Columbia, Puerto Rico, and Guam. It’s worth noting that New York State does not provide age data for cases, testing, hospitalizations, and deaths. Two states, Florida and Utah, only report cases in children aged 0-14, so the number of cases, hospitalizations, and deaths in children ages 15-17 is unknown in these states. 

As of May 20, A total of 316 child deaths due to COVID-19 were reported in 43 states (an increase of 8 child deaths in one week). In the United States, The following states do not report child mortality due to COVID-19: Michigan, Montana, New Mexico, New York, Rhode Island, South Carolina, and West Virginia. Texas only reports age data for 3% of confirmed COVID-19 cases, so state-level data from Texas is extremely limited for assessing the incidence of COVID-19 in children. Even considering this, Texas reported 52 child deaths. Arizona reported 33 (+2), California 23 (+2), Colorado 13, Florida 7 (+1), Georgia 10, Illinois 18, Maryland 10, Tennessee 10, Massachusetts 7 (+2), Pennsylvania 11 (+1), and New York City 24. 

If we truly want to keep children safe, especially as many school buildings open for in-person instruction, we need to collect more complete data in every state on child testing rates, cases, hospitalizations, and deaths.

The Road Ahead

We are on Day 122 of the Biden-Harris administration.The President has made the pandemic a first priority and has now ordered enough vaccines to vaccinate everyone who wants a vaccination by July 2021. As of 5/24/21, 164.3 million people have had one dose of any vaccine. 131 million people are fully vaccinated. 

As of May 10, all people in the U.S. over the age of 12 are eligible to receive a vaccine. The Biden administration has already exceeded its goal of administering 200 million doses of vaccine in the first 100 days of the administration. The Pfizer-BioNtech is already approved for ages 12-15 and the Moderna vaccine should be approved in June 2021. Moderna has applied for emergency use authorization to administer their mRNA vaccines to children aged 12-15. Testing is ongoing for children in younger age groups and may be approved for ages 2-11 by the end of September 2021. 

Testing, wearing masks, social distancing and washing our hands frequently should no longer be political issues. These are non-pharmaceutical interventions used by most successful countries and some states to protect their citizens and their economies. New Zealand, Taiwan, and Australia are three countries that have done this successfully. In the United States, Hawaii is doing a better job handling the pandemic than many of our states. These interventions and vaccination should keep the pandemic from overwhelming our health care delivery systems world-wide. New mutations like B.1.429 + B.1.427 (Cal.20C) and the UK, Brazillian, South African, and Indian variants will probably spread rapidly throughout the United States over the next 90 days as many states (particularly in Texas, Florida, Iowa, Mississippi, Wyoming and South Carolina) open up everything and do away with masking and social distancing. We will probably see increased new infections per day in the United States. In the UK, B.1.1.7, has increased the number of infections, hospitalizations and deaths. This and other mutants may do the same thing in the USA.

The Pfizer and Moderna RNA vaccines and the Johnson & Johnson single dose vaccination adenovirus vaccine are all being used to immunize people in the USA. The Oxford-AstraZeneca vaccine and Novavax vaccine may be available in the fourth quarter of 2021. 

The bad news is that all currently available vaccines are based on the Chinese spike protein sequence from December 2019. Mutated isolates, as discussed above, may overtake our ability to produce new vaccines and vaccinate the populace. Like Influenza vaccines, we may have to reformulate vaccines based on active, worldwide surveillance at least every 4 to 6 months. The FDA is currently putting together a guidance document for how to develop booster vaccines for SARS-CoV-2 mutations. A surrogate marker of protection like antibody to the mutated Receptor Binding Domains of SARS-CoV-2 should be considered for vaccine approval. 

The ideal approach to spreading major mutations on at least five continents would be to make vaccines against each of the mutations. I’d get all of the vaccine companies and contract production companies on a call and “suggest” that two companies at least make and mass produce one of the four mutations. The government would pay the cost and buy at least 200 million doses in advance for each variant at say $40 a dose. The total cost to purchase the vaccine (800 million doses) would only be 32 billion dollars. Give each company a billion dollars each for development costs (another 8 billion dollars). Spend another two billion dollars for syringes and you’ve got enough booster doses to vaccinate 200 million people for all 4 variants. 42 billion dollars would be a small price to pay to catch up with the current mutations. Even if you had to do this every two years, it would be well worth the dollars spent. 

We are not doing adequate numbers of PCR or antigen detection assays in the United States. According to JHU, in January of 2021, we were doing up to 2,307,949 tests per day. In March 2021, the highest number of tests per day was 1,709,210, and in April, the highest number of tests per day was 2,008,319. Currently, we’re doing 975,589 tests per day (7-day moving average); that’s 453,963 fewer tests per day than the April high. 

We still need to perform more virus isolations and perform more DNA sequencing of viruses in each country, state, populous city, and county if we are to rapidly identify new mutations. I’m more hopeful that we will have the facilities, the equipment, and the trained staff needed to perform this work. As a nation we still need to make and distribute more vaccines for other countries, new vaccines directed against mutants, and the necessary rapid tests and protective equipment needed by medical staff, first responders, essential workers and especially teachers and students. I’m still hopeful we can work together on our and the world’s infectious disease problems. 

What Our Team Is Reading This Week

COVID-19

SARS-CoV-2 Update

It’s time for our next 14-day moving average determinations and projections for infections and deaths from SARS-CoV-2 for the United States and my thoughts on vaccines and mutant viruses. We use the WORLDOMETERS aggregators data set to make any projections since it includes data from the Department of Veterans Affairs, the U.S. Military, federal prisons and the Navajo Nation.

In the United States, SARS-CoV-2 deaths have decreased for the sixth time in a 14-day period. There were 28 fewer deaths per day than in the last 14-day period. In the last 14 days, the number of infections has decreased by 17,700 infections per day.  Our infections per day is still extremely high, probably secondary to SARS-CoV-2 mutants, to include the B.1.1.7 (UK isolate), a New York isolate B.1.526, the CAL.20C isolate, the South African isolate and the Brazilian isolates and the new Indian isolate. I would predict that the opening of schools, places of worship, bars, restaurants, indoor dining and travel all will contribute to further spread of multiple SARS-CoV-2 mutants and rising numbers  in infections, hospitalizations and deaths in the coming months. Increased traveling as well as upgoing Memorial Day weekend, summer vacations and the July 4th holiday will all cause further increases. Vaccinations, increased mask usage and social distancing, which are a part of the Biden SARS-CoV-2 plan (day 108 of plan) will be necessary to stop spread of mutants and cause  further reductions in infections, hospitalizations and deaths in the future. On 5/07/21, 49,491 new infections occurred in the United States. There were also 770 deaths. The number of hospitalized patients is decreasing, but 9,140  patients are still seriously or critically ill. The number of critically ill patients has decreased by 692 in the last 14 days, while 9,836 new deaths occurred. The number of critically ill patients is decreasing for the second 14 day period but a large number of patients are still dying each day. 

As of 5/07/21, we have had 594,911 deaths and 33,418,826 SARS-CoV-2 infections in the United States. We have had 683,122 new infections in the last 14 days. We are adding an average of 341,561 infections every 7 days. Each million infections usually results in 10,000 to 20,000 deaths. On 5/07/21, twenty-two states have had greater than 500,000 total infections, and 32 states have had greater than 5,000 total deaths. Eight states (Geogia, illinois, New Jersey, Pennsylvania,Florida, Texas, New York and California) have had greater than 20,000 deaths. Four states (Florida, Texas, New York and California) have had greater than 35,000 deaths.

For comparison, on 11/20/20 in the United States, 3.70% of the population had a documented SARS-CoV-2 infection. California was ranked 41st in infection percentage at 2.77%. In North Dakota 9.18% of the population was infected (ranked #1), and in South Dakota 8.03% of the population was infected (ranked #2).

As of 5/07/21, in the United States, 10.04% of the population has had a documented SARS-CoV-2 infection. In the last 5 months nearly 6% of our country became infected with SARS-CoV-2. 

As of 5/07/21, California was still ranked 35th in infection percentage at 9.50%. In North Dakota 14.21% of the population was infected (ranked #1), while Rhode Island was at 14.11% (ranked #2) and South Dakota was at 13.93% of the population infected (ranked #3). Thirty states have greater than 10% of their population infected. Only one state has less than 3.5% of their population infected: Hawaii (2.30%). Fourteen states still have greater than 1,000 new infections per day with Florida leading again on 5/7/21 with 4,175 infections.

New Mutants

A new mutant SARS-CoV-2 virus (lineage B.1.1.7), first seen in the UK in September 2020, has now been found in multiple other countries. There are 3,170 reported cases in the USA as of 3/11/21, 8337 cases as of 3/25/21 and 20,915 cases as of 4/10/21 in the US. This isolate has now been found in 50 states and the District of Columbia. This isolate is more infectious than other previously circulating B2 lineage isolates. There are two deletions and six other mutations in its spike protein. One mutation involves a change of one amino acid, an asparagine at position 501 in the receptor binding motif with a tyrosine. This enhances binding (affinity) to the ACE-2 receptor and may alone be responsible for the increased infectivity of this isolate. A study published March 10 in the British Medical Journal (BMJ) found that the risk of death increased by 64% in patients infected with the B.1.1.7 variant compared to all other isolates. Due to air and other travel, this isolate will become the dominant isolate worldwide. 

On 4/10/21, the CDC stopped providing data to the public on the number of reported cases of all variants of SARS-CoV-2, both nationally and by state. This data used to be available at https://www.cdc.gov/coronavirus/2019-ncov/transmission/variant-cases.html. The CDC claims that the data is available in its COVID-19 Data Tracker, but only percentages, not actual case numbers, are available, and the data ends on April 10, 2021.   

Luckily, GISAID is still reporting variant data. The United States has had more isolations of B.1.1.7 in the last four weeks (15,909) than any other country in the world, to include the United Kingdom. There have been a total of 85,324 cases of B.1.1.7 identified in the US to date. (See chart below.)

At 197 cases, the United States has the fourth highest number of isolations of B.1.351 (the South African variant) in the last four weeks and a total of 1,161 isolations. 

And the United States has now surpassed Brazil for the most isolations of P.1 in the world, with 5,355 overall and 1,955 in the past four weeks. 

As for B.1.617, the variant recently identified in India, only India and the United Kingdom have more isolated cases than in the United States, which has 334 total cases, 197 of which were identified in the last four weeks. This also means that we had 137 known cases of this variant in the US more than a month ago, despite the fact that American news media and the CDC have only recently begun educating the public about this variant. 

A disturbing report out of the UK has found a second mutation in B.1.1.7. This mutation, which occurs in the loop sequence has also been found in the South African (B.1.351) and Brazilian (P.1) variants. (The loop sequence is in the receptor binding motif in the receptor binding domain of the S1 sequence of the spike protein.) This mutation involves a change of one amino acid of the spike protein, number 484, from glutamic acid to lysine. This point mutation allows the virus to bind better to the ACE2 receptor, which increases infectivity. People who are exposed to one of these variants (versus the old B2 isolate) are more likely to be infected and are more likely to transmit the virus to others. 

In our last three updates we summarized a research letter published in Clinical Infectious Diseases about a patient in the UK who was first infected in April with a B2 isolate and experienced only mild symptoms but was infected with the new B.1.1.7 variant in December and became critically ill. The patient described in this research letter was not protected by a natural infection with a B2 lineage SARS-CoV-2 isolate in April 2020 from having a potentially lethal second infection with a B.1.1.7 lineage variant in December 2020, suggesting that folks who have had a past SARS-CoV-2 infection should not expect to have any immunity to new variants such as B.1.1.7. All of the currently available vaccines were developed with spike protein from B2 lineages. Moderna, Pfizer, and AstraZeneca/Oxford are currently remaking their spike protein vaccines to address the mutations in the South African variant of SARS-CoV-2 because the AstraZeneca/Oxford vaccine did not work in a small trial in South Africa, where most of the patients had the South African mutant (B.1.351). 

A California Mutant

A fourth mutant isolate of SARS-CoV-2, B.1.429 + B.1.427 (CAL.20C), is the predominant mutation identified in California. This isolate does not have any of the mutations mentioned above, but contains five mutations, three of which are in the spike protein, but not in the receptor binding motif. This mutant may be partially responsible for the massive increase in infections in California, to include infections of people who had already recovered from a SARS-CoV-2 infection earlier. In California to date, we have had 3,756,393 infections and 62,220 total deaths. California is averaging 58 deaths per day in the last 14 days, which is a 22 deaths per day decrease from the preceding 14 day period. Currently, 9.50% of the population in California is infected. Nationally, we rank 35th in the percentage of people in the state infected. To my knowledge, only one privately held company is currently modifying their vaccine to cover the B.1.429 + B.1.427 mutant. 

New Indian Mutant B.1.617 Arrives in California

Stanford University announced three weeks ago that they have identified five infections with the Maharashtra India VOC 32421 (new variant designation B.1.617) in the San Francisco Bay Area. Two additional isolates were PCR positive and pending sequencing. This isolate is a double-mutant responsible for greater than 40% of the infections in India.  In the last 14 day update India had had 2,080,793 new infections in the  7 days prior which was a 58% change in the number of infections from the preceding 7 days (1,318,900 infections). Indian had reported the three highest numbers of new infections per day at 349,165 on 3/24/21, 345,147 on 2/23/21, and 332,503 new infections on 4/22/21. India is the only country to report over a million infections in three days. The previous one day record was 302,000 infections in the United States. In India 13,876 new SARS-CoV-2 deaths had occurred in the last seven days compared to 7,206 deaths in  the preceding seven days. This was a 93% increase in the death rate in the last seven days. 

The data from India the last 14 days ending on 5/07/21 is even more disturbing. India has had 5,284,155 infections in the last 14 days with an average of 377,440 infections per day or 1,132,320 infections every three days. During this 14 day period India reported 48,716 deaths or 3,480 deaths per day. On May 7, 2021 India reported 401,326 new infections and 4,194 new deaths. On 5/7/21 the total deaths due to SARS-CoV-2 infections in India now stands at 238,265. India with a population of 1,390,456,911 has had only 1.57% of the country infected. Their hospitals are still running out of oxygen, medications, beds and ventilators. They had only been able to vaccinate approximately 140 million people.Sadly a health disaster is now occurring in the world’s most populous country. I would predict that prior SARS-CoV-2 infection in India or first generation SARS-CoV-2 vaccines will have little effect on this mutant discussed in the next paragraph. 

Many of you may now be familiar with the E484K mutation present in the South African isolate, the Brazilian isolate, the New York isolate (B.1.256), and the new Nigerian/UK double mutant. When vaccine manufacturers make booster vaccines to address these variants, they will only account for the E484K mutation. What sets this Maharashtra India B.1.617 variant apart from the other variants is that it has a different point mutation at amino acid 484 that involves a change of one amino acid of the spike protein, number 484, from glutamic acid to glutamine (E484Q). This point mutation, like E484K, probably allows the virus to bind to the ACE2 receptor and evade neutralizing antibodies directed against the original Wuhan sequence. A vaccine created to address E484K would not address this isolate. 

The second mutation in Maharashtra India VOC B1.617 is L452R, which is one of the same mutations seen in CAL.20C (B.1.429 + B.1.427). This mutation is also not being covered by any vaccine currently being made as a booster. It’s possible that people in California who were infected by the Cal.20C mutant in the last six months might have some cross protective antibodies to B.1.617.

Watching the Data

Over the next few months, we’ll be paying close attention to correlations between the SARS-CoV-2 data, the number of isolates identified in various countries and states, and the non-pharmaceutical interventions (like mask mandates and lockdowns) put in place by state and national governments. Data on infections, deaths, and percent of population infected was compiled from Worldometers. Data for this table for SARS-CoV-2 Isolates Currently Known in Location was compiled from GISAID and the CDC. It’s worth noting that GISAID provided more data than the CDC.

LocationTotal Infections as of 5/07/21New Infections on 5/7/21Total DeathsNew Deaths on 5/07/21% of Pop.InfectedSARS-CoV-2 Isolates Currently Known in LocationNational/ State Mask Mandate?Currently in Lockdown?
World157,526,509836,0313,283,26013,7412.02%B2 lineageB.1.1.7 (UK)B.1.525 (Nigeria/UK)B.1.526 (USA-NYC)B.1.351 (SA)B.1.429 + B.1.427 (USA)*P.1 (Brazil)P.2 (Brazil)A lineage isolateV01.V2 (Tanzania)APTK India VOC 32421Maharashtra India VOC B.1.617 BV-1 (Texas, USA)NoNo
USA33,418,826
(ranked #1)
49,491
(ranked #3)
594,911
(ranked #1)
79010.04%B2 lineageB.1.1.7 (UK)B.1.525 (Nigeria/UK)B.1.526 (USA-NYC)B.1.351 (SA)B.1.429 + B.1.427 (USA)*P.1 (Brazil)P.2 (Brazil)Maharashtra India VOC B.1.617BV-1 (Texas, USA)NoNo
Brazil15,078,360(ranked #3)   78,377(ranked #2) 401,326(ranked #2)2,2177.05%B2 lineageB.1.1.7 (UK)B.1.351 (SA)P.1 (Brazil)P.2 (Brazil)NoNo
India21,886,612(ranked #2)401,326(ranked #1)238,265(ranked #3)4,1941.57%B2 lineageB.1.1.7 (UK)B.1.351 (SA)B.1.429 + B.1.427 (USA)*B.1.525 (Nigeria/UK)APTK India VOC 32421Maharashtra India VOC B.1.617NoNo
United Kingdom4,431,043(ranked #7)2,490127,598156.49%B2 lineageB.1.1.7 (UK)B.1.525 (Nigeria/UK)B.1.351 (SA)B.1.429 + B.1.427 (USA)*P.1 (Brazil)Maharashtra India VOC B.1.617NoNo
California, USA3,756,393(ranked #9 in world)2,16662,220489.50%B2 lineageB.1.1.7 (UK)B.1.351 (SA)B.1.429 + B.1.427 (USA)*P.2 (Brazil)Maharashtra India VOC 32421NoNo
Mexico2,358,831(ranked #15)2,846218,173(ranked #4)1661.81%B2 lineageB.1.1.7 (UK)B.1.429 + B.1.427 (USA)*P.1 (Brazil)NoNo
South Africa1,592,326(ranked #20)1,95654,687672.65%B2 lineageB.1.1.7 (UK)B.1.351 (SA)NoNo
Canada1,273,169(ranked #22)7,84924,529403.54%B2 lineageB.1.1.7 (UK)B.1.525 (Nigeria/UK)B.1.429 + B.1.427 (USA)*P.1 (Brazil)Yes, except Alberta ProvinceNo
Poland2,824,431(ranked #13)6,05369,4451667.46%B2 lineageB.1.1.7 (UK)B.1.525 (Nigeria/UK)B.1.351 (SA)NoNo
Turkey4,998,089(ranked #5)20,10742,4652785.87%B2 lineageB.1.1.7 (UK)B.1.525 (Nigeria/UK)B.1.351 (SA)B.1.429 + B.1.427 (USA)**P.1 (Brazil)NoNo
*Also referred to as CAL.20C

The Road Ahead

We are on Day 108 of the Biden-Harris administration.The President has made the pandemic a first priority and has now ordered enough vaccine to vaccinate everyone who wants a vaccination by July 2021. As of 5/7/21, 149.5 million people have had one dose of any vaccine. 8.6 million have had a single-dose vaccine (J&J). 108.9 million people are fully vaccinated. Therefore, 32 million people still need a second dose of either the Pfizer or the Moderna vaccine. 

As of April 16, all people in the U.S. over the age of 16 are eligible to receive a vaccine. The Biden administration has already exceeded its goal of administering 200 million doses of vaccine in the first 100 days of the administration. Pfizer and Moderna have applied for emergency use authorization to administer their mRNA vaccines to children aged 12-15, and the FDA is expected to authorize the Pfizer vaccine for this age group next week. Testing is ongoing for children in younger age groups and may be approved for ages 2-11 by September 2021. 

Testing, wearing masks, social distancing and washing our hands frequently should no longer be political issues. These are non-pharmaceutical interventions used by most successful countries and some states to protect their citizens and their economies. New Zealand, Taiwan, and Australia are three countries that have done this successfully. In the United States, Hawaii is doing a better job handling the pandemic than many of our states. These interventions and vaccination should keep the pandemic from overwhelming our health care delivery system. New mutations like B.1.429 + B.1.427 (Cal.20C) and the UK, Brazillian, South African, and Indian variants will probably spread rapidly throughout the United States over the next 90 days as several states (including Texas, Florida, Iowa, Mississippi) open up everything and do away with masking and social distancing. We will probably see increased new infections per day in the United States. In the UK, B.1.1.7, has increased the number of infections, hospitalizations and deaths. This and other mutants may do the same thing in the USA.

The Pfizer and Moderna RNA vaccines and the Johnson & Johnson single dose vaccination adenovirus vaccine are all being used to immunize people in the USA. The Oxford-AstraZeneca vaccine and Novavax vaccine may be available in the second or third quarter of 2021. 

The bad news is that all currently available vaccines are based on the Chinese spike protein sequence from December 2019. Mutated isolates, as discussed above, may overtake our ability to produce new vaccines and vaccinate the populace. Like Influenza vaccines, we may have to reformulate vaccines based on active, worldwide surveillance at least every 4 to 6 months. The FDA is currently putting together a guidance document for how to develop booster vaccines for SARS-CoV-2 mutations. A surrogate marker of protection like antibody to the mutated Receptor Binding Domains of SARS-CoV-2 should be considered for vaccine approval. 

I still feel the current approach of companies and governments of making new vaccines against just the South African variant is wrong. In Brazil, where the P.1 isolate is dominant, they’ve had another 849,250 infections and 32,770 deaths in just the last 14 days. In the last 42 days in Brazil 2,762,595 infections have occurred and 115,667 deaths. In South Africa, the total number of infections during the pandemic is 1,592,326 and a total of 54,687 deaths. Brazil had more infections and deaths in one month than South Africa has had for the entire pandemic. It makes no sense to make a vaccine based on just the South African mutant and not make one for the Brazilian P.1 mutant. Even worse is the current situation with the Indian SARS-CoV-2 VOC B.1.617. In the last 14 days India has had 5,284,155 new infections and 48,716 deaths. If India shuts down, among other things the generic drug industry could fail.

The ideal approach to these spreading major mutations on at least five continents would be to make vaccines against each of the mutations. I’d get all of the vaccine companies and contract production companies on a call and “suggest” that two companies at least make and mass produce one of the four mutations. The government would pay the cost and buy at least 200 million doses in advance for each variant at say $40 a dose. The total cost to purchase the vaccine (800 million doses) would only be 32 billion dollars. Give each company a billion dollars each for development costs (another 8 billion dollars). Spend another two billion dollars for syringes and you’ve got enough booster doses to vaccinate 200 million people for all 4 variants. 42 billion dollars would be a small price to pay to catch up with the current mutations. Even if you had to do this every two years, it would be well worth the dollars spent. 

We are not doing adequate numbers of PCR or antigen detection assays in the United States. According to JHU, in January of 2021, we were doing up to 2,307,949 tests per day. In March 2021, the highest number of tests per day was 1,709,210, and in April, the highest number of tests per day was 2,008,319. Currently, we’re doing 1,260,357 tests per day (7-day moving average); that’s 747,962 fewer tests than the April high. 

We still need to perform more virus isolations and perform more DNA sequencing of viruses in each country, state, populous city, and county if we are to rapidly identify new mutations. I’m more hopeful that we will have the facilities, the equipment, and the trained staff needed to perform this work. As a nation we are finally preparing to make more vaccine, new vaccines directed against mutants, and the necessary rapid tests and protective equipment needed by medical staff, first responders, essential workers and especially teachers and students. I’m still hopeful we can work together on our and the world’s infectious disease problems. 

What Our Team Is Reading This Week