
- In the last 14 days, the number of COVID-19 infections in the United States has increased by 11,097 infections per day compared to the preceding 14-day period.
- For the pandemic in the United States we are averaging one death for every 56 infections reported or 17,856 deaths for each one million infections.
- The Delta variant is now the dominant variant in the United States, and recent surges around the country and some vaccine breakthrough cases and deaths have been attributed to Delta.
- In Massachusetts, 303 fully-vaccinated patients were hospitalized for COVID-19 and 79 (26%) of these died.
- As of July 12, the CDC reports that 3,733 fully-vaccinated people have been hospitalized with COVID-19 and 791 fully-vaccinated people have died of COVID-19 (up from 656 on June 28).
- In 49 states, from July 1 to July 8, 19,482 COVID-19 cases in children were reported. In 24 of those states, 130 children were hospitalized with COVID-19 over the same one-week period and 9 children died.
- In California, between June 30 and July 14, the California Department of Public Health reported 6 COVID-19 deaths in children.
- Worldwide, 6.4 million people were infected with COVID-19 in the 14-day period from 7/3/21-7/16/21.
It’s time for our next 14-day moving average determinations for SARS-CoV-2 for the United States and my thoughts on vaccines and mutant viruses. We use the WORLDOMETERS aggregators data set to make any projections since it includes data from the Department of Veterans Affairs, the U.S. Military, federal prisons and the Navajo Nation.

In the United States, SARS-CoV-2 deaths have decreased for the twelfth time in a 14-day period. There were 24 fewer deaths per day than in the last 14-day period. In the last 14 days, the number of infections has increased by 11,097 infections per day than in the preceding 14-day period. Our infections per day are rising again, probably secondary to SARS-CoV-2 mutant Delta/B.1.617.2. I would predict that the opening of schools, places of worship, bars, restaurants, indoor dining and travel all will contribute to further spread of SARS-CoV-2 mutants, like the Delta and Lambda variants and rising numbers in infections, hospitalizations and deaths in the coming months. Increased traveling as well as summer vacations, and the July 4 holiday will all cause further increases. Vaccinations, increased mask usage and social distancing, which are a part of the Biden SARS-CoV-2 plan (day 178 of plan) will be necessary to stop spread of mutants and cause further reductions in infections, hospitalizations and deaths in the future. On 7/16/21, the United States had 40,529 new infections. There were also 293 deaths. The number of hospitalized patients is again increasing and 4,876 patients are still seriously or critically ill. The number of critically ill patients has increased by 1,010 in the last 14 days, while 3,450 new deaths occurred. The number of critically ill patients is increasing for the first time in seven 14-day periods and a large number of patients are still dying each day (average 246/day).
As of 7/16/21, we have had 624,606 deaths and 34,929,856 SARS-CoV-2 infections in the United States. We have had 343,676 new infections in the last 14 days. We are adding an average of 171,838 infections every 7 days. For the pandemic in the United States we are averaging one death for every 56 infections reported or 17,856 deaths for each one million infections. As of 7/16/21, thirty-two states have had greater than 500,000 total infections, and 33 states have had greater than 5,000 total deaths. Ten states (Ohio, Michigan, Georgia, Illinois, New Jersey, Pennsylvania, Florida, Texas, New York and California) have had greater than 20,000 deaths. Four states (Florida, Texas, New York, and California) have had greater than 35,000 deaths. In the world, 44 other countries have greater than 500,000 infections and 43 countries have greater than 10,000 deaths. Sixteen other countries have greater than 35,000 deaths. Two more countries, Columbia and Argentina, join eight other countries with over 100,000 deaths from SARS-CoV-2. Only 2.44% of the world has been infected to date.
On 11/20/20 in the United States, 3.70% of the population had a documented SARS-CoV-2 infection. California was ranked 41st in infection percentage at 2.77%. In North Dakota 9.18% of the population was infected (ranked #1), and in South Dakota 8.03% of the population was infected (ranked #2).
As of 7/16/21, in the United States, 10.48% of the population has had a documented SARS-CoV-2 infection. In the last 9 months, 7% of our country became infected with SARS-CoV-2.
As of 7/16/21, California was ranked 37th in infection percentage at 9.76%. In North Dakota 14.56% of the population was infected (ranked #1), while Rhode Island was at 14.43% (ranked #2) and South Dakota was at 14.10% of the population infected (ranked #3). Thirty-three states have greater than 10% of their population infected and 42 states have greater than 9% of their population infected. Only one state has less than 3% of their population infected: Hawaii (2.75%).
The Threat of SARS-CoV-2 Variants
In a response to the need for “easy-to-pronounce and non-stigmatising labels,” at the end of May, the World Health Organization assigned a letter from the Greek alphabet to each SARS-CoV-2 variant. GISAID, Nextstrain, and Pango will continue to use the previously established nomenclature. For our purposes, we’ll be referring to each variant by both its Greek alphabet letter and the Pango nomenclature.
The WHO has sorted variants into two categories: Variants of Concern (VOC) and Variants of Interest (VOI). The criteria for Variants of Concern are as follows:
- Increase in transmissibility or detrimental change in COVID-19 epidemiology; or
- Increase in virulence or change in clinical disease presentation; or
- Decrease in effectiveness of public health and social measures or available diagnostics, vaccines, therapeutics.
The WHO categorizes the following four variants as Variants of Concern (VOC):

The criteria for Variants of Interest (VOI) are as follows:
- has been identified to cause community transmission/multiple COVID-19 cases/clusters, or has been detected in multiple countries; OR
- is otherwise assessed to be a VOI by WHO in consultation with the WHO SARS-CoV-2 Virus Evolution Working Group.
The WHO categorizes the following six variants as Variants of Interest (VOI):

The two variants of concern that have garnered most of our attention recently are Alpha (B.1.1.7) and Delta (B.1.617.2). Alpha, first detected in the United Kingdom in September of 2020, has been detected in almost every country and all 50 states in the U.S. Up until this week, Alpha was the dominant variant in the United States, accounting for 60-70% of cases in May and early June.

Source: GISAID
Alpha is more infectious than other previously circulating B2 lineage isolates. There are two deletions and six other mutations in its spike protein. One mutation involves a change of one amino acid, an asparagine at position 501 in the receptor binding motif with a tyrosine. This enhances binding (affinity) to the ACE-2 receptor and may alone be responsible for the increased infectivity of this isolate. A study published March 10 in the British Medical Journal (BMJ) found that the risk of death increased by 64% in patients infected with Alpha compared to all other isolates (known at the time).
While Alpha continues to pose a threat, the increased prominence of the Delta variant (B.1.617.2), first identified in India, is a concern for several reasons.
First, there is some evidence to suggest that Delta is more transmissible than other variants, including Alpha. This may be due to a mutation, P681R, near the furin cleavage site, and/or due to a deletion in the N-terminal domain (NTD) of the spike protein. In Australia, public health officials have described a handful of cases where transmission of the Delta variant occurred after “fleeting encounters”— five to ten seconds of close contact between strangers in a public place like a gym or a restaurant.
Second, Delta leads to more severe infections. According to a recent study in Scotland, “Risk of COVID-19 hospital admission was approximately doubled in those with the Delta VOC when compared to the Alpha VOC.”
Lastly, there is evidence of reduced vaccine effectiveness with Delta. The variant appears to be particularly evasive in people who have had only one dose of vaccine. A Scottish study estimated the vaccine effect against Delta after one dose to be 30% for the Pfizer vaccine and 18% for the AstraZeneca vaccine. After two doses, it was 79% for Pfizer and 60% for AstraZeneca.
Considering these factors, it is not surprising that Delta is on track to overtake Alpha (B.1.1.7) as the dominant variant worldwide. In the past month, it accounted for 98.9% of isolations in India, 99% of isolations in the United Kingdom, 95.9% in Singapore, 95.1% in Indonesia, 98.3% in Israel, and 89.9% in Australia. In the United States, Delta has been the dominant variant for about a month; as of July 18, it accounted for 62.2% of isolations in the past four weeks, compared to 41.8% two weeks ago, 12.9% four weeks ago and 3.7% six weeks ago. This suggests the proportion of Delta cases is nearly doubling every week.

Source: GISAID
Two weeks ago, we warned that with the increased prevalence of Delta, the United States would see rises in infections, hospitalizations, and deaths, just as we’ve seen in India, the United Kingdom, and Israel. Over the coming weeks, we’ll see how differing public health responses (or lack thereof) impact these nations and our own. Despite rising case counts, hospitalizations, and deaths, the United Kingdom still plans to end most COVID-19 restrictions, including mask mandates and social distancing, on July 19.
Israel, by contrast, is taking steps to restrict travel into the country and will criminally charge people infected with COVID-19 who do not follow quarantine rules. Israel also reinstated its mask mandate at the end of June, following two school outbreaks. An estimated 57% of Israel’s population have received two doses of the Pfizer vaccine.
The CDC estimates that for the two-week period ending in July 3, the Delta variant made up 57% of US cases. The NY Times reports that nationwide, compared to the previous 14 days, COVID-19 cases are up 140% (compared to 14% two weeks ago). One state getting hit particularly hard by Delta is Missouri, where Delta accounts for 74% of COVID-19 cases. As of July 18, new COVID-19 cases in Missouri were up 102% compared to the previous 14 days, hospitalizations were up 45%, and deaths were up 27%. Some Missouri hospitals have run out of ventilators. The NY Times reports that as of July 18, only 40% of Missouri residents have been fully vaccinated. In the 12-17 age group only 26% have been vaccinated. Missouri never implemented a state-wide mask mandate, and most local mask mandates were lifted at the end of May, along with distancing and capacity restrictions for businesses. All state workers in Missouri were directed to return to in-person work by May 17.
Other states with significant increases in cases over the last 14 days are Tennessee (+340%), Alabama (+310%), Massachusetts (+291%), Puerto Rico (+249%), Vermont (+244%), California (+198%), Georgia (+193%), Florida (+193%), Louisiana (+176%), and New York (+167%). No state had a decrease in average daily cases over the last 14 days.
Keeping in mind the potential of variants to evade vaccines, I believe it’s important that we pay attention to instances of vaccine failure. Prior to April 30, 2021, the CDC reported all breakthrough infections. From January 1, 2021 to April 30, 2021, there were 10,262 breakthrough infections, 27% of which were asymptomatic and 995 of which were hospitalized. Of the hospitalized patients, 160 (16%) died.
Between May 1 and June 28, there were 4,686 breakthrough cases reported to the CDC that resulted in hospitalization or death. (The CDC no longer tracks breakthrough cases that do not result in hospitalization or death.) As of June 28, the CDC reports that 656 fully-vaccinated people have died of COVID-19. This means that 496 of those deaths occurred between May 1 and June 28. Whereas the period from January 1 to April 30 had an average of 40 COVID deaths per month in fully-vaccinated people, the period from May 1 to June 28 had an average of 248 deaths per month. This constitutes a 6-fold increase. We can’t say with certainty whether this increase in deaths is related to the rise in prevalence of the Delta variant, but there is certainly a correlation. Delta accounted for less than 1% of cases at the end of April, about 3% at the end of May, and an estimated 51% in the last two weeks of June.
Between May 1 and July 12, there were 5,492 breakthrough cases reported to the CDC that resulted in hospitalization or death, an increase of 806 from June 28. (The CDC no longer tracks breakthrough cases that do not result in hospitalization or death.) As of July 12, the CDC reports that 3,733 fully-vaccinated people have been hospitalized with COVID-19 and 791 fully-vaccinated people have died of COVID-19 (up from 656 on June 28). This means that 135 of those deaths occurred between June 29 and July 12. Whereas the period from January 1 to April 30 had an average of 40 COVID deaths per month in fully-vaccinated people, the period from May 1 to June 28 had an average of 248 deaths per month. Now we have an additional 135 deaths in just 14 days. We can’t say with certainty whether this increase in deaths is related to the rise in prevalence of the Delta variant, but there is certainly a correlation. Delta accounted for less than 1% of cases at the end of April, about 3% at the end of May, and an estimated 51% in the last two weeks of June.
Reporting from around the country suggests that Delta appears to be playing a role in the rise of infections in fully-vaccinated people. In Massachusetts, which has had at least 202 cases of Delta, the Boston Globe reports that 4,450 infections have occurred in vaccinated people. Of these, 303 patients were hospitalized and 79 died (26% of hospitalized, 1.77% of infected). By comparison, 34,929,856 infections have occurred in the United States with 624,606 deaths for a crude death rate of 1.78%.
On July 15, Clark County, Nevada reported 122 COVID-19 hospitalizations in fully-vaccinated people, with 18 deaths (14.7%) among those hospitalized and an additional two deaths of patients who were not hospitalized. The county no longer tracks breakthrough cases in folks who are not hospitalized, but the Southern Nevada Health District previously disclosed to the Las Vegas Review-Journal that, as of June 22, there had been 471 breakthrough infections, of which 53 patients were hospitalized, and 8 died. Based on this data, we can estimate the death rate for breakthrough infections in Clark County to be 1.69%. Clark County has also released demographic data for the hospitalized breakthrough cases. In 72% of cases, the patient was over the age of 65; males accounted for 66% of cases. A majority of cases (60%) were in white patients, 15% Black, 12% Hispanic, 7% Asian American or Pacific Islander, 3% other, and 2% unknown. Patients who had received the Pfizer vaccine accounted for 54% of hospitalizations, Moderna 23%, Johnson & Johnson 15%, and unknown 8%. Underlying medical conditions were present in 84% of hospitalized patients, including diabetes (38%), hypertension (54%), chronic lung disease (30%), chronic kidney disease (15%), neurological conditions (10%), immunocompromised (8%), and other conditions (59%). Nevada has had at least 1,066 cases of Delta.
In Illinois, NBC Chicago reports that as of July 14, 563 fully-vaccinated people have been hospitalized with COVID-19, and 151 of those (26.8%) have died. Illinois has had at least 313 cases of Delta.
In California, between January 1 and July 14, CDPH reports 14,365 COVID-19 infections in fully-vaccinated people, with 843 of these being hospitalized (5.9%). Of the hospitalized, 88 have died (10.4% of hospitalized). This puts the death rate for fully-vaccinated people who become infected at 0.6%. California has had at least 2,871 cases of Delta.
We want to stress that the COVID-19 vaccines are still highly effective for preventing hospitalizations and deaths. Those who are not vaccinated should get vaccinated as quickly as possible. Folks who are vaccinated should continue to rely on additional layers of protection against COVID-19, like masking indoors and avoiding gatherings. To protect employees and avoid outbreaks, employers should continue to require masking in the workplace. It’s important to keep in mind that the clinical trial efficacy data that we have for the vaccines is based on a population who were most likely masking indoors for the duration of the trial. We should, therefore, assume that the vaccines are most effective when people are also masking. Public health agencies that want to control the spread of COVID-19 should follow the example of Los Angeles County Public Health and institute indoor mask mandates (for both the unvaccinated and vaccinated) as soon as possible.
Variants of (Slightly Less) Concern
At 2,439 cases, the United States has the second highest number of isolations of the Beta variant (B.1.351, first identified in South Africa), and 6 of these were in the last four weeks. The Beta variant now accounts for only 0.1% of isolations in the U.S.
The United States still has the most isolations of the Gamma variant (P.1) in the world, with 20,645 overall and 697 in the past four weeks. Gamma accounted for 6.4% of isolations in the past month, down from 9.2% two weeks ago. Gamma still accounts for 85.9% of infections in Brazil.

The WHO has also recently labeled the Lambda variant (C.37), which was first identified in Peru in August of 2020, as a variant of interest. The United States has the second largest number of isolations of Lambda, after Chile, with 706 total and 32 in the past four weeks. Lambda causes over 80% of infections in Peru, which experienced a surge in new cases this spring and, as of July 17, has had 2,093,754 infections and 195,146 deaths. Strangely, some South American countries (Peru, Colombia) have stopped reporting new isolations of Lambda to GISAID.

COVID-19 in California
The following data were reported by the California Department of Public Health:
| Total Cases | New Cases | Total Deaths | New Deaths | Hospitalized | In ICU | Fully Vaccinated | |
| 6/4/21 | 3,687,736 | 1,047 | 62,179 | 87 | 1,062 | 260 | 17,662,712 |
| 6/5/21 | 3,688,893 | 1,157 | 62,242 | 63 | 1,042 | 243 | 17,813,305 |
| 6/6/21 | 3,689,994 | 1,101 | 62,470 | 228 | 1,035 | 221 | 17,947,342 |
| 6/7/21 | 3,690,868 | 874 | 62,473 | 3 | 1,011 | 219 | 18,011,744 |
| 6/8/21 | 3,691,660 | 792 | 62,479 | 6 | 1,015 | 228 | 18,100,412 |
| 6/9/21 | 3,692,506 | 846 | 62,499 | 20 | 1,030 | 231 | 18,240,912 |
| 6/10/21 | 3,693,362 | 856 | 62,538 | 39 | 1,001 | 234 | 18,431,265 |
| 6/11/21 | 3,694,498 | 1,136 | 62,593 | 55 | 982 | 233 | 18,542,484 |
| 6/12/21 | 3,695,530 | 1,032 | 62,508 | -85 | 955 | 240 | 18,637,504 |
| 6/13/21 | 3,696,472 | 942 | 62,512 | 4 | 915 | 241 | 18,694,365 |
| 6/14/21 | 3,697,299 | 827 | 62,505 | -7 | 939 | 239 | 18,731,215 |
| 6/15/21 | 3,697,927 | 628 | 62,515 | 10 | 977 | 251 | 18,875,034 |
| 6/16/21 | 3,698,626 | 699 | 62,534 | 19 | 981 | 242 | 18,970,053 |
| 6/17/21 | 3,699,455 | 829 | 62,565 | 31 | 956 | 232 | 19,074,396 |
| 6/18/21 | 3,700,750 | 1,295 | 62,622 | 57 | 951 | 233 | 19,164,548 |
| 6/19/21 | 3,702,237 | 1,487 | 62,661 | 39 | 1,271 | 19,164,548 | |
| 6/20/21 | 3,702,882 | 645 | 62,689 | 28 | 1,249 | 19,164,548 | |
| 6/21/21 | 3,704,005 | 1,123 | 62,693 | 4 | 929 | 238 | 19,343,396 |
| 6/22/21 | 3,704,640 | 635 | 62,701 | 8 | 949 | 243 | 19,398,536 |
| 6/23/21 | 3,705,427 | 787 | 62,741 | 40 | 978 | 287 | 19,454,555 |
| 6/24/21 | 3,706,846 | 1,419 | 62,822 | 81 | 955 | 274 | 19,541,124 |
| 6/25/21 | 3,708,861 | 2,015 | 62,890 | 68 | 959 | 274 | 19,621,174 |
| 6/26/21 | 3,711,928 | 3,067 | 62,959 | 69 | 959 | 274 | 19,621,174 |
| 6/27/21 | 3,712,795 | 867 | 62,990 | 31 | 959 | 274 | 19,621,174 |
| 6/28/21 | 3,714,051 | 1,256 | 62,994 | 4 | 980 | 290 | 19,880,275 |
| 6/29/21 | 3,714,813 | 762 | 62,999 | 5 | 1,050 | 288 | 19,941,886 |
| 6/30/21 | 3,710,454 | 2,013 | 63,023 | 24 | 1,089 | 307 | 20,014,043 |
| 7/1/21 | 3,712,152 | 1,698 | 63,096 | 73 | 1,090 | 300 | 20,073,302 |
| 7/2/21 | 3,713,944 | 1,792 | 63,141 | 45 | 1,071 | 295 | 20,073,302 |
| 7/3/21 | 3,715,377 | 1,433 | 63,165 | 24 | 1,071 | 295 | 20,073,302 |
| 7/4/21 | 3,716,810 | 1,433 | 63,189 | 24 | 1,071 | 295 | 20,073,302 |
| 7/5/21 | 3,718,243 | 1,433 | 63,213 | 24 | 1,071 | 295 | 20,073,302 |
| 7/6/21 | 3,719,674 | 1,433 | 63,238 | 24 | 1,153 | 298 | 20,240,207 |
| 7/7/21 | 3,721,006 | 1,332 | 63,259 | 21 | 1,228 | 299 | 20,296,653 |
| 7/8/21 | 3,722,422 | 1,416 | 63,317 | 58 | 1,319 | 318 | 20,371,928 |
| 7/9/21 | 3,724,833 | 2,411 | 63,376 | 59 | 1,343 | 121 | 20,417,009 |
| 7/10/21 | 3,727,803 | 2,970 | 63,408 | 32 | 1,343 | 121 | 20,417,009 |
| 7/11/21 | 3,730,773 | 2,970 | 63,440 | 32 | 1,343 | 121 | 20,417,009 |
| 7/12/21 | 3,733,743 | 2,970 | 63,472 | 32 | 1,484 | 341 | 20,518,392 |
| 7/13/21 | 3,736,999 | 3,256 | 63,478 | 6 | 1,594 | 357 | 20,562,625 |
| 7/14/21 | 3,740,092 | 3,093 | 63,508 | 30 | 1,648 | 359 | 20,615,554 |
| 7/15/21 | 3,743,714 | 3,622 | 63,533 | 25 | 1,731 | 379 | 20,664,238 |
| 7/16/21 | 3,748,365 | 4,651 | 63,598 | 65 | 1,770 | 403 | 20,705,050 |
*Data for 7/3/21-7/6/21 and 7/10/21-7/12/21 were reported in bulk on 7/6/21 and 7/12/21, respectively. We’ve divided the new cases evenly among those days.

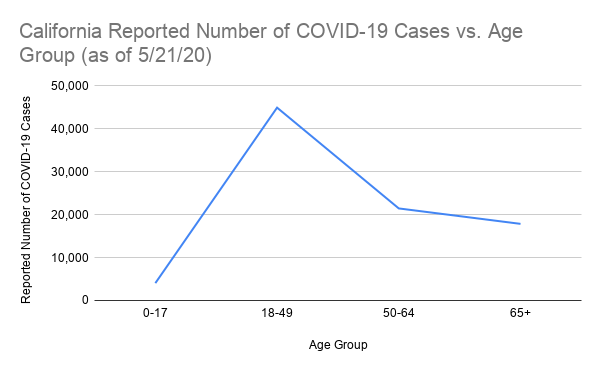
An examination of cases broken down by age group reveals that the 18-49 age group continues to have the highest rate of infection. There was a marked increase in new daily cases in this age group from July 8 to July 16, with moderate increases for the other three age groups.

Despite the availability of vaccines for children 12 and up, in California, we have not seen a marked decrease in the number of new cases in children over the past two weeks. From July 3 to July 16, the 0-17 age group averaged 369 new infections per day, a 33% increase compared to the previous 14-day period. (The daily average for June 19-July 2 was 276.) As of July 14, the California Department of Public Health reports 7 deaths in children under the age of 5 (an increase of 3 since June 30) and 21 deaths in children ages 5-17 (an increase of 3 since June 30). To date, 490,318 children in California have been infected with COVID-19. The US Census Bureau estimates that there are 8,890,250 children in California, so approximately 5.5% of children have had a documented case of COVID-19.
Watching World Data
Over the next few months, we’ll be paying close attention to correlations between the SARS-CoV-2 data, the number of isolates identified in various countries and states, and the non-pharmaceutical interventions (like mask mandates and lockdowns) put in place by state and national governments. Data on infections, deaths, and percent of population infected was compiled from Worldometers. Data for this table for SARS-CoV-2 Isolates Currently Known in Location was compiled from GISAID and the CDC. It’s worth noting that GISAID provided more data than the CDC.
| Location | Total Infections as of 7/02/21 | New Infections on 7/02/21 | Total Deaths | New Deaths on 7/02/21 | % of Pop.Infected | SARS-CoV-2 Isolates Currently Known in Location | National/ State Mask Mandate? | Currently in Lockdown? |
| World | 190,270,873(6,453,915 new infections in 14 days) | 562,817 | 4,091,488(111,620 new deaths in 14 days) | 8,653 | 2.44% | B2 lineageAlpha/B.1.1.7 (UK)Eta/B.1.525 (Nigeria/UK)Iota/B.1.526 (USA-NYC)Beta/B.1.351 (SA)Epsilon/B.1.427 + B.1.429 (USA)*Gamma/P.1 (Brazil)Zeta/P.2 (Brazil)A lineage isolateV01.V2 (Tanzania)APTK India VOC 32421Delta/B.1.617.2 (India)BV-1 (Texas, USA)Kappa/B.1.617.1 (India)Lambda/C.37 (Peru)Theta/P.3 (Philippines) | No | No |
| USA | 34,929,856 (ranked #1) | 40,529 (ranked #4) | 624,606 (ranked #1) | 293 | 10.48% | B2 lineageAlpha/B.1.1.7 (UK)Eta/B.1.525 (Nigeria/UK)Iota/B.1.526 (USA-NYC)Beta/B.1.351 (SA)Epsilon/B.1.427 + B.1.429 (USA)*Gamma/P.1 (Brazil)Zeta/P.2 (Brazil)Delta/B.1.617.2 (India)BV-1 (Texas, USA)Theta/P.3 (Philippines) Theta/P.3 (Philippines) Kappa/B.1.617.1 (India)Lambda/C.37 (Peru) | No | No |
| Brazil | 19,308,108(ranked #3) | 45,591(ranked #3) | 540,500(ranked #2) | 1,450 | 9.01% | B2 lineageAlpha/B.1.1.7 (UK)Beta/B.1.351 (SA)Gamma/P.1 (Brazil)Zeta/P.2 (Brazil)Lambda/C.37 (Peru) | No | No |
| India | 31,063,987(ranked #2) | 38,112(ranked #5) | 413,123(ranked #3) | 560 | 2.22% | B2 lineageAlpha/B.1.1.7 (UK)Beta/B.1.351 (SA)Gamma/P.1 (Brazil)Epsilon/B.1.427 + B.1.429 (USA)*Eta/B.1.525 (Nigeria/UK)APTK India VOC 32421Delta/B.1.617.2 (India)Kappa/B.1.617.1 (India)Iota/B.1.526 (USA-NYC) | No | No |
| United Kingdom | 5,332,371(ranked #7) | 51,870(ranked #2) | 128,642 | 49 | 7.81% | B2 lineageAlpha/B.1.1.7 (UK)Eta/B.1.525 (Nigeria/UK)Beta/B.1.351 (SA)Epsilon/B.1.427 + B.1.429 (USA)*Gamma/P.1 (Brazil)Delta/B.1.617.2 (India)Theta/P.3 (Philippines) Kappa/B.1.617.1 (India)Lambda/C.37 (Peru) | No | No |
| California, USA | 3,748,365(ranked #11 in world) | 4,651 | 63,598 | 65 | 9.76% | B2 lineageAlpha/B.1.1.7 (UK)Eta/B.1.525 (Nigeria/UK)Beta/B.1.351 (SA)Gamma/P.1 (Brazil)Epsilon/B.1.427 + B.1.429 (USA)*Zeta/P.2 (Brazil)Delta/B.1.617.2 (India)Theta/P.3 (Philippines) Kappa/B.1.617.1 (India)Lambda/C.37 (Peru) | No | No |
| Mexico | 2,525,350(ranked #16) | 12,288 | 235,740(ranked #4) | 235 | 2.01% | B2 lineageAlpha/B.1.1.7 (UK)Epsilon/B.1.427 + B.1.429 (USA)*Gamma/P.1 (Brazil)Delta/B.1.617.2 (India)Kappa/B.1.617.1 (India)Lambda/C.37 (Peru) | No | No |
| South Africa | 2,269,179(ranked #17) | 15,939 | 66,385 | 413 | 3.77% | B2 lineageAlpha/B.1.1.7 (UK)Beta/B.1.351 (SA)Delta/B.1.617.2 (India)Kappa/B.1.617.1 (India) | No | No |
| Canada | 1,422,641(ranked #25) | 395 | 26,489 | 17 | 3.73% | B2 lineageAlpha/B.1.1.7 (UK)Eta/B.1.525 (Nigeria/UK)Epsilon/B.1.427 + B.1.429 (USA)*Gamma/P.1 (Brazil)Delta/B.1.617.2 (India)Kappa/B.1.617.1 (India)Lambda/C.37 (Peru) | Yes, except Alberta Province | No |
| Poland | 2,881,241(ranked #14) | 93 | 75,205 | 14 | 7.62% | B2 lineageAlpha/B.1.1.7 (UK)Eta/B.1.525 (Nigeria/UK)Beta/B.1.351 (SA)Delta/B.1.617.2 (India) | No | No |
| Turkey | 5,514,373(ranked #6) | 6,918 | 50,450 | 35 | 6.46% | B2 lineageAlpha/B.1.1.7 (UK)Eta/B.1.525 (Nigeria/UK)Beta/B.1.351 (SA)Epsilon/B.1.427 + B.1.429 (USA)*Gamma/P.1 (Brazil)Lambda/C.37 (Peru) | No | No |
| Russia | 5,907,988(ranked #4) | 25,704 | 148,868 | 799 | 4.04% | B2 lineageAlpha/B.1.1.7 (UK)Beta/B.1.351 (SA)Delta/B.1.617.2 (India) | No | No |
| Argentina | 4,737,213(ranked #8) | 17,261 | 101,158 | 463 | 10.38% | B2 lineageAlpha/B.1.1.7 (UK)Eta/B.1.525 (Nigeria/UK)Beta/B.1.351 (SA)Epsilon/B.1.427 + B.1.429 (USA)*Gama/P.1 (Brazil)Delta/B.1.617.2 (India)Lambda/C.37 (Peru) | No | No |
| Colombia | 4,601,355(ranked #9) | 17,893 | 115,333 | 500 | 8.94% | B2 lineageAlpha/B.1.1.7 (UK)Beta/B.1.351 (SA)Gamma/P.1 (Brazil)Epsilon/B.1.427 + B.1.429 (USA)*Iota/B.1.526 (USA-NYC)Lambda/C.37 (Peru) | No | No |
| Peru | 2,090,175(ranked #19) | 2,032 | 194,935(ranked #5) | 90 | 6.24% | B2 lineageAlpha/B.1.1.7 (UK)Gamma/P.1 (Brazil)Iota/B.1.526 (USA-NYC)Lambda/C.37 (Peru) | No | No |
| Indonesia | 2,780,803(ranked #15) | 54,000 | 71,597 | 1,205 | 1.00% | B2 lineageAlpha/B.1.1.7 (UK)Delta/B.1.617.2 (India)Beta/B.1.351 (SA)Eta/B.1.525 (Nigeria/UK)Theta/P.3 (Philippines) Iota/B.1.526 (USA-NYC)Kappa/B.1.617.1 (India) | No | No |
| Iran | 3,485,940(ranked 13th) | 21,885 | 86,791 | 199 | 4.09% | B2 lineageAlpha/B.1.1.7 (UK)Delta/B.1.617.2 (India)Beta/B.1.351 (SA) | No | No |
| Spain | 4,100,222(ranked 11th) | 31,060 | 81,096 | 12 | 8.76% | B2 lineageAlpha/B.1.1.7 (UK)Delta/B.1.617.2 (India)Beta/B.1.351 (SA)Gamma/P.1 (Brazil)Epsilon/B.1.427 + B.1.429 (USA)*Eta/B.1.525 (Nigeria/UK)Iota/B.1.526 (USA-NYC)Kappa/B.1.617.1 (India) | No | No |
*Also referred to as CAL.20C
SARS-CoV-2, Children, and MIS-C/PIMS
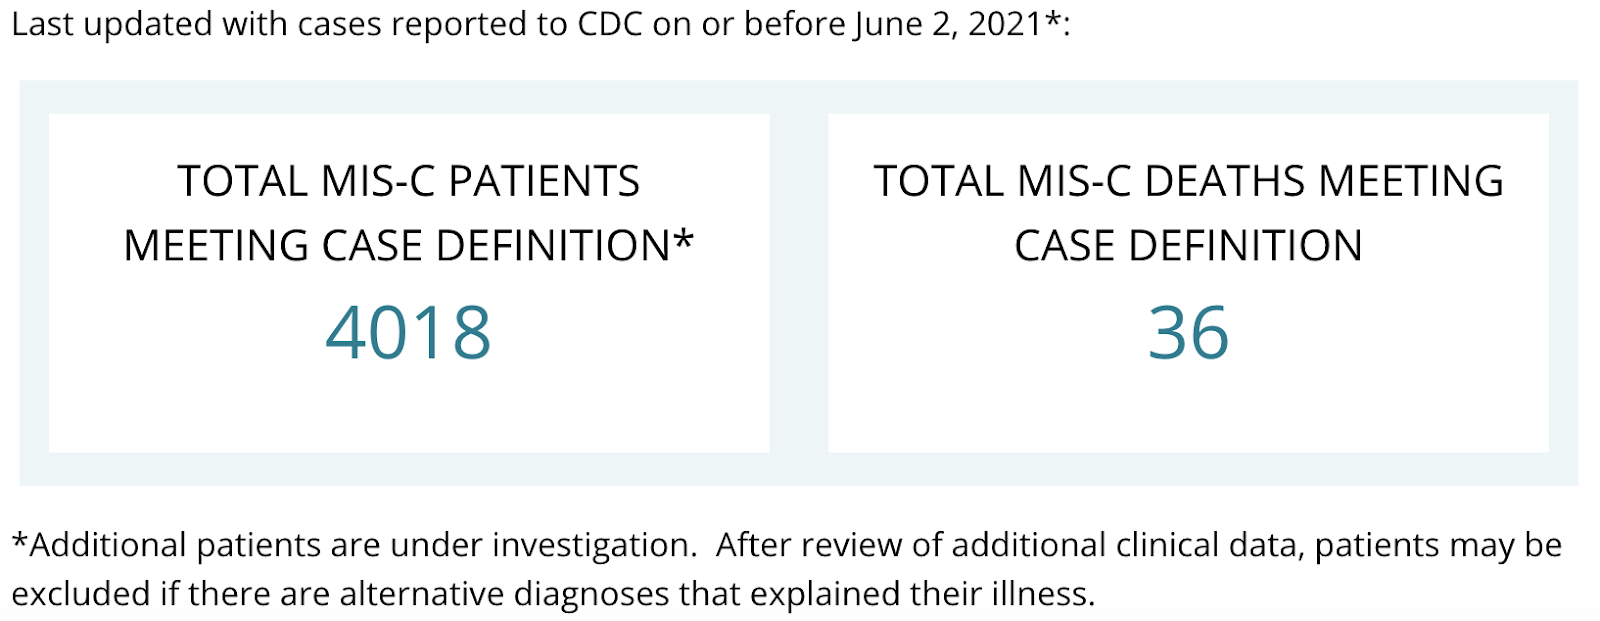
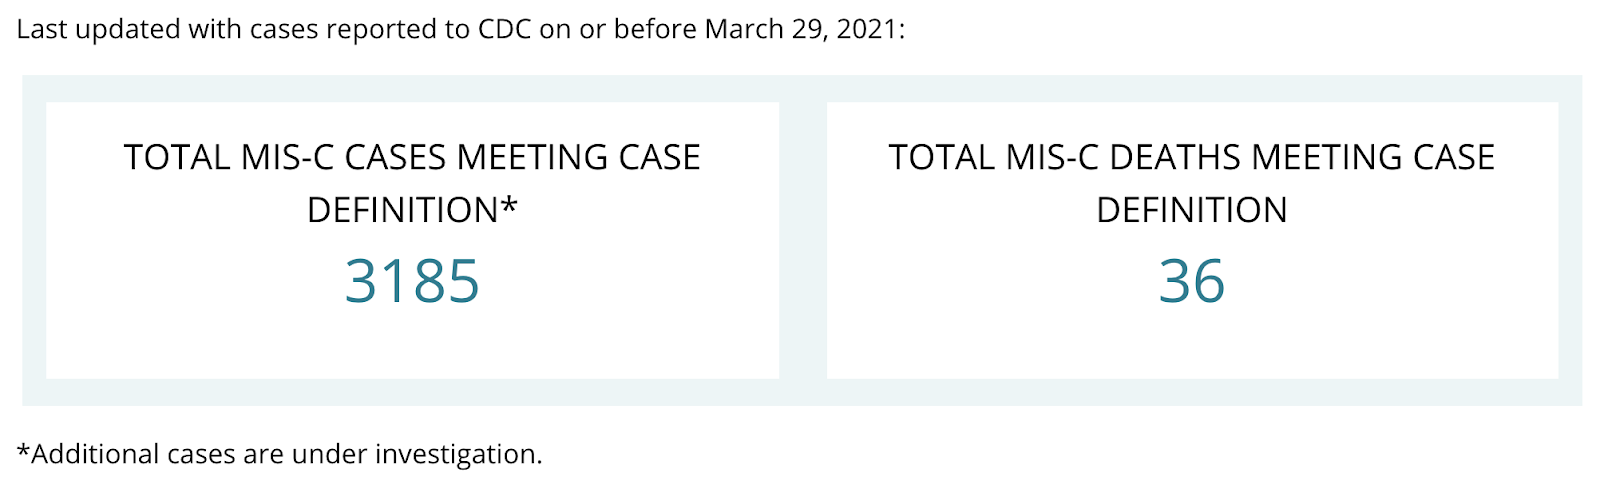
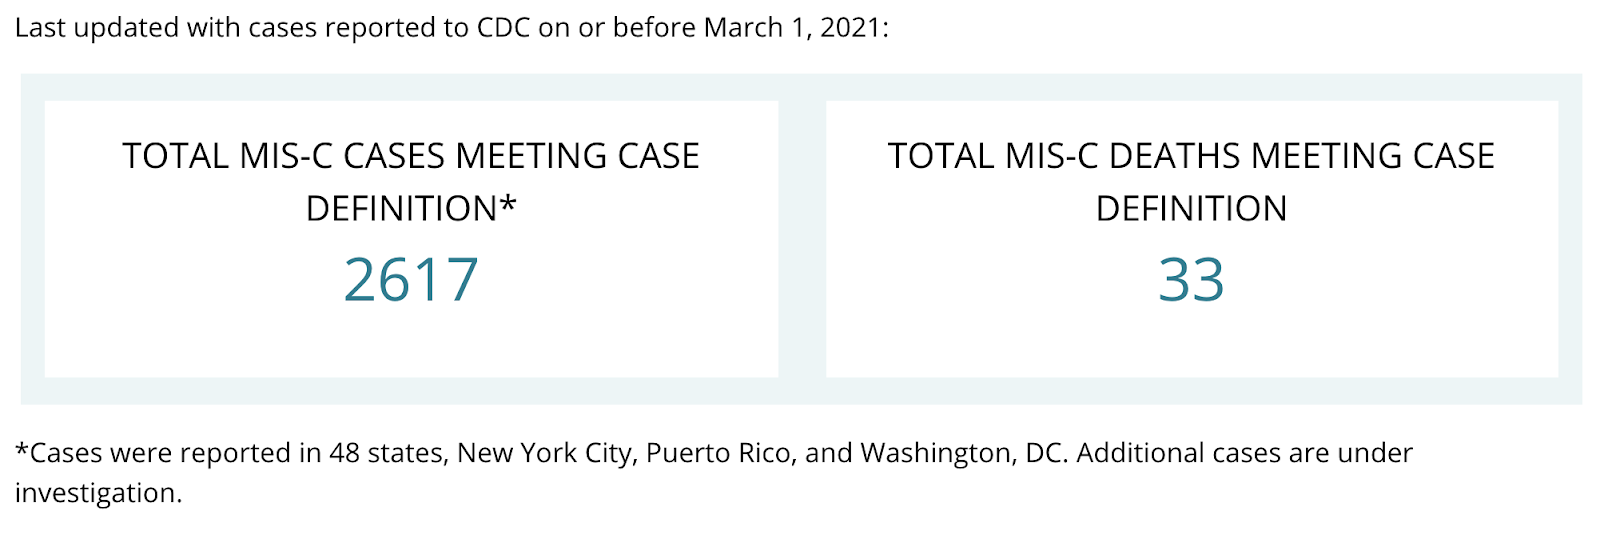
I’m pleased to see that COVID-19 cases and MIS-C (PIMS) cases in children in the US are finally getting national attention. The CDC now tracks total MIS-C cases and deaths in children and young adults up to 20 years old in the United States. As of June 28, CDC reported 4,196 cases of MIS-C that meet the case definition and 37 deaths—that’s 178 new cases and one new death since the June 2 report. The CDC notes, “As of October 1, the number of cases meeting the case definition for multisystem inflammatory syndrome in children (MIS-C) in the United States surpassed 1,000. As of February 1, this number surpassed 2,000, and exceeded 3,000 as of April 1.” This means it took seven months to reach 1,000 MIS-C cases, only four months to reach an additional 1,000 cases, and only two months to add an additional 1,185 cases. This suggests to us that variants are causing more MIS-C.
| Date of Reporting | Total MIS-C Patients | Change Since Last Report | Total MIS-C Deaths | Change Since Last Report |
| 6/28/2021 | 4196 | +178 | 37 | +1 |
| 6/2/2021 | 4018 | +276 | 36 | +1 |
| 5/3/2021 | 3742 | +557 | 35 | -1 |
| 3/29/2021 | 3185 | +568 | 36 | +3 |
| 3/1/2021 | 2617 | — | 33 | — |
Schools in the United States have been open throughout the pandemic, with teachers and education support professionals demonstrating their extraordinary ability to adapt in adverse circumstances. Teachers all over the country reinvented their teaching, taking their classrooms online in order to provide safe and remote learning experiences for students. The so-called “reopening” of schools, which more accurately refers to the opening of school buildings, as schools never closed, has been highly politicized, with many governors issuing mandates for in-person instruction, even as case counts, hospitalizations, and deaths in their states rose exponentially. The CDC has maintained that transmission risk in schools is minimal, provided that adequate safety measures are taken; however, we know that many states have not properly enforced universal masking (and some have repealed mask mandates), and we know that many school facilities are not equipped with the proper air handling systems. With more school buildings opening, there is a growing body of research that suggests that COVID-19 transmission can and does happen in schools.
After recommending for months that school buildings be open, in mid-February (a year into the pandemic), The American Academy of Pediatrics, in collaboration with the Children’s Hospital Association, finally began tracking data on COVID-19 in children at the state and national level. Data reporting by states is still voluntary, and every state is different in its willingness to collect and disclose data on infections, hospitalizations, deaths, and testing rates in children.
As of the APA’s July 8 report, only 11 states provide age distribution for testing. This makes it difficult to hold states accountable for testing each age group in proportion to its population. We’ve seen a trend in states where testing data with age distribution is available that children are tested at lower rates than adults. Test positivity rate among children ranged from 4.9% to 34.9% and children made up between 6% and 19.9% of total state tests in the 11 states that report testing data to APA.
Hospitalization data by age group is only available in 24 states and New York City, so we only understand the severity of COVID-19 infections in children for about half the country. From July 1-8, 103 more children in these states were hospitalized with COVID-19.
Age distribution for cases is provided by 49 states, New York City, the District of Columbia, Puerto Rico, and Guam. Age distribution for deaths is provided in 43 states, New York City, Puerto Rico, and Guam. It’s worth noting that New York State does not provide age data for cases, testing, hospitalizations, and deaths. Two states, Florida and Utah, only report cases in children aged 0-14, so the number of cases, hospitalizations, and deaths in children ages 15-17 is unknown in these states. As of June 30, the state of Nebraska no longer reports daily COVID-19 data and has taken down its online COVID-19 dashboard.
In the week from July 1 to July 8, 19,482 COVID-19 cases in children were reported. The current case in children is 5,400 per 100,000. By comparison, according to Worldometers, the overall case rate per 100,000 people in the United States on July 18 was 10,498 cases per 100,000. As of July 8, children represented 14.2% of all COVID-19 cases reported to APA. A total of 344 child deaths due to COVID-19 were reported in 43 states; this is an increase of 9 child deaths since July 1. The following states do not report child mortality due to COVID-19: Michigan, Montana, New Mexico, New York, Rhode Island, South Carolina, and West Virginia.
The AAP has also recently recommended that all children older than 2 years and all teachers and school staff wear masks in school, regardless of vaccination status.
If we truly want to keep children safe, especially as many school buildings open for in-person instruction, we need to collect more complete data in every state on child testing rates, cases, hospitalizations, and deaths.
Vaccinating America’s Children
The New York Times reports that nationally, 56.6% of people 12 and up are fully vaccinated, while 59.3% of people 18 and up are fully vaccinated, according to the CDC. Only 48.4% of the total population is fully vaccinated. According to the CDC, at the current pace, it will take another year to get 85% of people 12 and older fully vaccinated.
Some states are falling far behind when it comes to getting children—and the general population—fully vaccinated. Alabama and Mississippi have only fully vaccinated 34% of their population. Vermont, Maine, Massachusetts, and Connecticut have fully vaccinated more than 60% of their population, with Vermont having the highest vaccination rate at 67%. California has fully vaccinated 52% of their population.
The Road Ahead
President Biden has made the pandemic a first priority and has now ordered enough vaccines to vaccinate everyone who wants a vaccination by the end of this month. As of 7/7/21, the CDC reports that 182.8 million people (approximately 55.1% of the population) have had one dose of any vaccine. 157.9 million people (47.6% of the population) are fully vaccinated. The rate of people who are fully vaccinated has increased by less than 3% in the past two weeks.
As of May 10, all people in the U.S. over the age of 12 are eligible to receive a vaccine. The Biden administration has already exceeded its goal of administering 200 million doses of vaccine in the first 100 days of the administration. The Pfizer-BioNtech is already approved for ages 12-15 and the Moderna vaccine should be approved in June 2021. Moderna has applied for emergency use authorization to administer their mRNA vaccines to children aged 12-15. Testing is ongoing for children in younger age groups and may be approved for ages 2-11 by the end of September 2021.
Testing, wearing masks, social distancing and washing our hands frequently should no longer be political issues. These are non-pharmaceutical interventions used by most successful countries and some states to protect their citizens and their economies. New Zealand, Taiwan, and Australia are three countries that have done this successfully. In the United States, Hawaii is doing a better job handling the pandemic than many of our states. These interventions and vaccination should keep the pandemic from overwhelming our health care delivery systems world-wide. New mutations like Epsilon/B.1.427 + B.1.429 and the Alpha, Beta, Gamma, and Delta variants will probably spread rapidly throughout the United States over the next 90 days as many states (ex. Texas, Florida, Iowa, Mississippi, Wyoming and South Carolina) open up everything and do away with masking and social distancing. We will probably see increased new infections per day in the United States. In the UK, Alpha/B.1.1.7, has increased the number of infections, hospitalizations and deaths. This and other mutants may do the same thing in the USA.
The Pfizer and Moderna RNA vaccines and the Johnson & Johnson single dose vaccination adenovirus vaccine are all being used to immunize people in the USA. The Oxford-AstraZeneca vaccine and the Novavax vaccine may be available in the fourth quarter of 2021.
The bad news is that all currently available vaccines are based on the spike protein sequence identified in China in December 2019. Mutated isolates, as discussed above, may overtake our ability to produce new vaccines and vaccinate the populace. Like Influenza vaccines, we may have to reformulate vaccines based on active, worldwide surveillance at least every 4 to 6 months. The FDA is currently putting together a guidance document for how to develop booster vaccines for SARS-CoV-2 mutations. A surrogate marker of protection like antibody to the mutated Receptor Binding Domains of SARS-CoV-2 should be considered for vaccine approval.
The ideal approach to addressing the major mutations on at least five continents would be to make vaccines against each of the mutations. I’d get all of the vaccine companies and contract production companies on a call and “suggest” that two companies at least make and mass produce one of the four mutations. The government would pay the cost and buy at least 200 million doses in advance for each variant at say $40 a dose. The total cost to purchase the vaccine (800 million doses) would only be 32 billion dollars. Give each company a billion dollars each for development costs (another 8 billion dollars). Spend another two billion dollars for syringes and you’ve got enough booster doses to vaccinate 200 million people for all 4 variants. 42 billion dollars would be a small price to pay to catch up with the current mutations. Even if you had to do this every two years, it would be well worth the dollars spent.

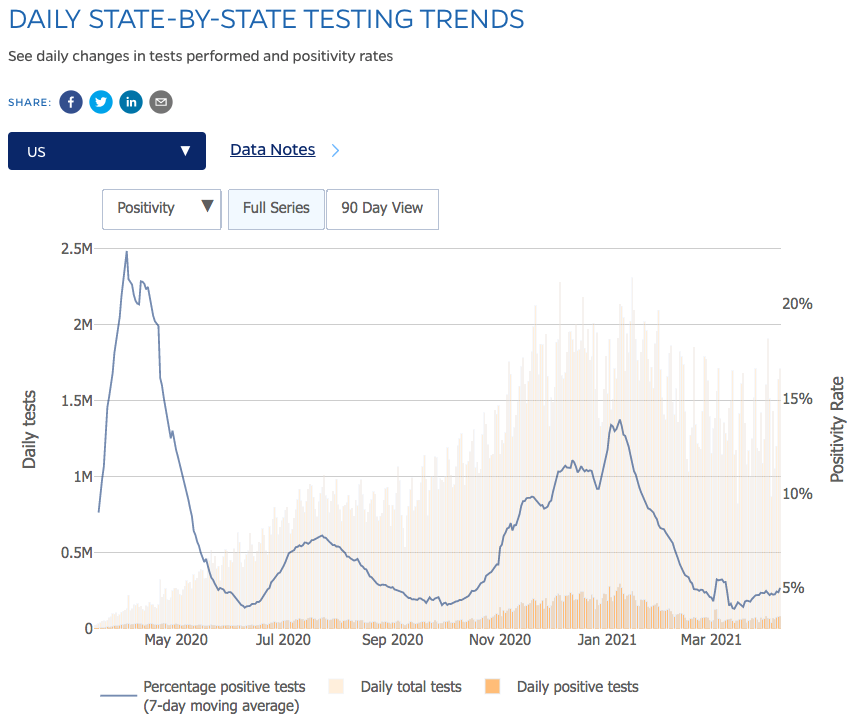
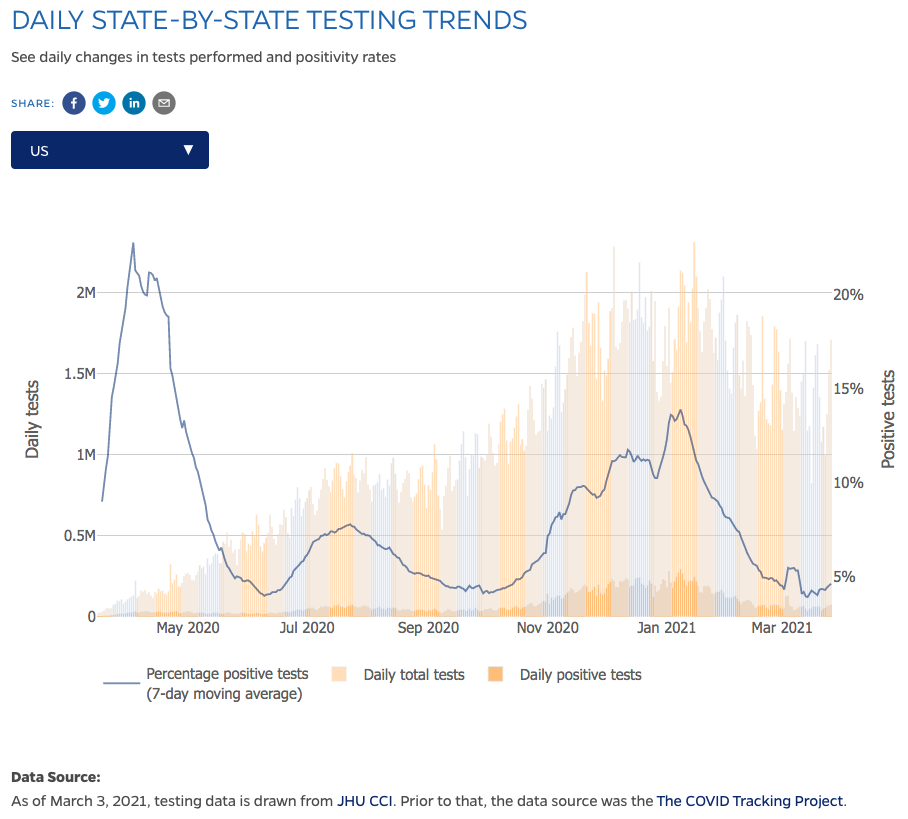
We are not doing adequate numbers of PCR or antigen detection assays in the United States. According to Johns Hopkins University Coronavirus Resource Center, in January of 2021, we were doing up to 2,307,949 tests per day. In March 2021, the highest number of tests per day was 1,709,210, and in April, the highest number of tests per day was 2,008,319. Currently, we’re doing 665,774 tests per day (7-day moving average).
We still need to perform more virus isolations and perform more DNA sequencing of viruses in each country, state, populous city, and county if we are to rapidly identify new mutations. In December 2020, WHO asked countries to increase their sequencing rates, and the European Commission asked member states to set a goal of 10%. The CDC then set a goal of 5% for the United States. As of July 18, according to GISAID, the United States had a SARS-CoV-2 genome sequencing rate of 1.89%, whereas the United Kingdom had a genome sequencing rate of 10.7%. I’m more hopeful that we will have the facilities, the equipment, and the trained staff needed to perform this work. As a nation we still need to make and distribute more vaccines to other countries, new vaccines directed against mutants, and the necessary rapid tests and protective equipment needed by medical staff, first responders, essential workers and especially teachers and students. I’m still hopeful we can work together on our and the world’s infectious disease problems.
What Our Team Is Reading This Week
- Physical phenotype of blood cells is altered in COVID-19 (Biophysical Journal) https://www.cell.com/biophysj/fulltext/S0006-3495(21)00454-9
- Post-vaccination SARS-CoV-2 infection: risk factors and illness profile in a prospective, observational community-based case-control study (Preprint) https://www.medrxiv.org/content/10.1101/2021.05.24.21257738v2.full.pdf
- Nasal ciliated cells are primary targets for SARS-CoV-2 replication in the early stage of COVID-19 (Journal of Clinical Investigation) https://www.jci.org/articles/view/148517
- Clinical and Virological Features of SARS-CoV-2 Variants of Concern: A Retrospective Cohort Study Comparing B.1.1.7 (Alpha), B.1.315 (Beta), and B.1.617.2 (Delta) (Lancet Preprint) https://papers.ssrn.com/sol3/papers.cfm?abstract_id=3861566
- Prevalence of ongoing symptoms following coronavirus (COVID-19) infection in the UK (Office for National Statistics) https://www.ons.gov.uk/peoplepopulationandcommunity/healthandsocialcare/conditionsanddiseases/datasets/alldatarelatingtoprevalenceofongoingsymptomsfollowingcoronaviruscovid19infectionintheuk
- Prevalence of Symptoms More Than Seven Months After Diagnosis of Symptomatic COVID-19 in an Outpatient Setting (Annals of Internal Medicine) https://www.acpjournals.org/doi/10.7326/M21-0878
- New Coronavirus Variants Seen as Too Contagious for Hotel Quarantines (Wall Street Journal) https://www.wsj.com/articles/new-variants-seen-as-too-contagious-for-hotel-quarantines-11626095999
- A leading US disease expert says there’s ‘no doubt in my mind’ that vaccinated people are helping spread Delta (Business Insider) https://www.businessinsider.com/covid-expert-vaccinated-people-can-spread-the-delta-variant-2021-7
- California Capitol reinstates mask mandate after COVID outbreak (SF Chronicle) https://www.sfchronicle.com/health/article/California-Capitol-reinstates-mask-mandate-after-16299418.php
- Most Inmates Have Had Their Covid Shots — But Their Guards Likely Haven’t (Kaiser Health News) https://khn.org/news/article/prison-inmates-corrections-officials-vaccine-hesitancy/
- Where Are The Newest COVID Hot Spots? Mostly Places With Low Vaccination Rates (NPR) https://www.npr.org/sections/health-shots/2021/07/09/1014512213/covid-is-surging-in-new-hotspots-driven-by-low-vaccination-rates
- Delta Variant Surge Prompts New Mississippi Mask Guidance (Mississippi Free Press) https://www.mississippifreepress.org/13651/a-perfect-breeding-ground-for-delta-covid-19-surge-prompts-mississippi-mask-guidance/
- Tennessee vaccination outreach to minors halted, not just for COVID-19 (The Tennessean) https://www.tennessean.com/story/news/health/2021/07/13/tennessee-halts-all-vaccine-outreach-minors-not-just-covid-19/7928701002/
- Vaccinated Ontario mother, son say they contracted COVID-19 from basement tenant (Global News) https://globalnews.ca/news/8021706/vaccinated-ontario-mother-son-contract-covid/
- Multiple Pasadena residents infected with delta variant (Pasadena Star News) https://www.pasadenastarnews.com/2021/07/14/multiple-pasadena-residents-infected-with-delta-variant/
- COVID breakthrough cases hit vaccinated hospital workers (Las Vegas Review-Journal) https://www.reviewjournal.com/life/health/covid-case-cluster-hits-vaccinated-las-vegas-hospital-workers-2398382/
- 79 fully vaccinated Massachusetts residents have died, 303 hospitalized in very rare COVID ‘breakthrough’ cases, officials say (The Boston Globe) https://www.bostonglobe.com/2021/07/13/nation/state-says-number-covid-cases-vaccinated-people-is-incredibly-low/
- CDC State and County COVID-19 Forecast, July 12, 2021 https://www.cdc.gov/coronavirus/2019-ncov/downloads/science/forecasting/cases/july2021/Consolidated-Cases-Forecasts-2021-07-12.pdf


You must be logged in to post a comment.