
It’s time for our next 14-day moving average determinations for SARS-CoV-2 for the United States and my thoughts on vaccines, SARS-CoV-2 therapeutic agents and mutant viruses. We use the WORLDOMETERS aggregators data set to make any projections since it includes data from the Department of Veterans Affairs, the U.S. Military, federal prisons and the Navajo Nation.

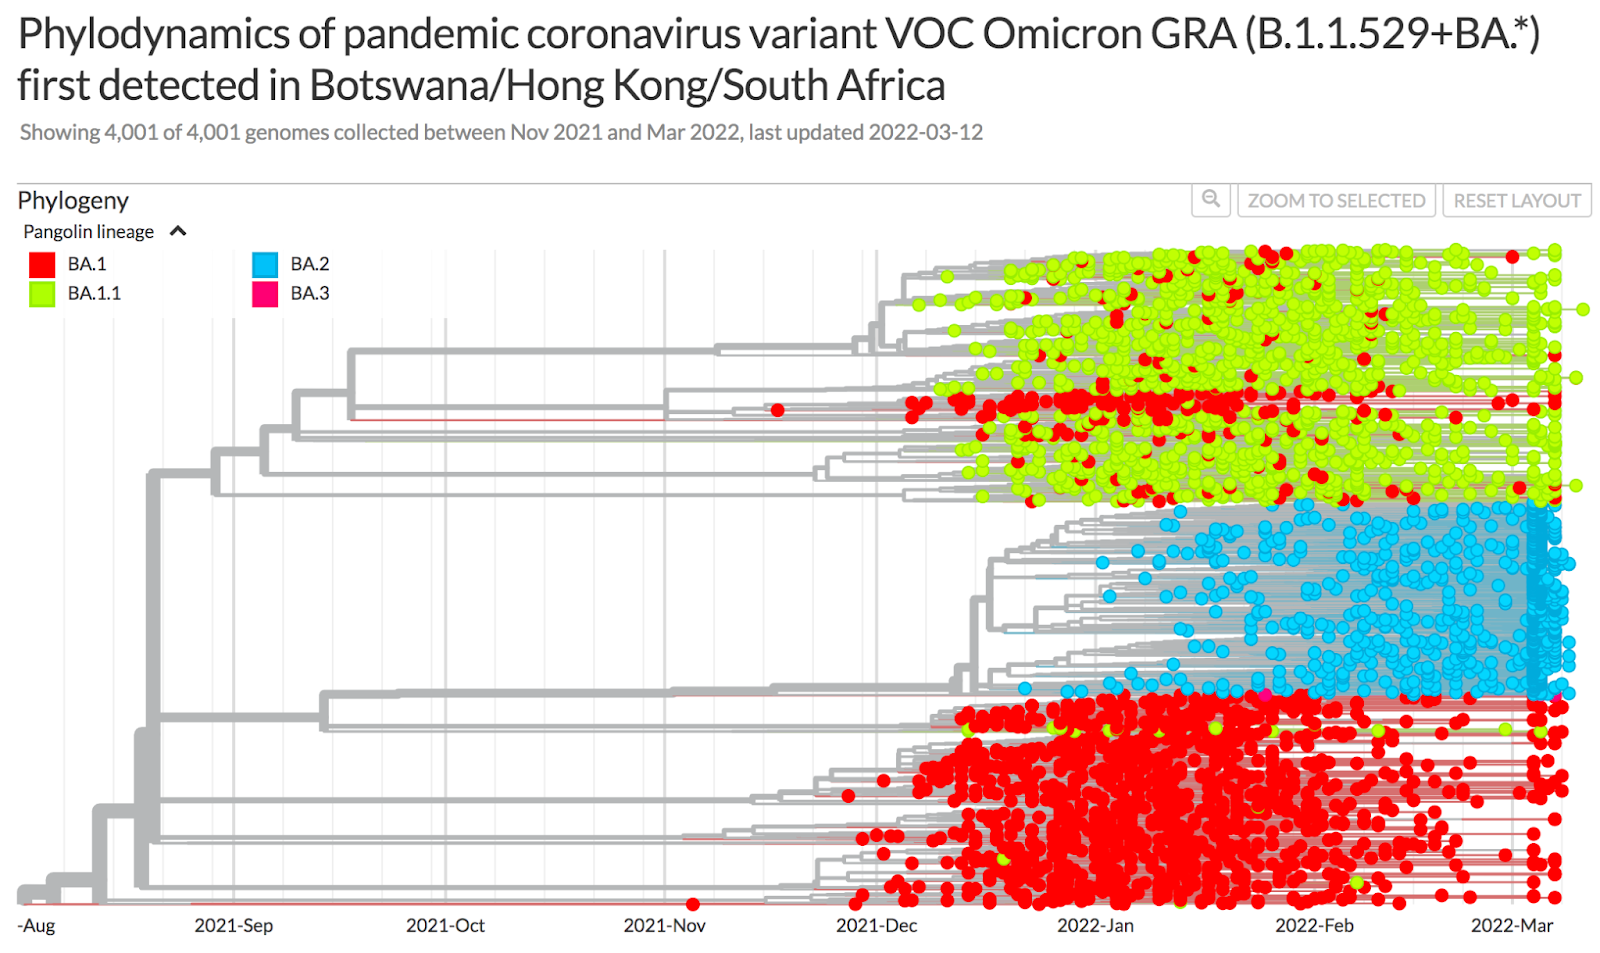
SARS-CoV-2 infections have been decelerating at a rapid rate in the United States and many other countries but are increasing rapidly in a handful of countries in Europe and Asia. The outbreak is still caused by variants of concern Omicron BA.1.1, BA.1, BA.2 and to a lesser degree BA.3 (particularly in Poland). Omicron variants are at least four times as infectious as the already highly infectious Delta variants. UK scientists have found that the household secondary attack rate for Omicron is 21.6%, compared to 10.7% with Delta, meaning people infected with Omicron are twice as likely to infect household members as they would be if infected with Delta. They also estimate a “three- to eight-fold increased risk of reinfection with the Omicron variant.”
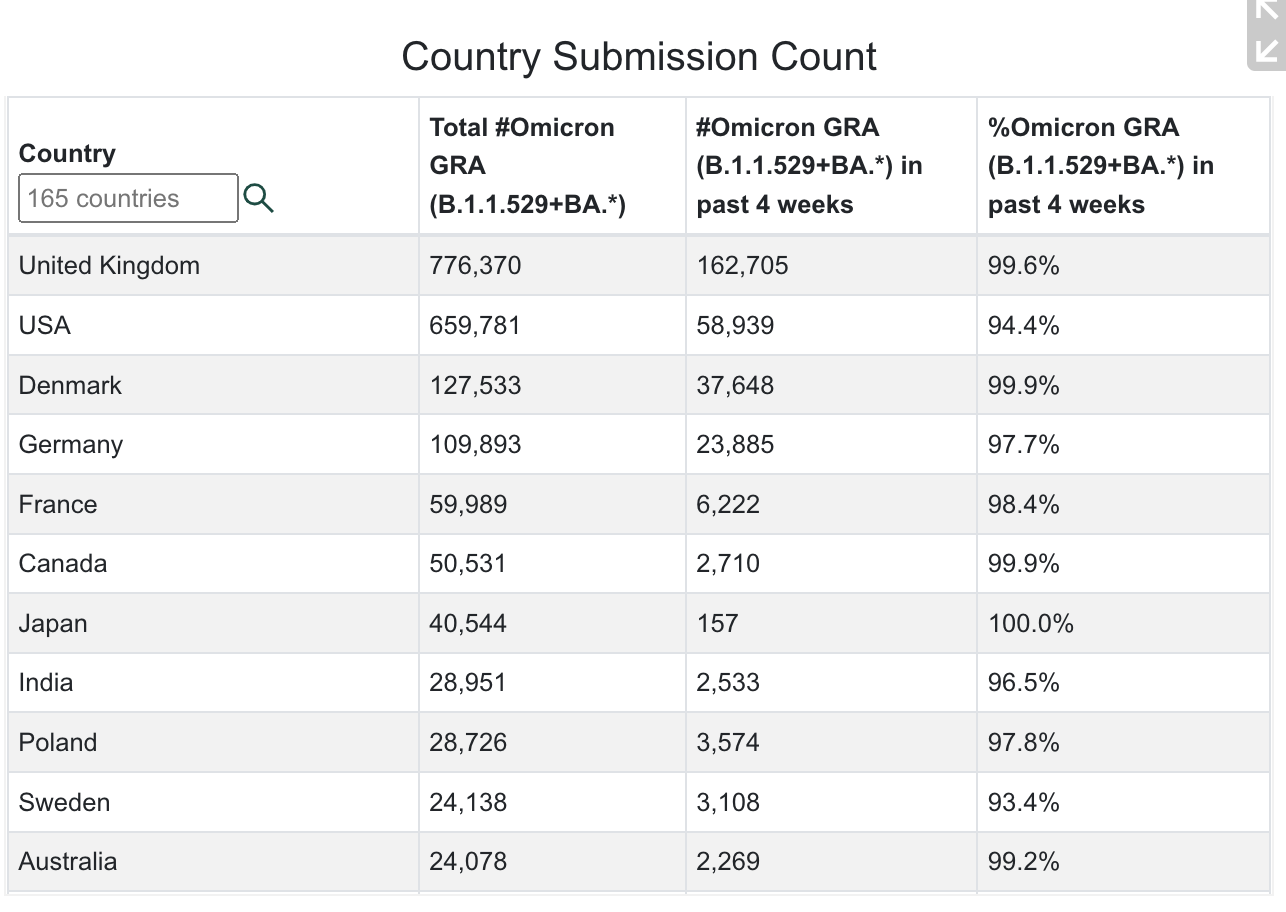
I would expect the Omicron variant to continue to mutate just like Delta. There are now already four Omicron variants, BA.1, BA.1.1, BA.2 and BA.3. A recombinant isolate of Delta AY.4.2.2 and Omicron BA.1.1 has recently been reported in the UK. We expect to see additional Omicron variants as these isolates spread rapidly around the USA and the World. As of 3/11/21 the Omicron variant, which was first seen in South Africa on 11/08/21, is now in all 50 states, Puerto Rico and the District of Columbia. As of 3/11/22 Omicron has been identified on all seven continents and in at least 165 countries.
Omicron has mutations which decrease the effectiveness of current vaccines and monoclonal antibodies. The effectiveness of the new Pfizer drug, PAXLOVIDTM, should not be compromised by any of the current mutations in Omicron or Delta variants. Pfizer completed their filing with the FDA on 11/15/21. The FDA approved PAXLOVIDTM on December 22 , 2021.The FDA approved Merck’s drug Molnupiravir on December 23, 2021. On 12/23/21 CVS announced by fax it was selected by the Government to distribute oral PAXLOVIDTM and Molnupiravir. On 12/27/21 another fax from CVS listed which CVS pharmacies in California would have these drugs. Monterey County covers 3,771 square miles with a population of 434,061. Three CVS pharmacies in Monterey, Salinas, and Soledad are the only listed pharmacies in our county. I have now been able to obtain PAXLOVIDTM from the CVS in Salinas and on Fremont Boulevard in north Monterey. Fresno County covers 6,011 square miles with a population of 999,101. Four CVS pharmacies in Fresno County are the only listed pharmacies. We obtained PAXLOVIDTM from the Salinas CVS pharmacy and the north Monterey pharmacy and successfully treated four patients in the last four weeks. We have also treated a fifth patient from Turlock with PAXLOVIDTM . We have also treated two patients with Molnupiravir due to our inability at that time to obtain PAXLOVIDTM . Molnupiravir does not appear to be in short supply in the United States. You can just send your electronic prescription to a participating CVS pharmacy. You probably should call in advance to check on drug availability and their participation.
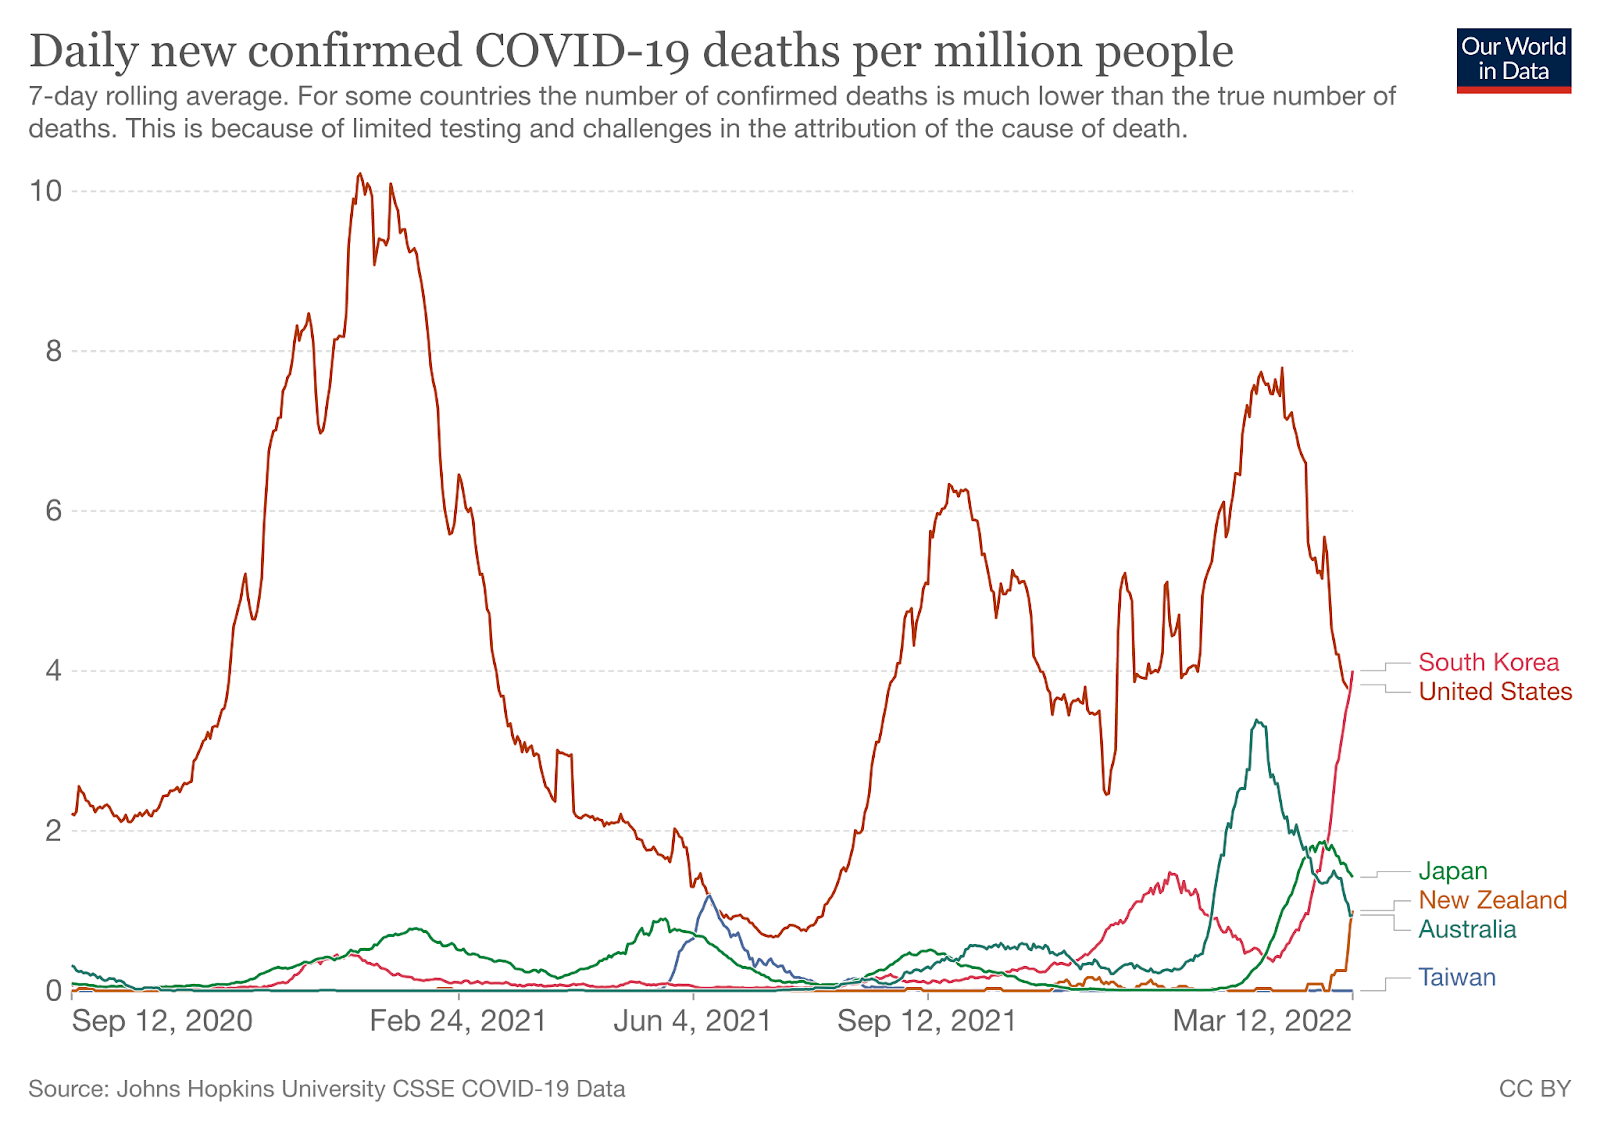
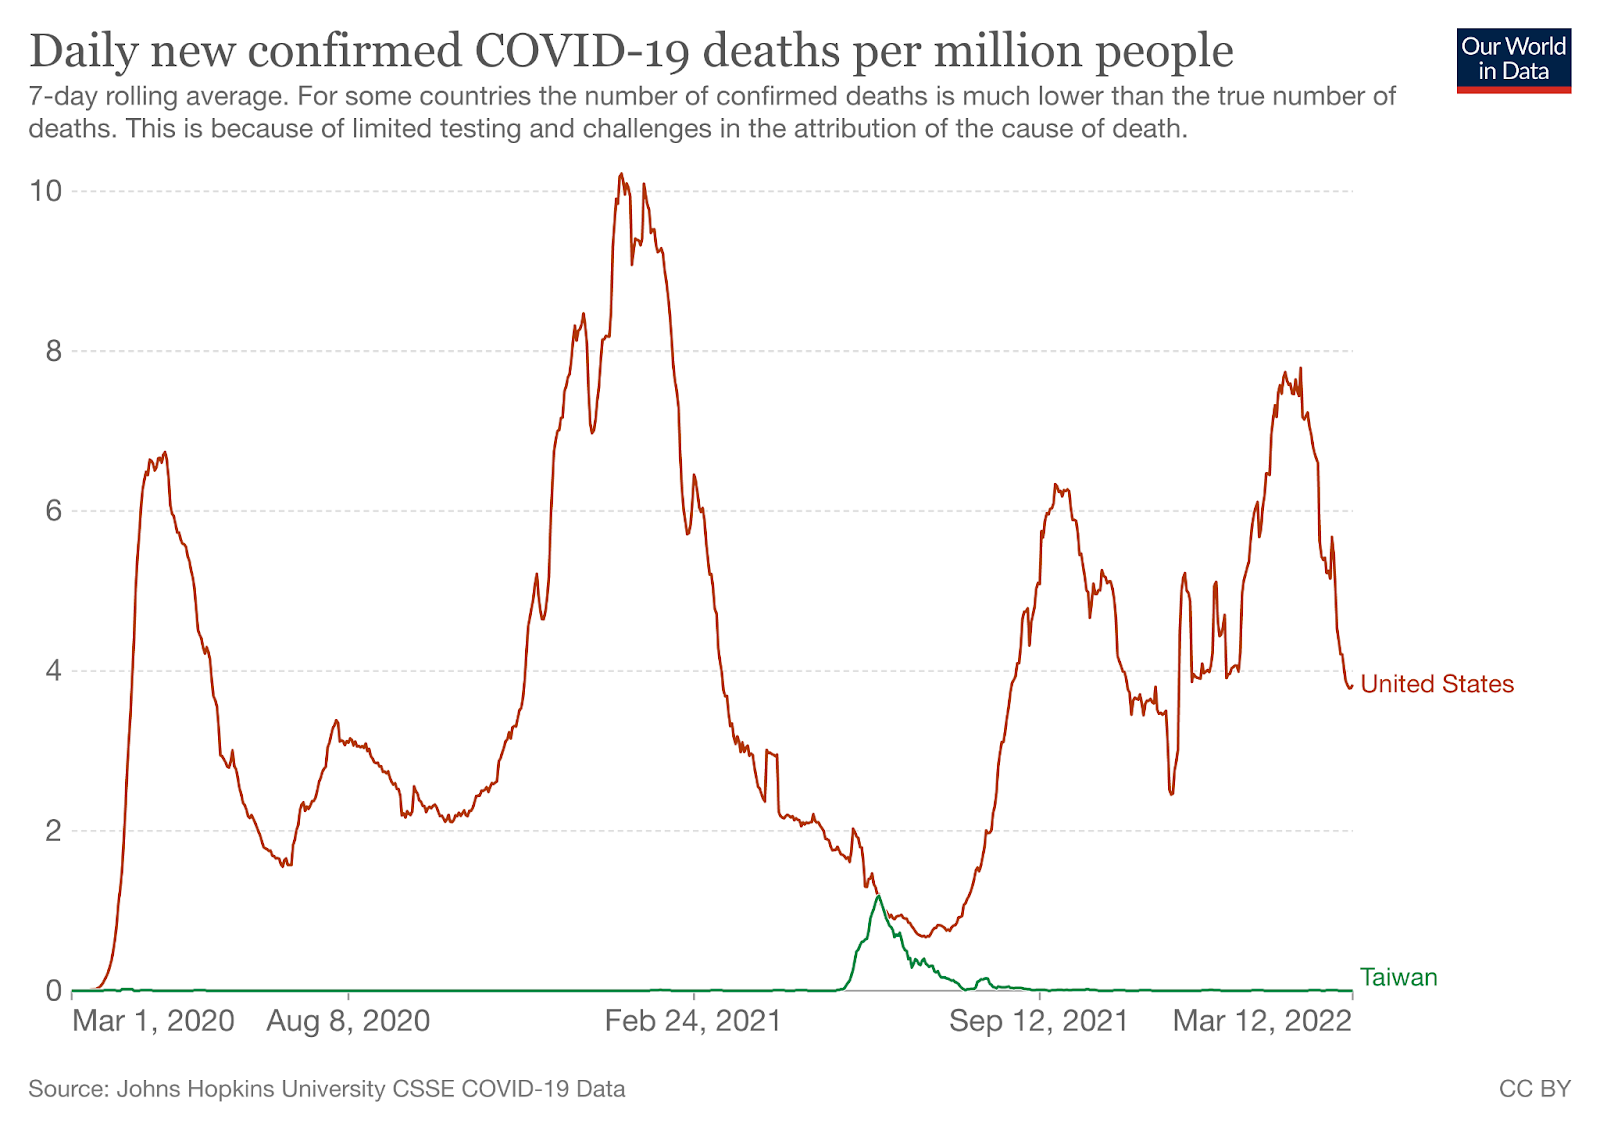
In the absence of obtaining intravenous Sotrovimab or Bebtelovimab, only oral PAXLOVIDTM and Molnupiravir are available to treat SARS-CoV-2 as an outpatient. Vaccination will not prevent you from getting an Omicron variant infection. For now only masking (N95 rated masks, please!) and social distancing will have any effect on these variants. Furthermore, we do not believe that a 5-day quarantine or isolation period is sufficient for any COVID-19 infection. The Taiwanese CDC agrees with both our recommendations on quarantine period and masking. In fact, the Taiwanese CDC has recommended N95 masking since the beginning of the pandemic (and made these masks universally available to their population). Taiwan has one of the lowest death rates per million during the course of the pandemic (see graph below).
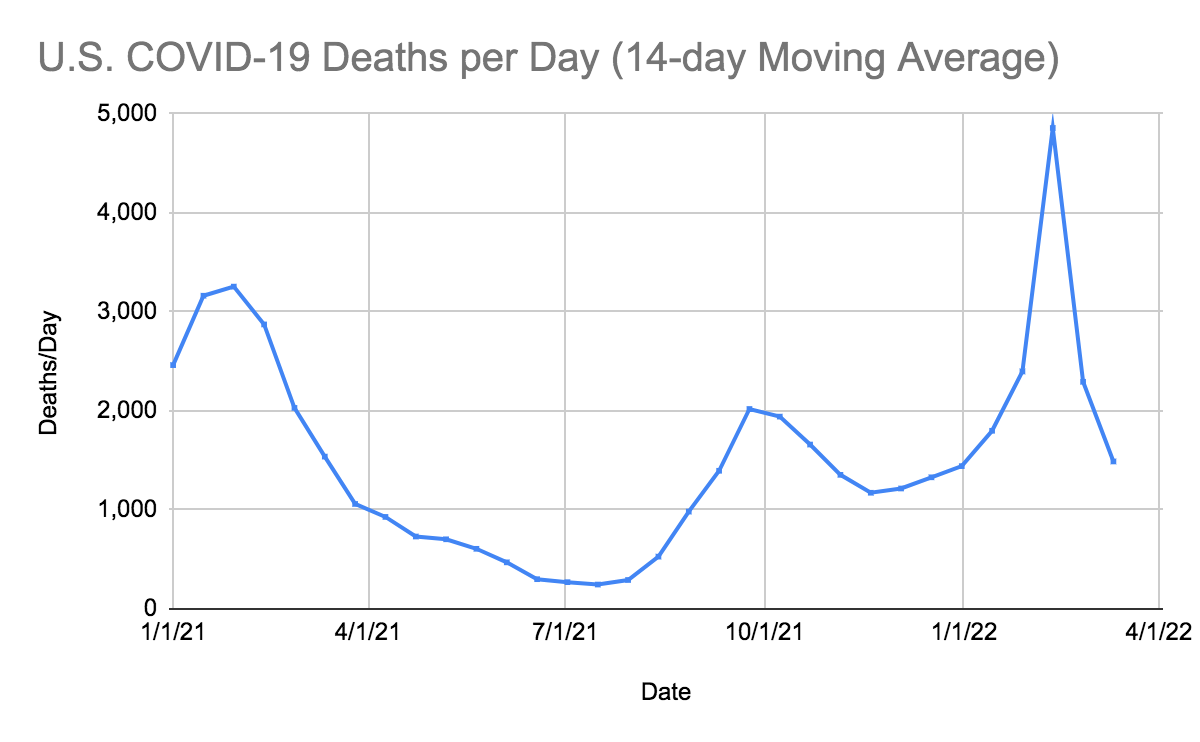
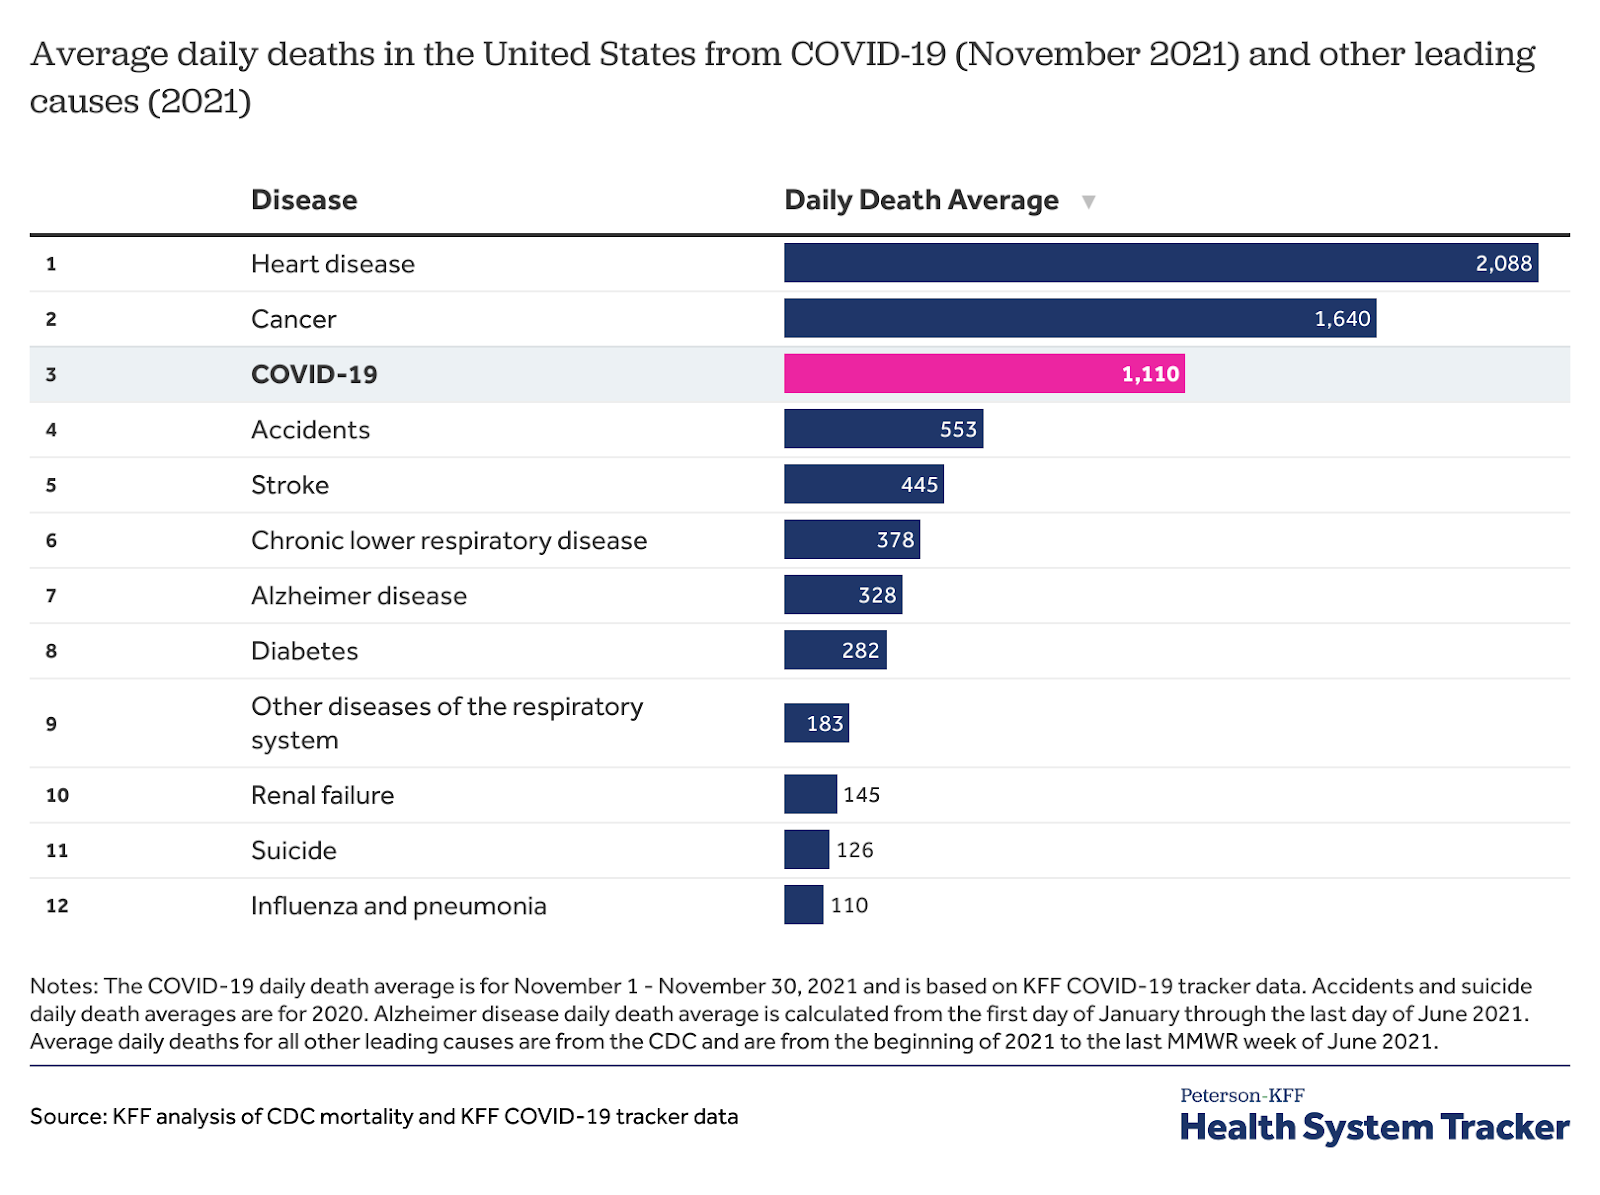
In the United States as of 2/25/22, SARS-CoV-2 deaths have decreased for the first time in twelve 14-day periods. There were 2,568 fewer deaths per day than in the last 14-day period. In November 2021, SARS-CoV-2 was the third most common cause of death in the United States.
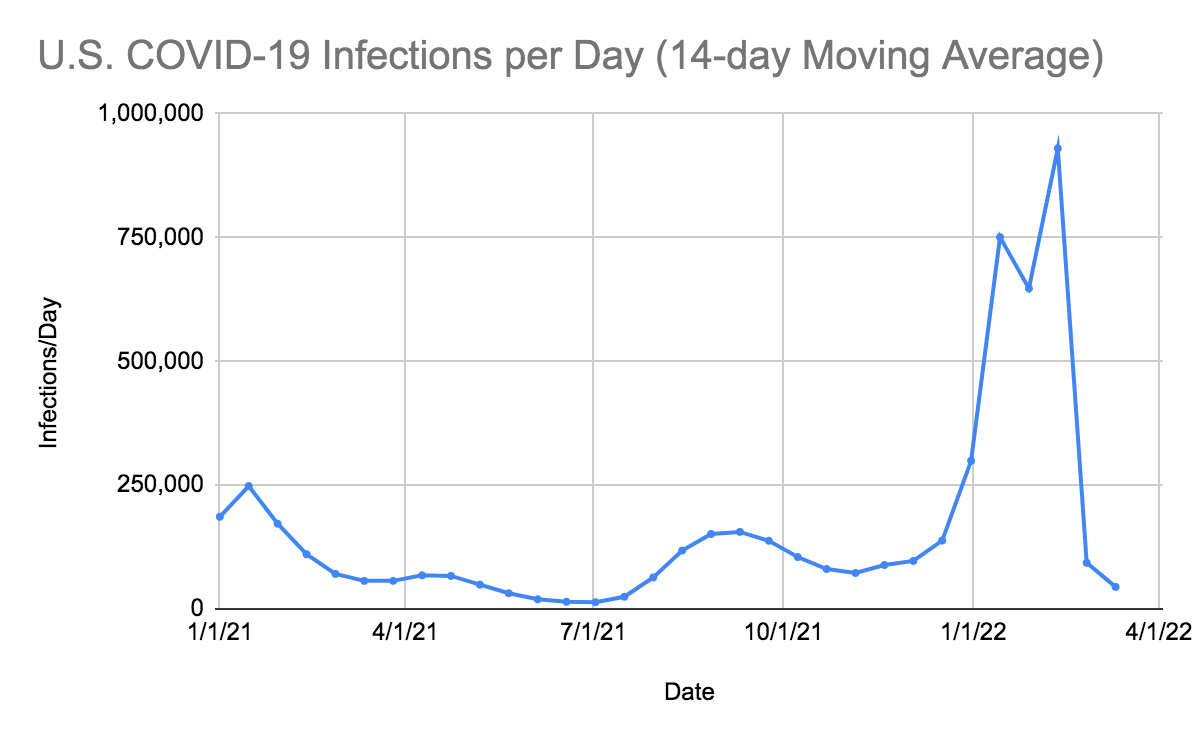
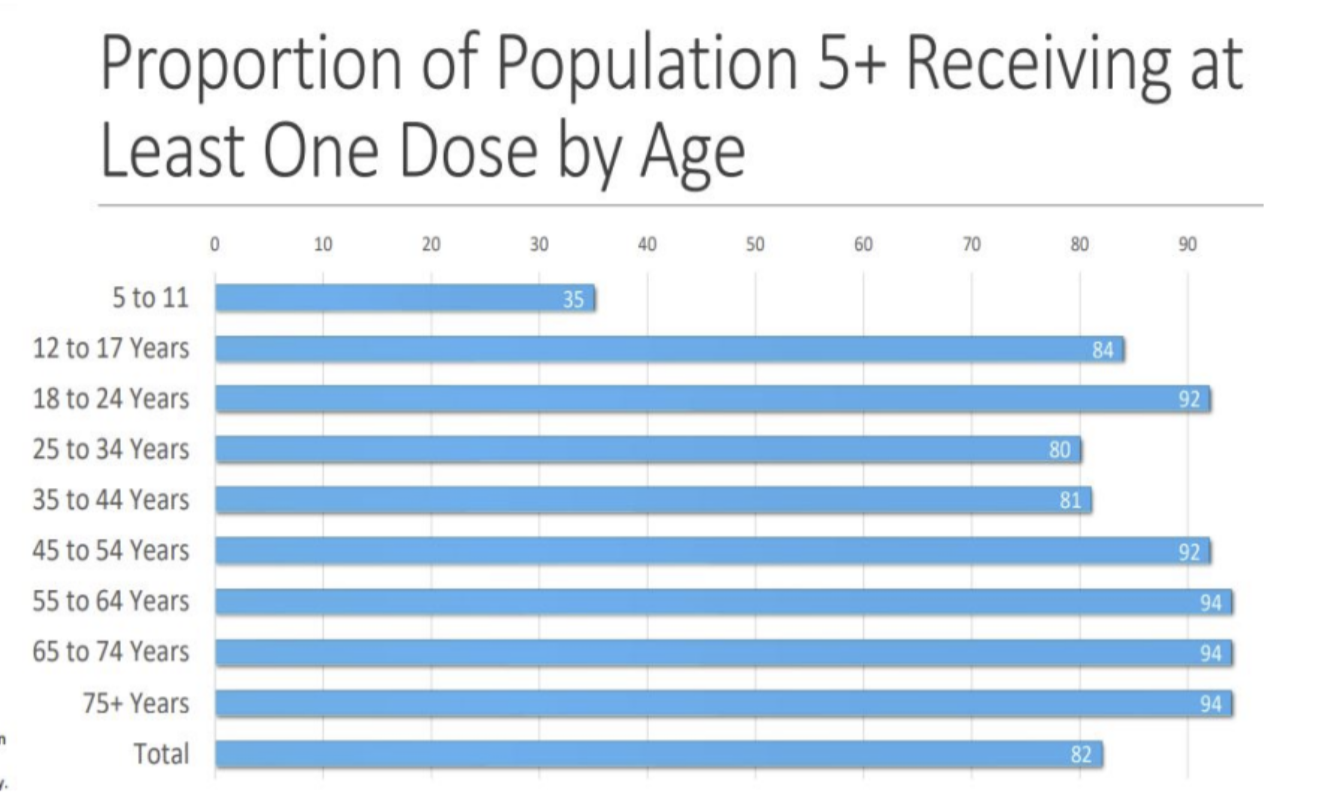
In the last 14 days, the number of infections has decreased by 44,468 infections per day compared to the preceding 14-day period. Our infections per day have decreased for the second time over the last 8 weeks. Unless people get vaccinated, including their third dose of the vaccine, we will see further spread of the Omicron variants and increase in deaths in people who are not vaccinated, have waning immunity, the immunocompromised population and others with risk factors particularly those older than over the age of 64. SARS-CoV-2 is now in the top ten most common causes of death for children. Anyone over the age of 5 years can now get vaccinated in the United States at no cost. This should get done immediately.In Monterey County, only 35% of 5-11 year olds have received the first dose of vaccine.
The new variant, B.1.1.529 (Omicron), was first seen in South Africa on 11/8/21 with multiple new mutations, deletions and an insertion that caused a doubling of new infections every 1.3 days in Gauteng, South Africa. In just 67 days, as of 1/14/22, Omicron has been found on seven continents, in 165 countries and all 50 states in the United States. Unlike Delta variants in South Africa, Omicron was infecting and hospitalizing patients in all age groups but particularly children under five years of age and adults greater than 60 years of age. Increased vaccinations, vaccines against new mutants, drugs against 3C-like protease like PAXLOVIDTM, increased mask usage and social distancing, which are part of the Biden SARS-CoV-2 plan, are all necessary to continue to stop further spread of mutants and reduce infections, hospitalizations, and deaths.
Omicron Subvariant BA.2 Is Coming
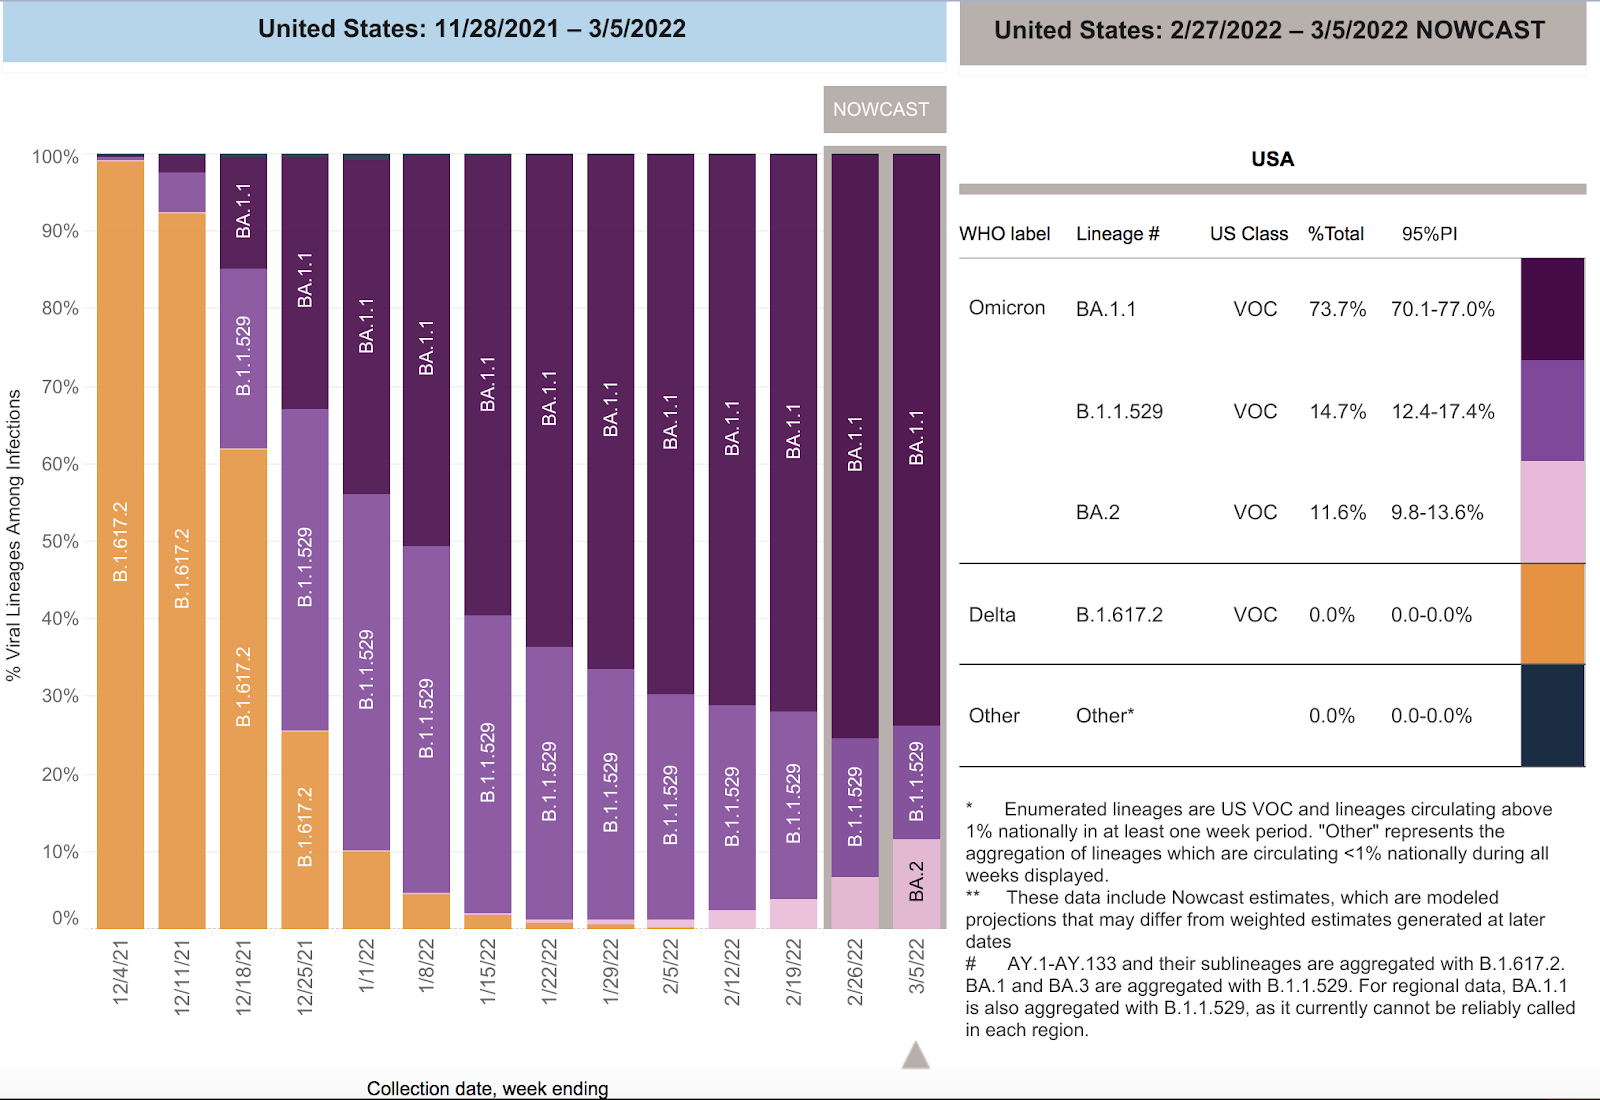
Per CDC data ending in 3/5/22, the Delta variant accounts for 0.0% of new infections in the United States, while Omicron BA1.1 accounts for 73.7%, Omicron B.1.1.529 accounts for 14.7%, and Omicron subvariant BA.2 accounts for 11.6%. It’s worth noting that in the last 30 days, according to GISAID, the United States has only sequenced 3.042% of cases.
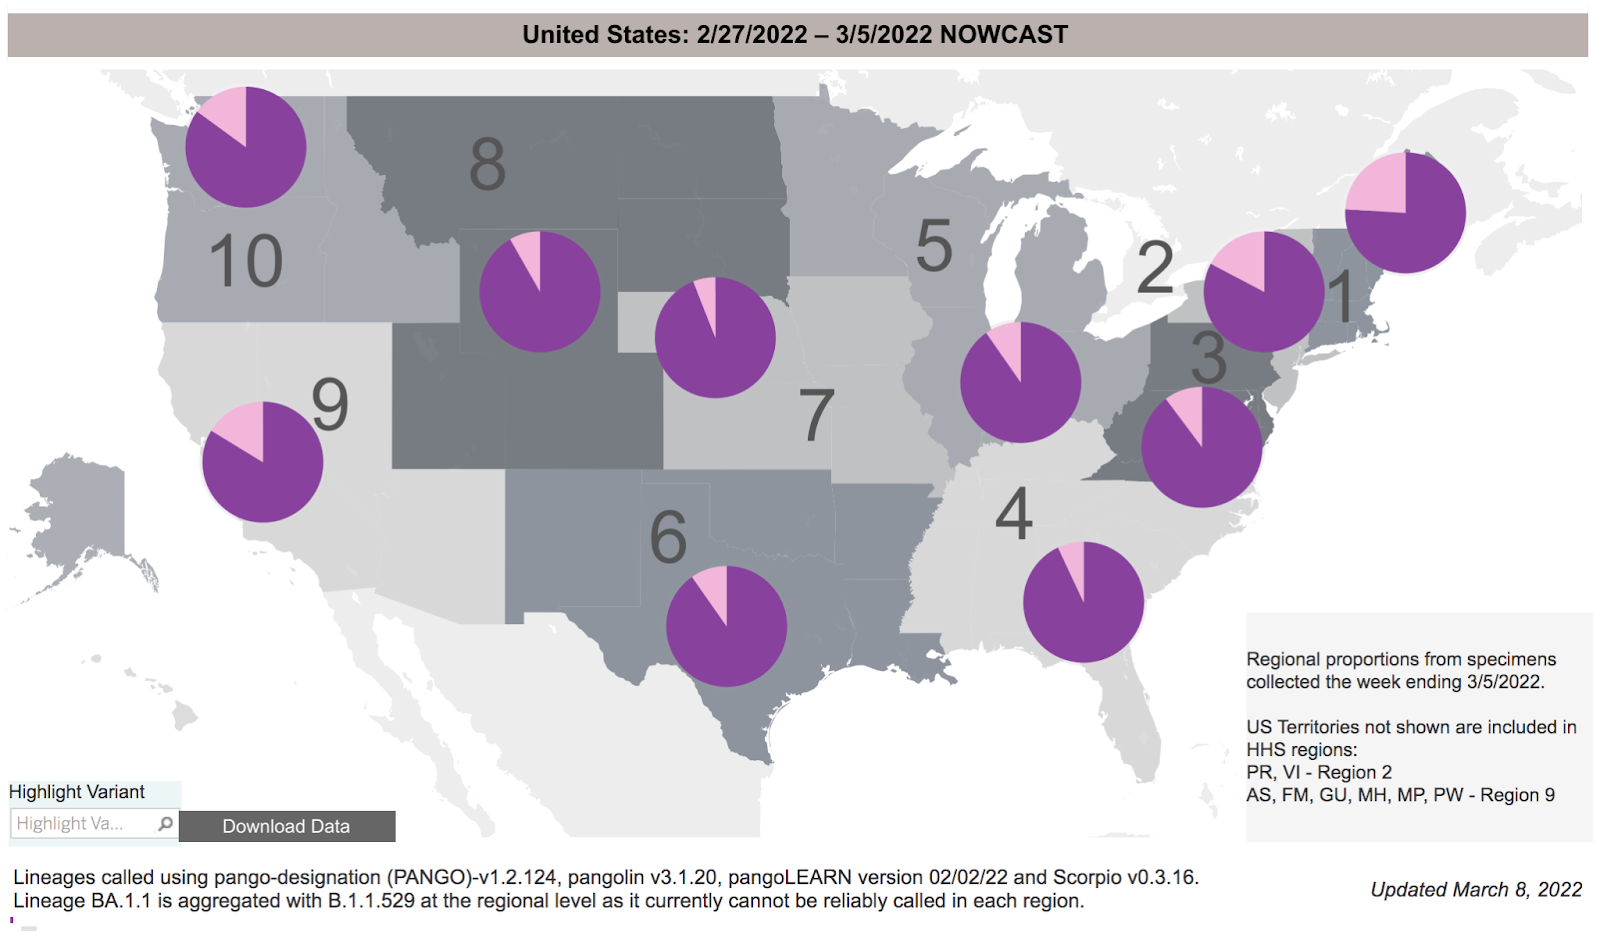
Omicron subvariant BA.2 has been detected in every region of the United States, and the proportion of BA.2 continues to increase. BA.2 also contains 17 mutations that set it apart from BA.1 (ten of which are also different from those in BA. 3.
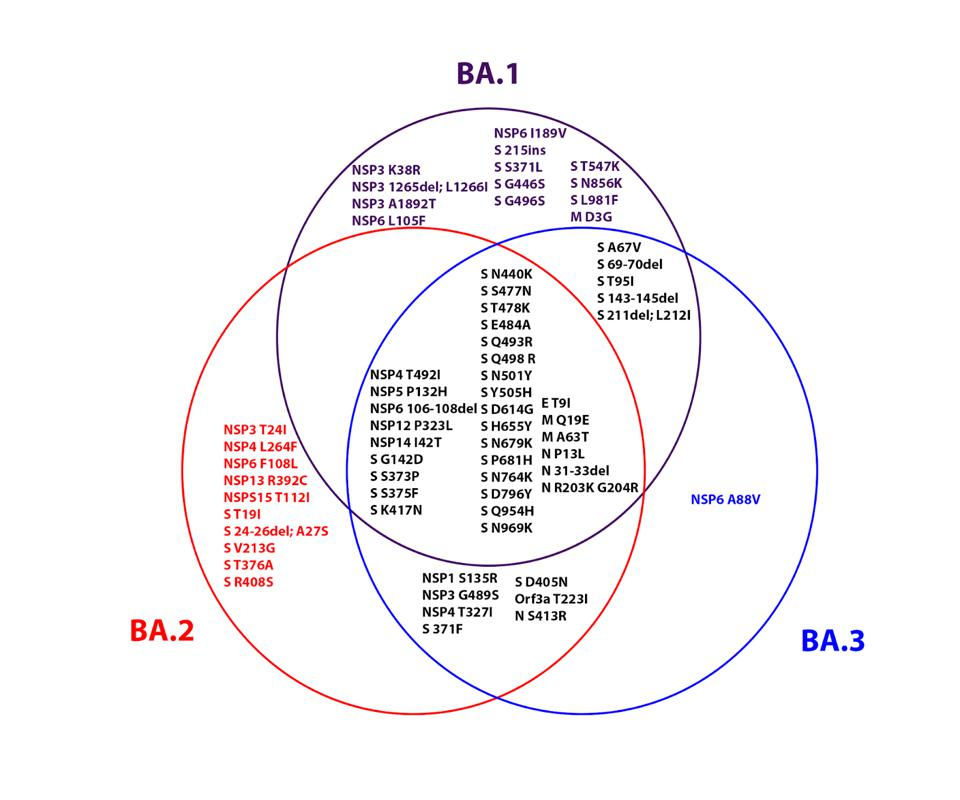
FIGURE 3: Venn diagram showing the similarities and differences between the three Omicron family viruses. ACCESS HEALTH INTERNATIONAL
Nextstrain
On 3/11/22, the United States had 39,254 new infections. There were also 1,022 deaths. Florida continues to consistently under-report daily infections and deaths. In the United States the number of hospitalized patients has been decreasing in many areas, and now 4,604 patients are seriously or critically ill; that number was 8,981 two weeks ago. The number of critically ill patients has decreased by 4,357 in the last 14 days, while at least 20,844 new deaths occurred (a decrease of 11,267 deaths from the previous 14 days). The number of critically ill patients has decreased for the fourth time in sixteen 14-day periods but a large number of patients are still dying each day (average 1,489/day). Infections, critically ill patients, and deaths should markedly decrease in the next two weeks if Omicron BA.2 causes less severe disease and does not infect large numbers of previously BA.1 infected patients. However, there are reports out of Israel of patients infected with BA.1 being later reinfected with BA.2.
As of 3/11/22, we have had 993,044 deaths and 81,154,960 SARS-CoV-2 infections in the United States. We have had 622,653 new infections in the last 14 days. We were adding an average of 311,277 infections every seven days. For the pandemic in the United States we are averaging one death for every 81.7 infections reported or over 12,236 deaths for each one million infections. As of 3/11/22, thirty-six states have had greater than 500,000 total infections, and 36 states have had greater than 5,000 total deaths. Fifteen states (North Carolina, Indiana, Tennessee, Massachusetts, Ohio, Michigan, Georgia, Illinois, New Jersey, Pennsylvania, Florida, Texas, New York, Arizona and California) have had greater than 20,000 deaths. Four states (Florida, Texas, New York, and California) have had greater than 68,000 deaths. California and Texas have each had greater than 85,000 deaths.
On 11/20/20 in the United States, 3.70% of the population had a documented SARS-CoV-2 infection. California was ranked 41st in infection percentage at 2.77%. On 11/20/21 in North Dakota, 9.18% of the population was infected (ranked #1), and in South Dakota, 8.03% of the population was infected (ranked #2). As of 3/11/22, in the United States, 24.09% of the population has had a documented SARS-CoV-2 infection. In the last 16 months, 21.55% of our country became infected with SARS-CoV-2. In the last 2 weeks 0.18% of the country became infected. On 11/20/20, there were 260,331 (cumulative) deaths in the US from SARS-CoV-2. In the last 16 months, there were 732,913 new deaths from SARS-CoV-2. For twelve of those months, vaccines have been available to all adults. During these twelve months, 421,947 people have died of SARS-CoV-2 infections. Most of the hospitalizations and deaths could have been prevented by vaccination, proper masking, and social distancing.
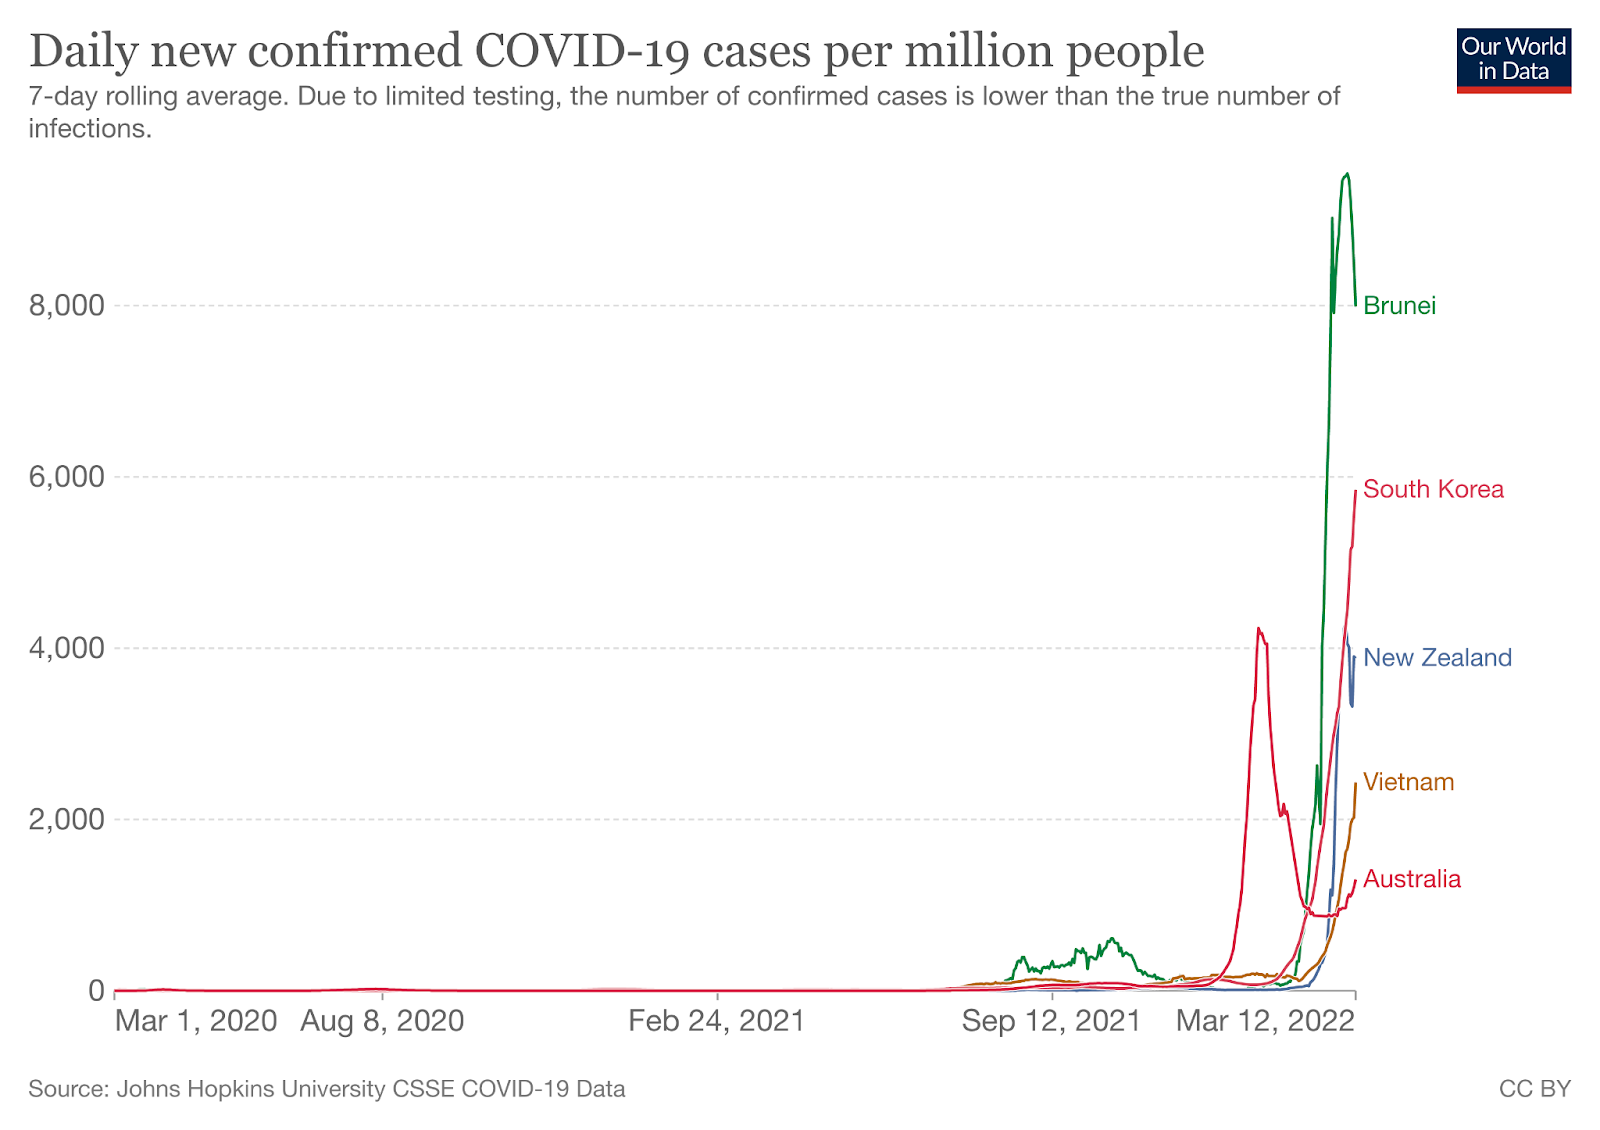
As of 3/11/22, California was ranked 37th in infection percentage at 22.86%. In California 19.16% of Californians were infected in the last 16 months. As of 3/11/22 forty-three states have had greater than 20% of their population infected. Rhode Island was at 33.77% (ranked #1), Alaska was at 32.19% (ranked #2),North Dakota was at 31.38% (ranked #3), Tennessee was at 29.51% (ranked #4), Kentucky was at 29.02% (ranked #5), Utah was at 28.86% (ranked #6) and Florida was at 27.32% (ranked #10) of their population infected. All 50 states and the District of Columbia now have greater than 16% of their population infected. The table below shows that if we rank the US states with the highest death rates per million population within the world rankings, we see that Mississippi had the sixth highest death rate, Arizona, Alabama and New Jersey have the eighth highest COVID-19 deaths per million in the world. Louisiana, Arkansas and New York tied at tenth, Massachusetts is at 11th, Florida is at 12th and Rhode Island is at fourteenth. The United States as a whole ranks 18th in the world for deaths per million population (2,971 deaths per million). California ranks 38th in the USA (and 37th in the world). If we look at the death rates per million in South Korea (192), Iceland (229), Japan (204), and Israel (1,111), they suggest that treatment outcomes are somehow different in these four countries. The same phenomenon can be seen in Scandinavia, where the death rate in Sweden is 1,741 per million, compared to 319 per million in Norway and 478 per million in Finland. The United States should have taken a closer look at how countries with low death rates (like South Korea, Iceland, Japan, Finland, and Norway) are preventing COVID-19 infections and treating COVID-19 patients.
| State or Country | COVID-19 Deaths per million population | Rank in USA | Ranked within World |
| Mississippi | 4,118 | 1st | 6th |
| New Jersey | 3,725 | 4th | 8th tied |
| Louisiana | 3,633 | 7th | 10th tied |
| New York | 3,504 | 10th | 10th tied |
| Alabama | 3,841 | 3rd | 8th tied |
| Arizona | 3,859 | 2nd | 8th tied |
| Massachusetts | 3,446 | 11th | 11th |
| Rhode Island | 3,229 | 19th | 14th |
| Arkansas | 3,600 | 8th | 10th tied |
| Florida | 3,345 | 18th | 12th tied |
| California | 2,215 | 38th | 37th |
| USA | 2,971 | 18th | |
| Peru | 6,265 | 1st | |
| Bosnia-Herzegovina | 4,810 | 3rd | |
| North Macedonia | 4,739 | 5th | |
| Hungary | 4,642 | 4th | |
| Montenegro | 4,285 | 6th | |
| Bulgaria | 5,258 | 2nd | |
| Gibraltar | 2,999 | 17th | |
| Czechia | 3,642 | 9th | |
| Brazil | 3,043 | 15th | |
| San Marino | 3,289 | 12th | |
| Georgia | 4,151 | 7th | |
| Sweden | 1,741 | 57th | |
| Israel | 1,111 | 84th | |
| Canada | 962 | 90th | |
| Finland | 478 | 125th | |
| Norway | 319 | 141st | |
| Japan | 204 | 151st | |
| Iceland | 229 | 147th | |
| South Korea | 192 | 154th |
FDA-Approved Oral Drug Treatments for SARS-CoV-2
Pfizer has developed PAXLOVID™, an oral reversible inhibitor of C3-like protease of SARS-CoV-2. The drug inhibits this key enzyme that is crucial for virus production. The compound, also called Compound 6 (PF-07321332), is part of the drug combination PAXLOVID™ (PF-07321332; ritonavir), which just successfully completed a Phase 2-3 trial in humans in multiple countries. The preliminary results were announced on 11/5/21 by Pfizer. The results show that 89% of the hospitalizations and deaths were prevented in the drug treatment arm. The drug was administered twice a day for five days. No deaths occurred in the treatment group, and ten deaths occurred in the placebo group. The study was stopped by an independent data safety monitoring board, and the FDA concurred with this decision. Pfizer applied for an Emergency Use Authorization for this drug on 11/15/21. This drug was approved on 12/23/21. We have only been able to obtain PAXLOVID™ for two patients who we successfully treated with this drug obtained from CVS in Salinas (East Alisal Street; phone number 831-424-0026). They were expecting another shipment on 1/28/22. In my opinion, this agent, if more widely available, could markedly alter the course of every coronavirus infection throughout the world.
Merck has developed the oral drug Molnupiravir, which induces RNA mutagenesis by viral RNA-dependent RNA polymerase of SARS-CoV-2 and other viruses. According to Kabinger et al, “Viral RNA-dependent RNA polymerase uses the active form of Molnupiravir, β-D-N4-hydroxycytidine triphosphate, as a substrate instead of cytidine triphosphate or uridine triphosphate. When the RNA-dependent RNA polymerase uses the resulting RNA as a template, β-D-N4-hydroxycytidine triphosphate directs incorporation of either guanine or adenine, leading to mutated (viral) RNA products. Analysis of RNA-dependent RNA polymerase–RNA complexes that contain mutagenesis products has demonstrated that β-D-N4-hydroxycytidine (the active form of Molnupiravir) can form stable base pairs with either guanine or adenine in RNA-dependent RNA polymerase explaining how the polymerase escapes proofreading and synthesizes mutated RNA” (quotation modified for clarity). The results of the phase 3 trial of Molnupiravir were published in the NEJM article “Molnupiravir for Oral Treatment of Covid-19 in Nonhospitalized Patients” by Angélica Jayk Bernal, M.D. et al. (December 16, 2021 DOI: 10.1056/NEJMoa2116044). In this phase 3 study in the Molnupiravir group, 28 patients were hospitalized and one death occurred. In the placebo group, 53 patients were hospitalized and 9 died. Overall, 47% of hospitalizations and deaths were prevented by Molnupiravir. If you do a post hoc analysis and just look at deaths, Molnupiravir would prevent 89% of deaths. An Emergency Use Authorization by the FDA for Molnupiravir was approved on 12/24/21.The dose of Molnupiravir approved is four 200 mg capsules orally twice a day for five days. Diarrhea is reportedly a side effect in two percent of patients. I treated my first patient with Molnupiravir on 1/28/22. Currently more Molnupiravir is available weekly in the United States than PAXLOVID™ (see chart below; data from PHE.gov). Locally Molnupiravir is still available at CVS in Monterey (Fremont Blvd.; phone number: 831-375-5135) and CVS in Salinas (East Alisal Street; phone number 831-424-0026).
Total Doses of All Four COVID-19 Drugs Provided to the United States, by Week
| Date | Paxlovid | Molnupiravir | Sotrovimab | Bebtelovimab | Evusheld |
| 1/24/22-1/30/22 | 99,980 | 399,980 | 52,260 | — | 74,976 |
| 1/31/22-2/6/22 | 0 | 0 | 52,104 | — | 74,960 |
| 2/7/22-2/13/22 | 99,940 | 399,840 | 52,248 | 48,745 | 49,264 |
| 2/14/22-2/20/22 | 0 | 0 | 52,249 | 48,795 | 49,992 |
| 2/21/22-2/27/22 | 148,980 | 349,776 | 52,194 | 49,000 | 49,922 |
| 2/28/22-3/6/22 | 0 | 0 | 46,986 | 51,990 | 49,992 |
| 3/7/22-3/13/22 | 175,000 | 174,960 | 52,242 | 49,000 | 199,992 |


FDA-Approved Intravenous Monoclonal Antibody Treatment for Non-Hospitalized SARS-CoV-2 Patients
Sotrovimab is a human monoclonal antibody made by Vir Technology and Glaxo-SmithKline which received a FDA EUA approval on May 26,1921 for intravenous drug treatment for non-hospitalized SARS-CoV-2 infected patients. According to the FDA, “The data supporting this EUA for sotrovimab are based on an interim analysis from a phase 1/2/3 randomized, double-blind, placebo-controlled clinical trial in 583 non-hospitalized adults with mild-to-moderate COVID-19 symptoms and a positive SARS-CoV-2 test result. Of these patients, 291 received sotrovimab and 292 received a placebo within five days of onset of COVID-19 symptoms. The primary endpoint was progression of COVID-19 (defined as hospitalization for greater than 24 hours for acute management of any illness or death from any cause) through day 29. Hospitalization or death occurred in 21 (7%) patients who received placebo compared to 3 (1%) patients treated with sotrovimab, an 85% reduction.” Sotrovimab is given intravenously in a single 500 mg dose. Supplies of this drug are also very limited and currently are only available at hospitals. In order to get this drug, we will probably have to go through the same process outlined below for Evusheld.
Bebtelovimab is a new monoclonal antibody treatment for mild-to-moderate COVID-19 in adults and pediatric patients (12 years of age and older weighing at least 40 kg) with positive results of direct SARS-CoV-2 viral testing, and who are at high risk for progression to severe COVID-19, including hospitalization or death, and for whom alternative COVID-19 treatment options approved or authorized by FDA are not accessible or clinically appropriate. The authorized dose of bebtelovimab is 175 mg, given as an intravenous injection over at least 30 seconds. The U.S. Food and Drug Administration (FDA) has issued an Emergency Use Authorization (EUA) for this drug on 2/11/22.
FDA Approved Intramuscular Prophylaxis of SARS-CoV-2 Immunocompromised Patients
Evusheld (from AstraZeneca) contains two human monoclonal antibodies, Tixagevimab (150 mg in 1.5 mL) and Cilgavimab (150 mg in 1.5 mL), in separate vials. According to the manufacturer, “Tixagevimab and Cilgavimab are two recombinant human IgG1κ monoclonal antibodies with amino acid substitutions to extend antibody half-life (YTE), reduce antibody effector function, and minimize the potential risk of antibody-dependent enhancement of disease (TM). Tixagevimab and Cilgavimab can simultaneously bind to non-overlapping regions of the receptor binding domain (RBD) of SARS-CoV-2 spike protein. Tixagevimab, Cilgavimab, and their combination bind to spike protein with equilibrium dissociation constants of KD = 2.76 pM, 13.0 pM and 13.7 pM, respectively, blocking its interaction with human ACE2, the SARS-CoV-2 receptor, which is required for virus attachment. Tixagevimab, Cilgavimab, and their combination blocked RBD binding to human ACE2 with IC50 values of 0.32 nM (48 ng/mL), 0.53 nM (80 ng/mL), and 0.43 nM (65 ng/mL), respectively.” Each monoclonal antibody is administered intramuscularly to immunocompromised patients in two separate injections every six months. Evusheld availability in California is limited and has been rationed/distributed by our local Public Health Department only to hospitals. Physicians in Monterey County who want to receive a distribution (or redistribution) of Evusheld need to be added to the list of eligible facilities by the State Therapeutics group. The first step is for the Monterey County EMS Agency (phone: 831-755-5713) to make a request to the State Therapeutics group to have the facility added to the system for further verification. Due to extremely limited availability, evidently the State Therapeutics group is currently only considering additions on a case by case basis. Physicians who wish to submit their facility for consideration will need to provide the following information to the Monterey County EMS Agency:
- Facility/Provider Name for Registration
- Provider Type (Hospital, Pharmacy, Etc)
- Shipping Address
- Contact Name(s)
- Contact Email(s)
- Contact Phone Number(s)
As for my immunocompromised patients: We provided this information by email to the Monterey County EMS Agency on 1/26/22 and will update you when or if we become an eligible provider and receive our first doses of Evusheld.
On 2/24/22, the FDA revised its dosing guidance for Evusheld, doubling the dosage of its two components, Tixagevimab and Cilgavimab, from 150 mg each to 300 mg each. They explain, “Based on the most recent information and data available, Evusheld may be less active against certain Omicron subvariants. The dosing regimen was revised because available data indicate that a higher dose of Evusheld may be more likely to prevent infection by the COVID-19 Omicron subvariants BA.1 and BA.1.1 than the originally authorized Evusheld dose.” Patients who have already received their first administration of Evusheld intramuscularly will need to contact their healthcare provider to get a second 150 mg injection of Tixagevimab and Cilgavimab. If you have not received Evusheld yet, the correct dose is 3 mL/300 mg of each monoclonal antibody injected intramuscularly. This large volume necessitates administration of the antibodies in the gluteus, with two separate injections.
A New Possible Indication for an Older FDA-Approved Antiviral Drug
Remdesivir was the first FDA-approved Emergency Use Authorization drug for the treatment of SARS-CoV-2 infected patients. In their January 2021 paper in Nature Communications, Kokic et al explained the mechanism of Remdesivir’s action on SARS-CoV-2: “The active form of remdesivir acts as a nucleoside analog and inhibits the RNA-dependent RNA polymerase (RdRp) of coronaviruses including SARS-CoV-2. Remdesivir is incorporated by the RdRp into the growing RNA product and allows for addition of three more nucleotides before RNA synthesis stalls. Addition of the fourth nucleotide following Remdesivir incorporation into the RNA product is impaired by a barrier to further RNA translocation. This translocation barrier causes retention of the RNA 3ʹ-nucleotide in the substrate-binding site of the RdRp and interferes with entry of the next nucleoside triphosphate, thereby stalling RNA-dependent RNA polymerase. In the structure of the Remdesivir-stalled state, the 3ʹ-nucleotide of the RNA product is matched and located with the template base in the active center, and this may impair proofreading by the viral 3ʹ-exonuclease.”
A recent study by Gottlieb et al of intravenous Remdesivir to prevent disease progression, whose design was similar to the study designs used for PAXLOVID™ and Molnupiravir, was published in the New England Journal of Medicine on 1/27/22. The study resulted in an 87% lower risk of hospitalization or death than in the placebo group with a similar adverse events occurrence (42.3% and 46.3% respectively). The FDA may allow approval of outpatient intravenous Remdesivir over three days (200 mg IV on day one followed by 100 mg IV daily on days two and three) in high risk non-hospitalized SARS-CoV-2 infected patients.
With the exception of Evusheld, all of the therapies listed above can be used in Omicron-infected patients. Other previously approved monoclonal antibodies will not work for Omicron.
The Threat of SARS-CoV-2 Variants
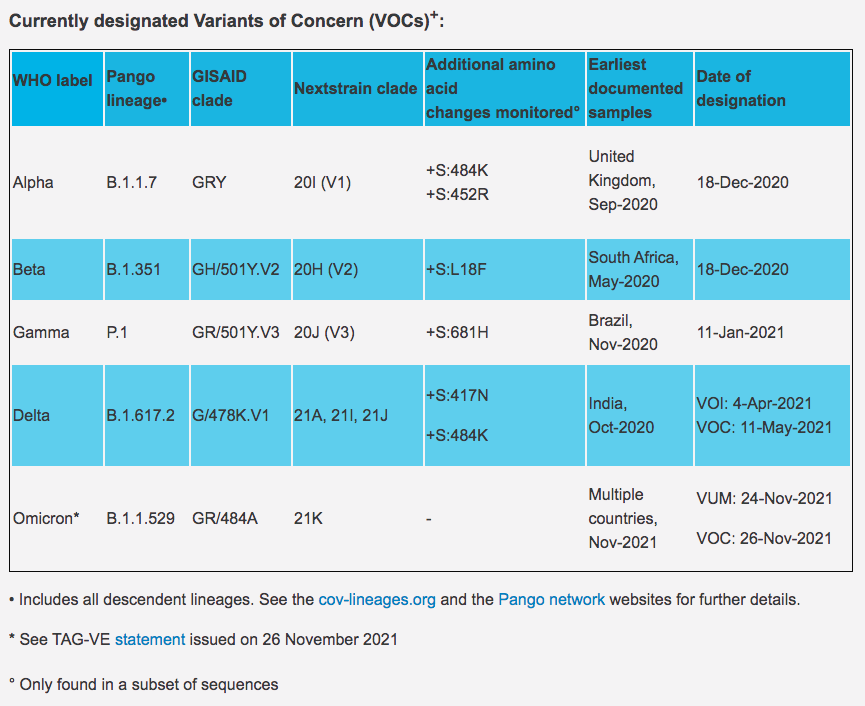
In response to the need for “easy-to-pronounce and non-stigmatising labels,” at the end of May, the World Health Organization assigned a letter from the Greek alphabet to each SARS-CoV-2 variant. GISAID, Nextstrain, and Pango will continue to use the previously established nomenclature. For our purposes, we’ll be referring to each variant by both its Greek alphabet letter and the Pango nomenclature.
The WHO has sorted variants into two categories: Variants of Concern (VOC) and Variants of Interest (VOI). The criteria for Variants of Concern are as follows:
- Increase in transmissibility or detrimental change in COVID-19 epidemiology; or
- Increase in virulence or change in clinical disease presentation; or
- Decrease in effectiveness of public health and social measures or available diagnostics, vaccines, therapeutics.
The WHO categorizes the following five variants as Variants of Concern (VOC):
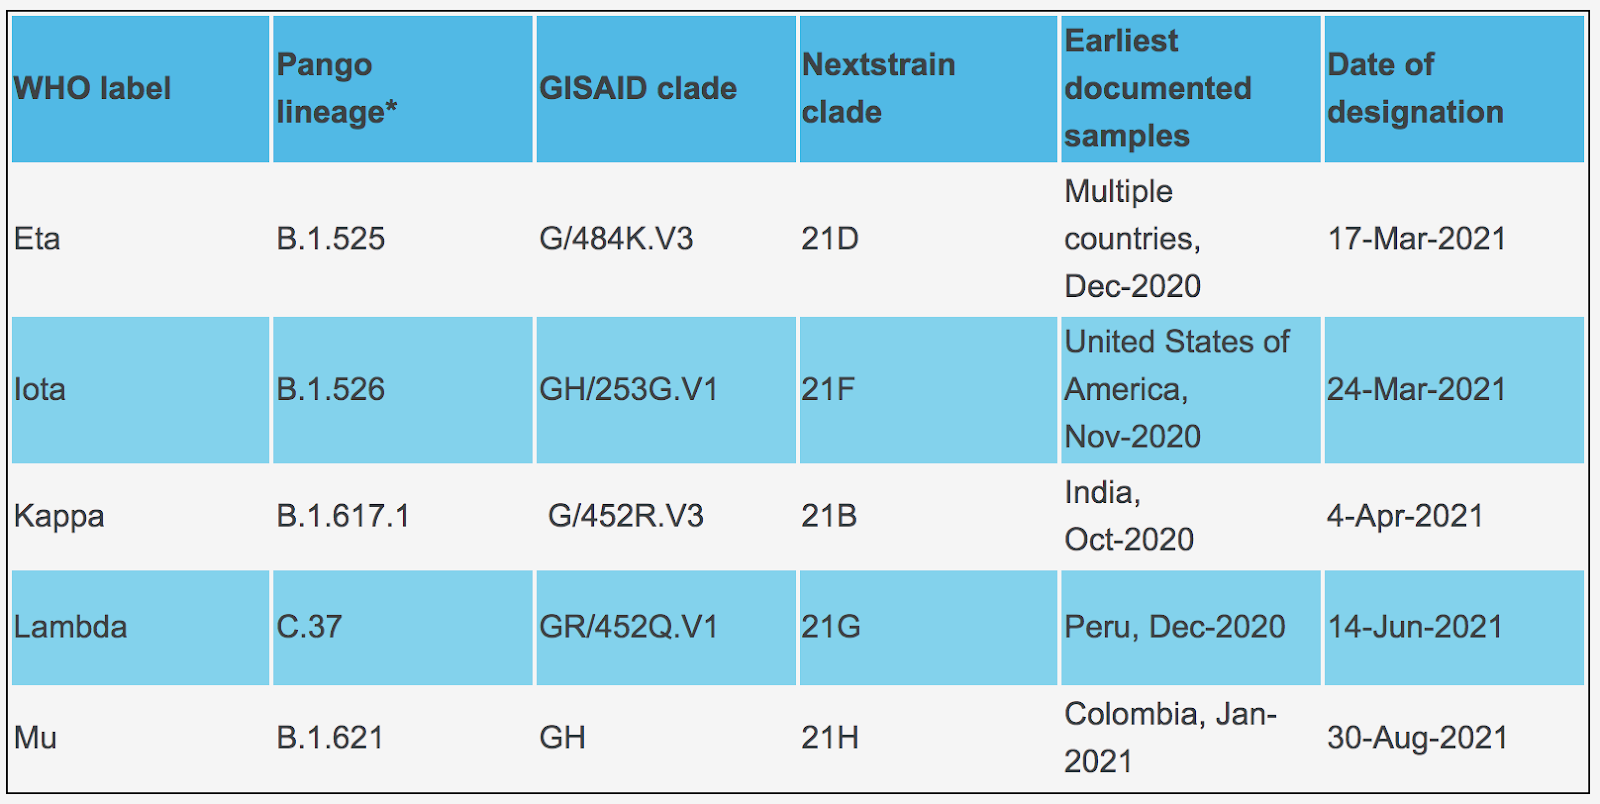
The criteria for Variants of Interest (VOI) are as follows:
- has been identified to cause community transmission/multiple COVID-19 cases/clusters, or has been detected in multiple countries; OR
- is otherwise assessed to be a VOI by WHO in consultation with the WHO SARS-CoV-2 Virus Evolution Working Group.
The WHO categorizes the following six variants as Variants of Interest (VOI):
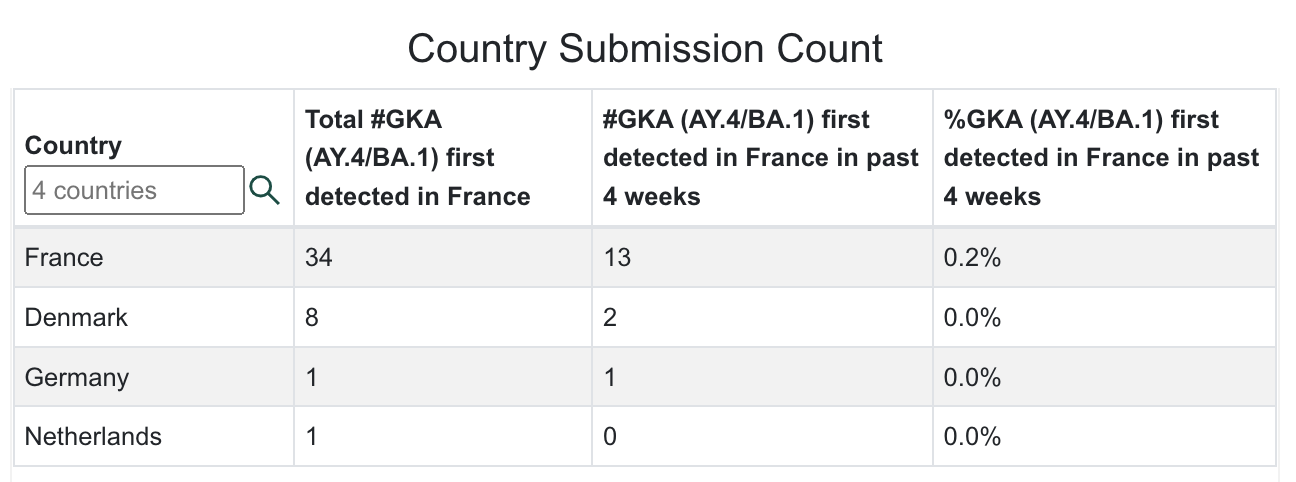
According to the UK Health Security Agency Technical Briefing from 2/25/22, “A putative Delta and Omicron recombinant has been identified in the UK, with likely parental lineages AY.4.2.2 and BA.1.1 and a breakpoint in non-structural protein 3 (nsp3). The presence of 34 genomes sampled between 7 January 2022 and 14 February 2022 suggest that this recombinant is able to transmit.” GISAID has also begun publishing data about a recombinant of Delta AY.4 and Omicron BA.1, first identified in France. According to GISAID data, this variant has also been detected in Denmark, Germany, the Netherlands, and the United States.
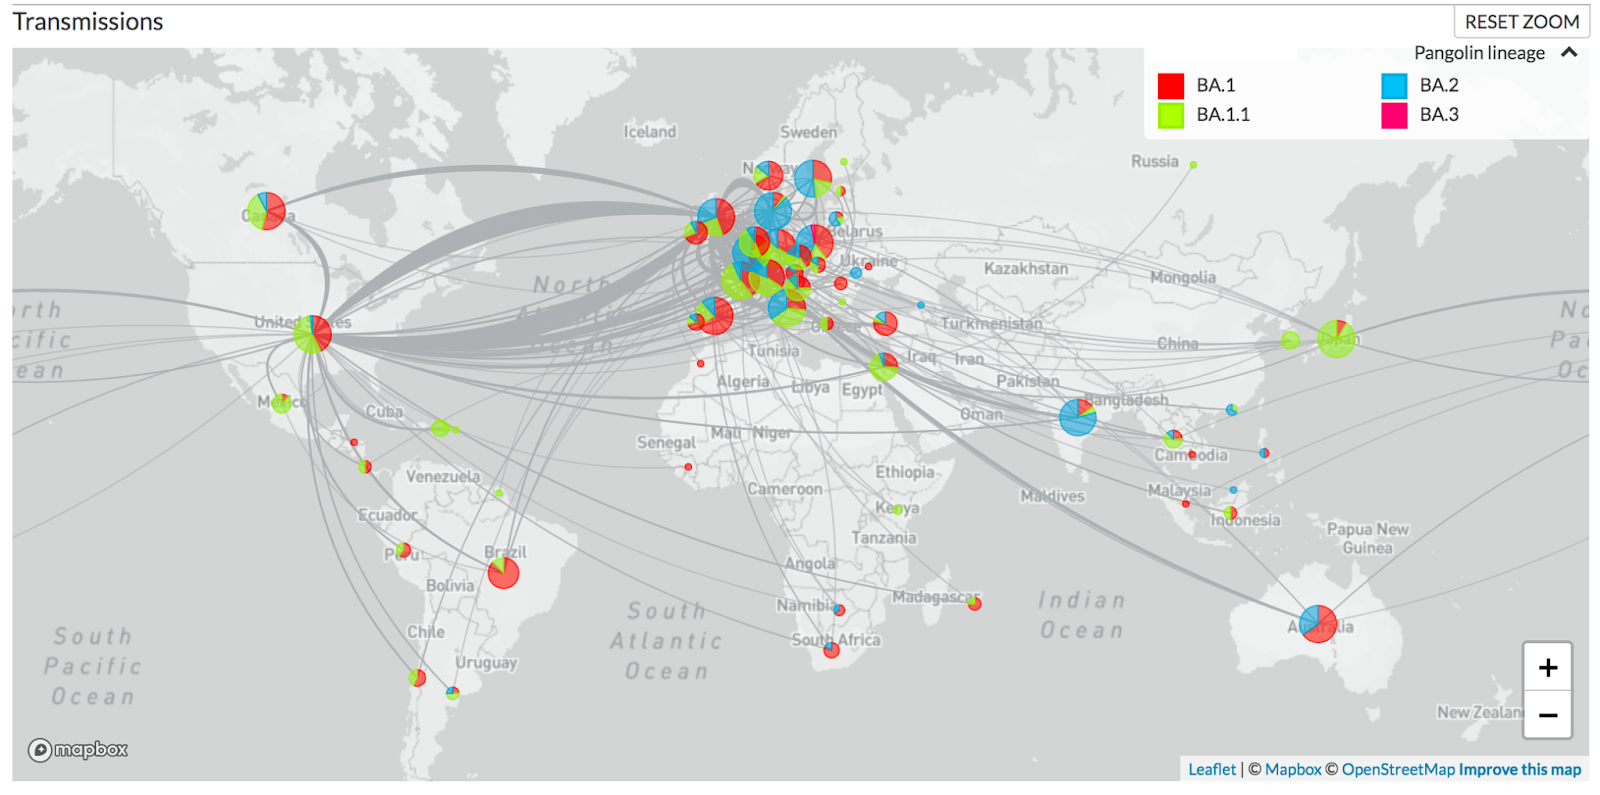
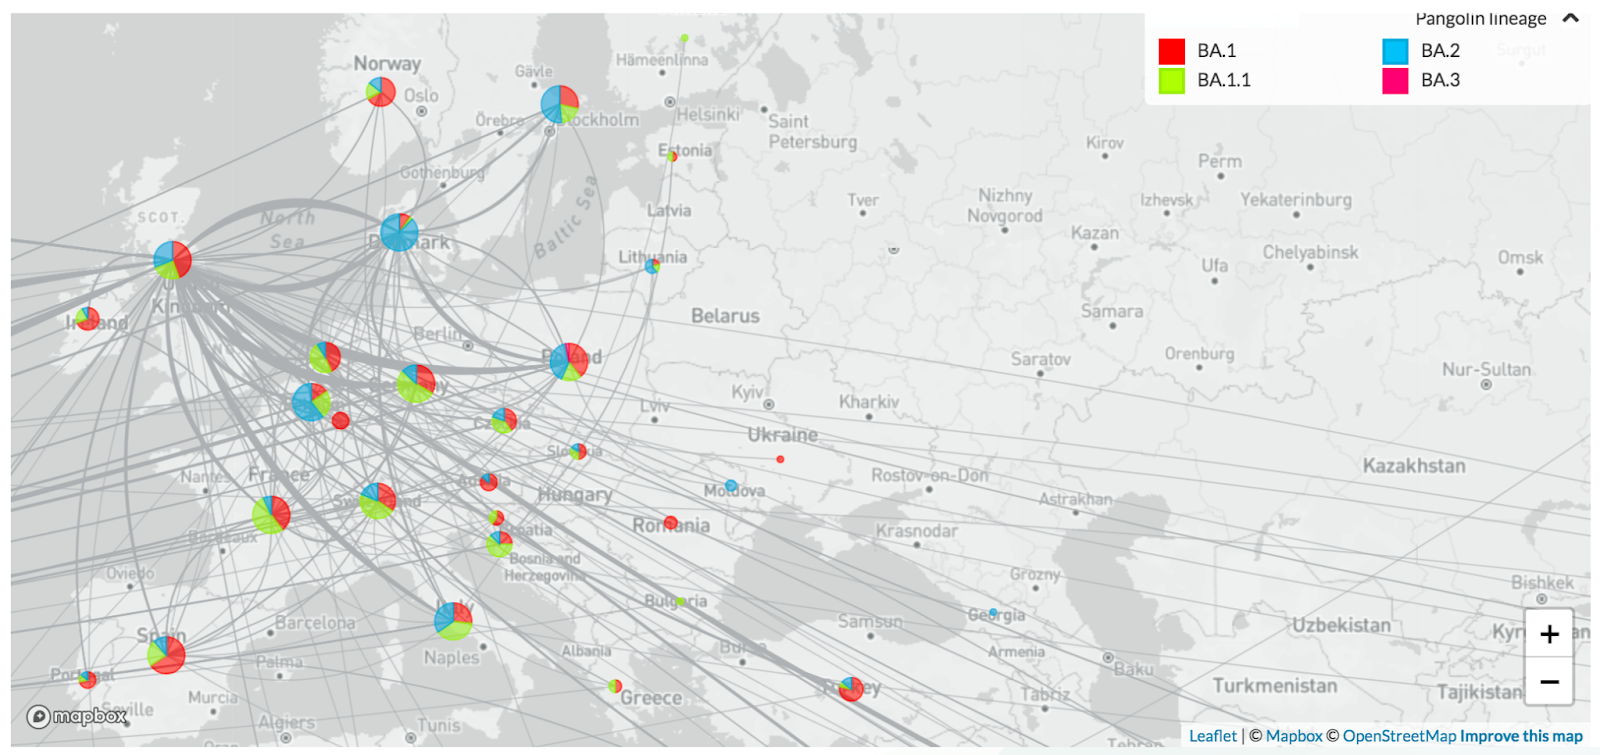
Map of Omicron sequenced transmissions:
Delta cases sequenced as of 3/13/22:
Map of Delta sequenced transmissions:
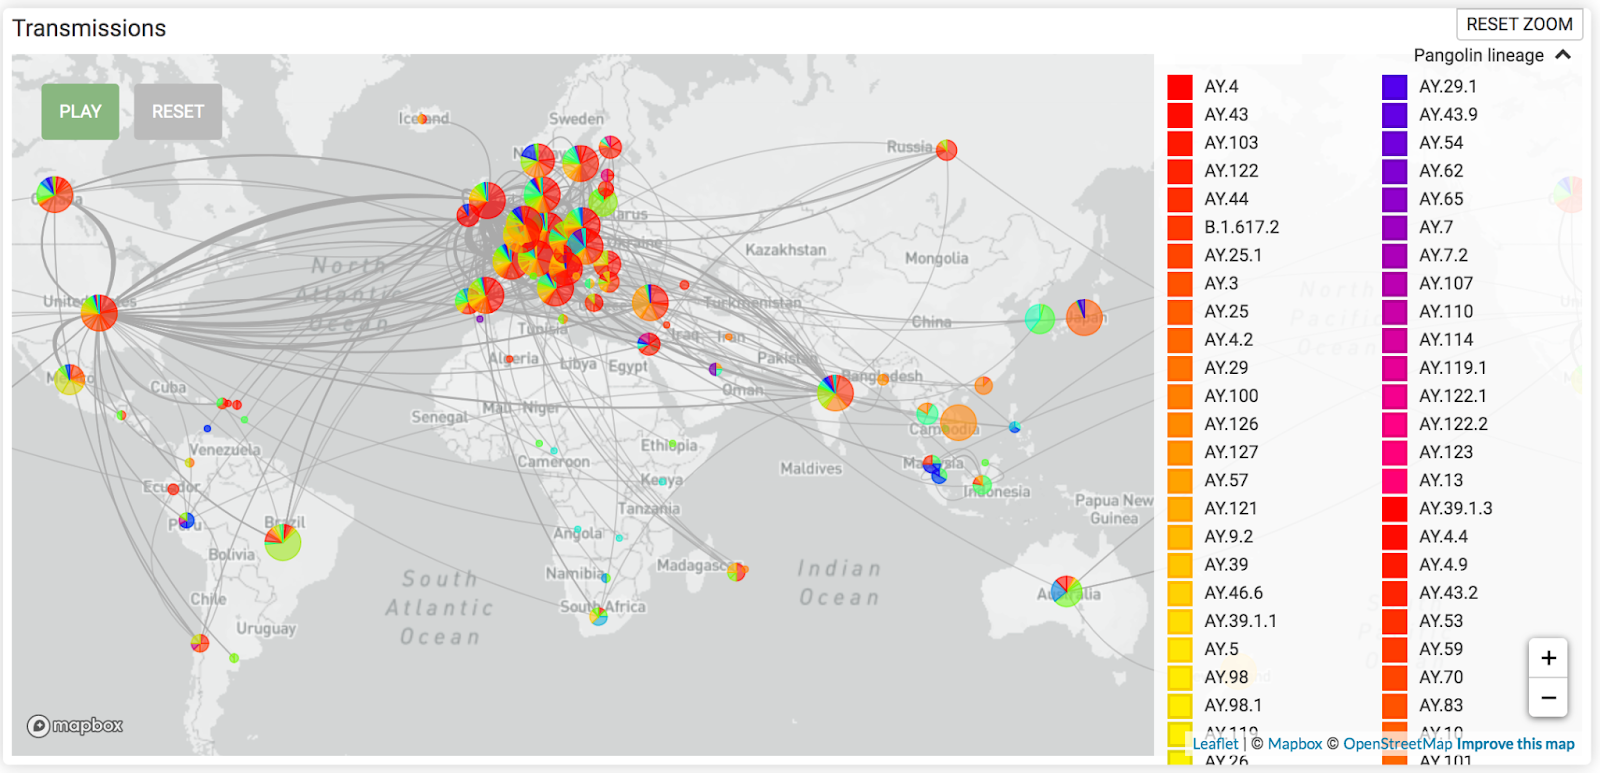
Source: GISAID
New recombinant GKA (AY.4/BA.1) cases sequenced as of 3/13/22:
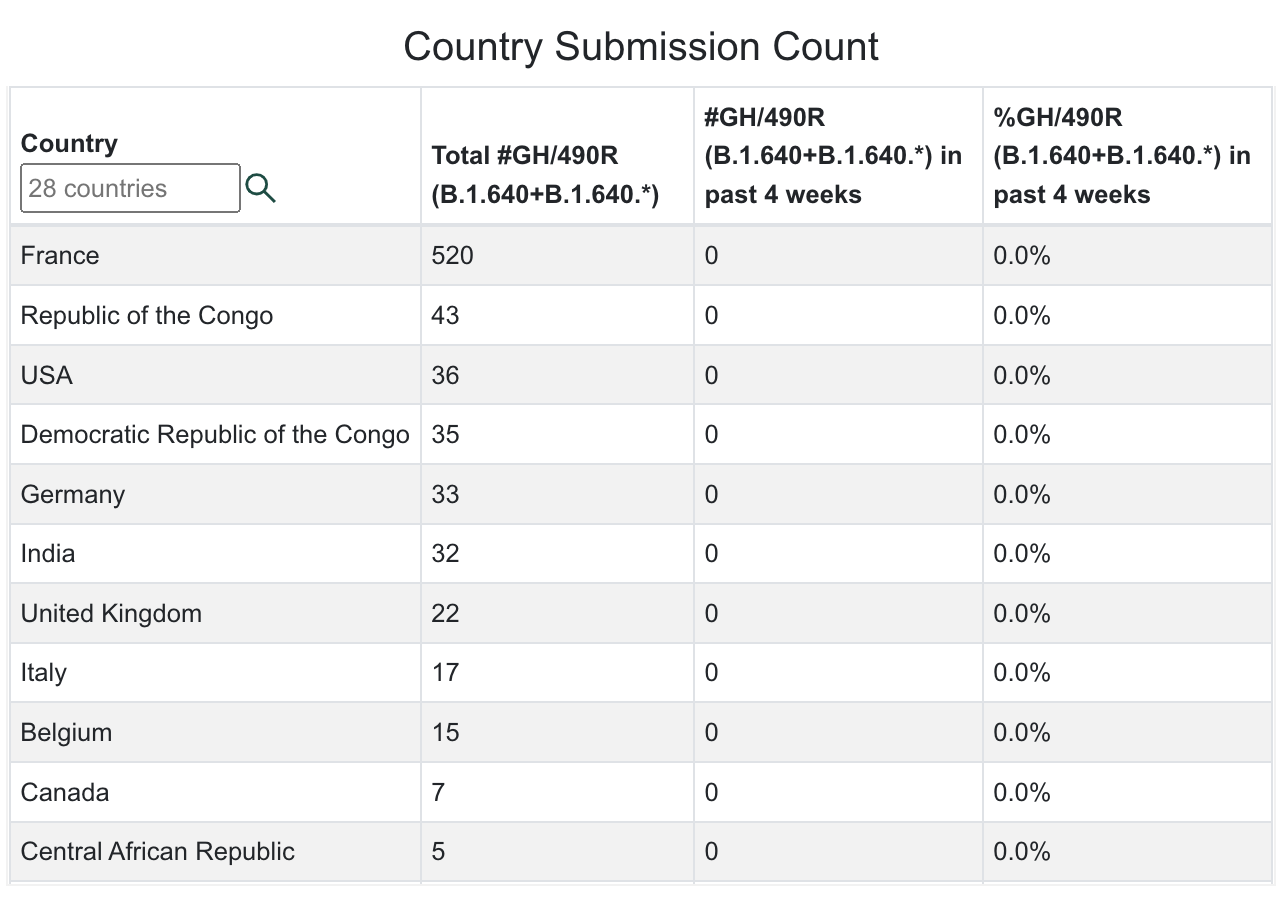
B.1.640 cases sequenced as of 3/13/22:
Watching World Data
Over the next few months, we’ll be paying close attention to correlations between the SARS-CoV-2 data, the number of isolates identified in various countries and states, and the non-pharmaceutical interventions (like mask mandates and lockdowns) put in place by state and national governments. Data on infections, deaths, and percent of population infected was compiled from Worldometers. Data for this table for SARS-CoV-2 Isolates Currently Known in Location was compiled from GISAID and the CDC. It’s worth noting that GISAID provided more data than the CDC.
| Location | Total Infections as of 3/11/22 | New Infections on 3/11/22 | Total Deaths | New Deaths on 3/11/22 | % of Pop.Infected | SARS-CoV-2 Isolates Currently Known in Location | National/ State Mask Mandate? | Currently in Lockdown? |
| World | 455,056,951(21,755,564 new infections in 14 days; an increase of 7,152,177 infections from the preceding 14 days). | 1,694,100 | 6,057,327(100,832 new deaths in last 14 days) | 6,020 | 5.83% | B2 lineageAlpha/B.1.1.7 (UK)Eta/B.1.525 (Nigeria/UK)Iota/B.1.526 (USA-NYC)Beta/B.1.351 (SA)Epsilon/B.1.427 + B.1.429 (USA)*Gamma/P.1 (Brazil)Zeta/P.2 (Brazil)A lineage isolateV01.V2 (Tanzania)APTK India VOC 32421Delta/B.1.617.2 (India)BV-1 (Texas, USA)Kappa/B.1.617.1 (India)Lambda/C.37 (Peru)Theta/P.3 (Philippines) Mu/B.1.621 (Colombia)C.1.2 (South Africa 2% of isolates in July 2021)R1 (Japan)Omicron/B.1.1.529 + BA.1 + BA.2 + BA.3 (South Africa November 2021)B.1.640.1 (Congo/France)B.1.640.2 (Cameroon/France) | No | No |
| USA | 81,154,960 (ranked #1) 622,653 new infections in the last 14 days. | 39,254 (ranked #12) | 993,044 (ranked #1)20,844 new deaths in the last 14 days. | 1,022 | 24.27% (0.18% increase in 14 days). | B2 lineageAlpha/B.1.1.7 (UK)Eta/B.1.525 (Nigeria/UK)Iota/B.1.526 (USA-NYC)Beta/B.1.351 (SA)Epsilon/B.1.427 + B.1.429 (USA)*Gamma/P.1 (Brazil)Zeta/P.2 (Brazil)Delta/B.1.617.2 (India)BV-1 (Texas, USA)Theta/P.3 (Philippines) Theta/P.3 (Philippines) Kappa/B.1.617.1 (India)Lambda/C.37 (Peru)Mu/B.1.621 (Colombia)R1(Japan) Omicron/B.1.1.529 + BA.1 + BA.2 (South Africa November 2021)B.1.640.1 (Congo/France) | No | No |
| Brazil | 29,305,114(ranked #3) 725,872 new infections in the last 14 days. | 55,211 (ranked #8) | 654,612(ranked #2) | 465 | 13.62% | B2 lineageAlpha/B.1.1.7 (UK)Beta/B.1.351 (SA)Gamma/P.1 (Brazil)Zeta/P.2 (Brazil)Lambda/C.37 (Peru)Mu/B.1.621 (Colombia) Omicron/B.1.1.529 + BA.1 (South Africa November 2021) | No | No |
| India | 42,987,875(ranked #2); increased by 83,131 infections in 2 weeks. | 3,615 | 515,833(ranked #3) | 88 | 3.06% | B2 lineageAlpha/B.1.1.7 (UK)Beta/B.1.351 (SA)Gamma/P.1 (Brazil)Epsilon/B.1.427 + B.1.429 (USA)*Eta/B.1.525 (Nigeria/UK)APTK India VOI 32421Delta/B.1.617.2 (India)Kappa/B.1.617.1 (India)Iota/B.1.526 (USA-NYC) Omicron/B.1.1.529 + BA.1 (South Africa November 2021)B.1.640.1 (Congo/France) | No | No |
| United Kingdom | 19,530,485(ranked #5; was #6 twenty-six weeks ago; increased by 725,720 infections in 2 weeks. | 72,828(ranked 4th in the world). | 161,738 (ranked #7 in world) | 114 | 28.51%(1.05% increase in the last 14 days). | B2 lineageAlpha/B.1.1.7 (UK)Eta/B.1.525 (Nigeria/UK)Beta/B.1.351 (SA)Epsilon/B.1.427 + B.1.429 (USA)*Gamma/P.1 (Brazil)Delta/B.1.617.2 (India)Theta/P.3 (Philippines) Kappa/B.1.617.1 (India)Lambda/C.37 (Peru)Mu/B.1.621 (Colombia)C.1.2 (South Africa)Omicron/B.1.1.529 + BA.1 (South Africa November 2021)B.1.640.1 (Congo/France) | No | No |
| California, USA | 9,033,843(ranked #10 in the world; 76,635 new infections in the last 14 days). | 5,153 | 87,397 (ranked #20 in world) | 143 | 22.86%(0.23% increase in 14 days). | B2 lineageAlpha/B.1.1.7 (UK)Eta/B.1.525 (Nigeria/UK)Beta/B.1.351 (SA)Gamma/P.1 (Brazil)Epsilon/B.1.427 + B.1.429 (USA)*Zeta/P.2 (Brazil)Delta/B.1.617.2 (India)Theta/P.3 (Philippines) Kappa/B.1.617.1 (India)Lambda/C.37 (Peru) Mu/B.1.621 (Colombia) Omicron/B.1.1.529 + BA.1 (South Africa November 2021) | No | No |
| Mexico | 5,591,871(ranked #19) 118,390 new infections in 14 days). | 8,098 | 320,607(ranked #5) | 197 | 4.26% | B2 lineageAlpha/B.1.1.7 (UK)Epsilon/B.1.427 + B.1.429 (USA)*Gamma/P.1 (Brazil)Delta/B.1.617.2 (India)Kappa/B.1.617.1 (India)Lambda/C.37 (Peru)Mu/B.1.621 (Colombia)Omicron/B.1.1.529 + BA.1 (South Africa November 2021) | No | No |
| South Africa | 3,691,962(ranked #24; 32,291 new infections in 14 days). | 1,671 | 99,709 (ranked #18) | 28 | 6.09% | B2 lineageAlpha/B.1.1.7 (UK)Beta/B.1.351 (SA)Delta/B.1.617.2 (India)Kappa/B.1.617.1 (India) C.1.2 (South Africa, July 2021)Omicron/B.1.1.529 + BA.1 (South Africa November 2021)B.1.640.1 (Congo/France) | No | No |
| Canada | 3,275,746(ranked #31, was 26th ten weeks ago; 81,263 new infections in 14 days). | 6,175 | 36,855(ranked #26) | 48 | 8.76% . | B2 lineageAlpha/B.1.1.7 (UK)Eta/B.1.525 (Nigeria/UK)Epsilon/B.1.427 + B.1.429 (USA)*Gamma/P.1 (Brazil)Delta/B.1.617.2 (India)Kappa/B.1.617.1 (India)Lambda/C.37 (Peru)Mu/B.1.621 (Colombia)Omicron/B.1.1.529 + BA.1 (South Africa November 2021)B.1.640.1 (Congo/France) | No | No |
| Poland | 5,799,996(ranked #17; 162,350 new infections in 14 days). | 11,637 | 113,307 (ranked #15) | 121 | 15.35% | B2 lineageAlpha/B.1.1.7 (UK)Eta/B.1.525 (Nigeria/UK)Beta/B.1.351 (SA)Delta/B.1.617.2 (India)Mu/B.1.621 (Colombia)Omicron/B.1.1.529 + BA.1 + (South Africa November 2021),Omicron/B.1.1.529 +BA.3 | No | No |
| Turkey | 14,513,774(ranked #8, 600,149 new infections in 14 days). | 25,401 | 96,217 (ranked #19) | 123 | 16.90% (0.69% of the country was infected in the last 14 days.) | B2 lineageAlpha/B.1.1.7 (UK)Eta/B.1.525 (Nigeria/UK)Beta/B.1.351 (SA)Epsilon/B.1.427 + B.1.429 (USA)*Gamma/P.1 (Brazil)Lambda/C.37 (Peru)Mu/B.1.621 (Colombia)Omicron/B.1.1.529 + BA.1 (South Africa November 2021)B.1.640.1 (Congo/France) | No | No |
| Russia | 17,242,043(ranked #6), 1,190,015 new infections in 14 days). | 50,743 | 359,585(ranked #4 in world) | 674 | 11.80%; 0.81% of the country was infected in the last 14 days. | B2 lineageAlpha/B.1.1.7 (UK)Beta/B.1.351 (SA)Delta/B.1.617.2 (India)R1 (Japan) B.1.640.1 (Congo/France)Omicron/B.1.1.529 + BA.1 (South Africa November 2021) | No | No |
| Argentina | 8,887,973(ranked #11; 1,——— new infections in 14 days). | 5,615 | 127,051 (ranked #13 in world) | 42 | 19.53% (0.16 % increase in two weeks). | B2 lineageAlpha/B.1.1.7 (UK)Eta/B.1.525 (Nigeria/UK)Beta/B.1.351 (SA)Epsilon/B.1.427 + B.1.429 (USA)*Gama/P.1 (Brazil)Delta/B.1.617.2 (India)Lambda/C.37 (Peru)Omicron/B.1.1.529 + BA.1 (South Africa November 2021) | No | No |
| Colombia | 6,075,656(ranked #14, 16,941 new infections in 14 days). | 782 | 139,255 (ranked #11 in the world) | 35 | 11.72% | B2 lineageAlpha/B.1.1.7 (UK)Beta/B.1.351 (SA)Gamma/P.1 (Brazil)Delta/B.1.617.2 (India)Epsilon/B.1.427 + B.1.429 (USA)*Iota/B.1.526 (USA-NYC)Lambda/C.37 (Peru)Mu/B.1.621 (Colombia)Omicron/B.1.1.529 + BA.1 (South Africa November 2021) | No | No |
| Peru | 3,534,687(ranked #29, 109,793 new infections in 14 days). | 72,828 | 211,423(ranked #6) | 59 | 10.47%, a 0.32% increase in 14 days). | B2 lineageAlpha/B.1.1.7 (UK)Delta/B.1.617.2 (India)Gamma/P.1 (Brazil)Iota/B.1.526 (USA-NYC)Lambda/C.37 (Peru)Mu/B.1.621 (Colombia)Omicron/B.1.1.529 + BA.1 (South Africa November 2021) | No | No |
| Indonesia | 5,5864,010(ranked #15; 359,592 new infections in 14 days) | 16,110 | 151,703 (ranked #9) | 290 | 2.10% | B2 lineageAlpha/B.1.1.7 (UK)Delta/B.1.617.2 (India)Beta/B.1.351 (SA)Eta/B.1.525 (Nigeria/UK)Theta/P.3 (Philippines) Iota/B.1.526 (USA-NYC)Kappa/B.1.617.1 (India)B.1.640.1 (Congo/France)Omicron/B.1.1.529 + BA.1 (South Africa November 2021) | No | No |
| Iran | 7,117,544 93,640 new infections in last 14 days(ranked 12th; was 12th twenty-six weeks ago) | 3,953 | 138,711 (ranked #12) | 139 | 8.29% | B2 lineageAlpha/B.1.1.7 (UK)Delta/B.1.617.2 (India)Beta/B.1.351 (SA)Omicron/B.1.1.529 + BA.1 (South Africa November 2021) | No | No |
| Spain | 11,223,974(ranked 10th; 246,450 new infections in 14 days). | 19,849 | 101,135 (ranked #17) | 58 | 23.99%, a 0.53% increase in 14 days; | B2 lineageAlpha/B.1.1.7 (UK)Delta/B.1.617.2 (India)Beta/B.1.351 (SA)Gamma/P.1 (Brazil)Epsilon/B.1.427 + B.1.429 (USA)*Eta/B.1.525 (Nigeria/UK)Iota/B.1.526 (USA-NYC)Kappa/B.1.617.1 (India)Mu/B.1.621 (Colombia)Omicron/B.1.1.529 + BA.1 (South Africa November 2021)B.1.640.1 (Congo/France) | No | No |
| France | 23,381,279 (ranked #4; 788,170 new infections). | 72,399 | 140,029 (ranked #10) | 149 | 35.68%, a 1.20% increase in the last 14 days. | Delta/B.1.617.2 (India) Omicron/B.1.1.529 South Africa November 2021)B.1.640.1 (Congo/France)B.1.640.2 (Cameroon/France) | No | No |
| Germany | 16,881,945(ranked #7) | 245,342 (ranked #2) | 125,911 (ranked #14) | 242 | 20.04% | No | No | |
| Hungary | 1,814,362 (ranked #43) | 2,068 | 44,653 (ranked #22) | 50 | 18.86% | No | No | |
| Romania | 2,787,625(ranked #37) | 2,974 | 64,292 (ranked#20) | 49 | 14.65% | No | No | |
| South Korea | 5,822,626 (ranked 16th) | 282,976(ranked #1) | 9,855 | 229 | 11.34% | No | No | |
| Ukraine | 4,894,331(ranked #21) | 5,858 | 106,985 (ranked #16) | 86 | 11.30% | No | No | |
| Vietnam | 5,734,428(ranked #18) | 177,976(ranked #3) | 41,228 (ranked #24) | 71 | 5.80% | No | No | |
| Netherlands | 7,055,814 (ranked #13) | 69,165 (ranked #6) | 21,688 (ranked #39) | 13 | 41.02% | No | No | |
| Denmark | 2,796,420 (ranked #13) | 13,036 | 5,076 (ranked #85) | 27 | 47.99% | No | No |
What Our Team Is Reading This Week
- Evidence for SARS-CoV-2 Delta and Omicron co-infections and recombination (Preprint) https://www.medrxiv.org/content/10.1101/2022.03.09.22272113v1
- Culture and identification of a “Deltamicron” SARS-CoV-2 in a three cases cluster in southern France (Preprint) https://www.medrxiv.org/content/10.1101/2022.03.03.22271812v1.full
- Mandatory masking in schools reduced COVID-19 cases during Delta surge (NIH press release) https://www.nih.gov/news-events/news-releases/mandatory-masking-schools-reduced-covid-19-cases-during-delta-surge
- School Masking Policies and Secondary SARS-CoV-2 Transmission (Pediatrics) https://publications.aap.org/pediatrics/article/doi/10.1542/peds.2022-056687/185379/School-Masking-Policies-and-Secondary-SARS-CoV-2
- Transmission of SARS-CoV-2 delta variant (AY.127) from pet hamsters to humans, leading to onward human-to-human transmission: a case study (The Lancet) https://www.thelancet.com/journals/lancet/article/PIIS0140-6736(22)00326-9/fulltext
- COVID-19 Variant Dashboard – USA by Raj Rajnarayanan https://public.tableau.com/app/profile/raj.rajnarayanan/viz/USAVariantDB/VariantDashboard
- SARS-CoV-2 variants of concern and variants under investigation in England Technical briefing 38 (UK Health Security Agency) https://assets.publishing.service.gov.uk/government/uploads/system/uploads/attachment_data/file/1060337/Technical-Briefing-38-11March2022.pdf
- SARS-CoV-2 variants of concern and variants under investigation in England Technical briefing 37 (UK Health Security Agency) https://assets.publishing.service.gov.uk/government/uploads/system/uploads/attachment_data/file/1057359/Technical-Briefing-37-25February2022.pdf
- Engineered extracellular vesicles antagonize SARS-CoV-2 infection by inhibiting mTOR signaling (Biomaterials and Biosystems) https://www.sciencedirect.com/science/article/pii/S2666534422000046?via%3Dihub
- Severe Neuro-COVID is associated with peripheral immune signatures, autoimmunity and neurodegeneration: a prospective cross-sectional study (Preprint) https://doi.org/10.21203/rs.3.rs-1385593/v1
- Dynamics of the Delta and Omicron variants of SARS-CoV-2 in the United States: the battle of supremacy in the presence of vaccination, mask usage and antiviral treatment (Preprint) https://doi.org/10.21203/rs.3.rs-1420446/v1
- Virological characteristics of SARS-CoV-2 BA.2 variant (Preprint) https://www.biorxiv.org/content/10.1101/2022.02.14.480335v1
- Transmission of SARS-CoV-2 Omicron VOC subvariants BA.1 and BA.2: Evidence from Danish Households (Preprint) https://www.medrxiv.org/content/10.1101/2022.01.28.22270044v1
- Waning 2-Dose and 3-Dose Effectiveness of mRNA Vaccines Against COVID-19–Associated Emergency Department and Urgent Care Encounters and Hospitalizations Among Adults During Periods of Delta and Omicron Variant Predominance — VISION Network, 10 States, August 2021–January 2022 (MMWR) https://www.cdc.gov/mmwr/volumes/71/wr/mm7107e2.htm?s_cid=mm7107e2_e&ACSTrackingID=USCDC_921-DM75599&ACSTrackingLabel=MMWR%20Early%20Release%20-%20Vol.%2071%2C%20February%2011%2C%202022&deliveryName=USCDC_921-DM75599
- SARS-CoV-2 B.1.1.529 (Omicron) Variant Transmission Within Households — Four U.S. Jurisdictions, November 2021–February 2022 (MMWR) https://www.cdc.gov/mmwr/volumes/71/wr/mm7109e1.htm?s_cid=mm7109e1_w
- Pediatric Emergency Department Visits Before and During the COVID-19 Pandemic — United States, January 2019–January 2022 (MMWR) https://www.cdc.gov/mmwr/volumes/71/wr/mm7108e1.htm?s_cid=mm7108e1_w#F2_down
- Birth Of The Omicron Family: BA.1, BA.2, BA.3. Each As Different As Alpha Is From Delta. (Forbes) https://www.forbes.com/sites/williamhaseltine/2022/01/26/birth-of-the-omicron-family-ba1-ba2-ba3-each-as-different-as-alpha-is-from-delta/?sh=403de4ee3da9
- Take a look at SARS-CoV-2’s family tree. It’s full of surprises (NPR) https://www.npr.org/sections/goatsandsoda/2022/02/09/1047616658/take-a-look-at-sars-cov-2s-family-tree-its-full-of-surprises
- SARS-CoV-2 variants of concern and variants under investigation in England Technical briefing 35 https://assets.publishing.service.gov.uk/government/uploads/system/uploads/attachment_data/file/1050999/Technical-Briefing-35-28January2022.pdf
- Memory B cell repertoire from triple vaccinees against diverse SARS-CoV-2 variants (Nature) https://www.nature.com/articles/s41586-022-04466-x_reference.pdf
- Dynamics of infection-elicited SARS-CoV-2 antibodies in children over time (Preprint) https://www.medrxiv.org/content/10.1101/2022.01.14.22269235v1
- Syncytin, envelope protein of human endogenous retrovirus (HERV): no longer ‘fossil’ in human genome (Animal Cells and Systems) https://doi.org/10.1080/19768354.2021.2019109
- Host Chitinase 3-like-1 is a Universal Therapeutic Target for the Delta, Omicron and Other SARS-CoV-2 Viral Variants in COVID 19 (Preprint) https://www.biorxiv.org/content/10.1101/2022.01.21.477274v1
- COVID-19 reinfections among naturally infected and vaccinated individuals (Nature) https://www.nature.com/articles/s41598-022-05325-5
- Duration of Protection against Mild and Severe Disease by Covid-19 Vaccines (NEJM) https://www.nejm.org/doi/full/10.1056/NEJMoa2115481
- Neutralizing immunity in vaccine breakthrough infections from the SARS-CoV-2 Omicron and Delta variants (Preprint) https://www.medrxiv.org/content/10.1101/2022.01.25.22269794v1
- COVID-19 and the Common Cold—Preexisting Coronavirus Antibodies May Hinder SARS-CoV-2 Immunity (JAMA) https://jamanetwork.com/journals/jama/fullarticle/2788621?guestAccessKey=0bbad800-e651-496b-8046-d124bbc63a5a&term=01262022&utm_source=silverchair&utm_medium=email&utm_campaign=article_alert-jama&utm_content=olf&utm_term=012622
- Viral dynamics and duration of PCR positivity of the SARS-CoV-2 Omicron variant https://dash.harvard.edu/handle/1/37370587
- Emergence in Southern France of a new SARS-CoV-2 variant of probably Cameroonian origin harbouring both substitutions N501Y and E484K in the spike protein (Preprint) https://doi.org/10.1101/2021.12.24.21268174
- A living WHO guideline on drugs for covid-19 (BMJ) https://doi.org/10.1136/bmj.m3379
- Longitudinal analysis reveals high prevalence of Epstein-Barr virus associated with multiple sclerosis (Science) https://doi.org/10.1126/science.abj8222
- Immunological dysfunction persists for 8 months following initial mild-to-moderate SARS-CoV-2 infection (Nature) https://www.nature.com/articles/s41590-021-01113-x
- An upper bound on one-to-one exposure to infectious human respiratory particles (PNAS) https://www.pnas.org/content/118/49/e2110117118
- Omicron escapes the majority of existing SARS-CoV-2 neutralizing antibodies (Nature) https://doi.org/10.1038/d41586-021-03796-6
- Frequent Occurrence of SARS-CoV-2 Transmission among Non-close Contacts Exposed to COVID-19 Patients (Journal of Korean Medical Science) https://doi.org/10.3346/jkms.2021.36.e233
- Serial Screening for SARS-CoV-2 in Rectal Swabs of Symptomatic COVID-19 Patients (Journal of Korean Medical Science) https://doi.org/10.3346/jkms.2021.36.e301
- Saliva swabs are the preferred sample for Omicron detection (Preprint) https://doi.org/10.1101/2021.12.22.21268246
- SARS-CoV-2 variants of concern and variants under investigation in England Technical briefing: Update on hospitalisation and vaccine effectiveness for Omicron VOC-21NOV-01 (B.1.1.529) 31 December 2021 https://assets.publishing.service.gov.uk/government/uploads/system/uploads/attachment_data/file/1044481/Technical-Briefing-31-Dec-2021-Omicron_severity_update.pdf
- Characteristics and Clinical Outcomes of Children and Adolescents Aged <18 Years Hospitalized with COVID-19 — Six Hospitals, United States, July–August 2021 (MMWR) https://www.cdc.gov/mmwr/volumes/70/wr/mm705152a3.htm
- The SARS-CoV-2 variant, Omicron, shows rapid replication in human primary nasal epithelial cultures and efficiently uses the endosomal route of entry. (Preprint) https://drive.google.com/file/d/1vam2PVMWvfRBczqs_uZbnUixGja1QPZD/view
- Initial Assessment of SARS-CoV-2 Omicron Variant in Exhaled Breath Aerosol (Preprint) https://mfr.osf.io/render?url=https%3A%2F%2Fosf.io%2Fdscy3%2Fdownload
- Multisystem Involvement in Post-acute Sequelae of COVID-19 (PASC) (Annals of Neurology) https://doi.org/10.1002/ana.26286
- Taiwan rejects US CDC guidance on 5-day quarantine (Taiwan News) https://www.taiwannews.com.tw/en/news/4393548
- Risk assessment for SARS-CoV-2 variant: Omicron VOC-21NOV-01 (B.1.1.529) (UK Health Security Agency) https://assets.publishing.service.gov.uk/government/uploads/system/uploads/attachment_data/file/1041896/15-december-2021-risk-assessment-for-SARS_Omicron_VOC-21NOV-01_B.1.1.529.pdf
- HKUMed finds Omicron SARS-CoV-2 can infect faster and better than Delta in human bronchus but with less severe infection in lung https://www.med.hku.hk/en/news/press/20211215-omicron-sars-cov-2-infection
- mRNA-based COVID-19 vaccine boosters induce neutralizing immunity against SARS-CoV-2 Omicron variant (Preprint) https://www.medrxiv.org/content/10.1101/2021.12.14.21267755v1/


You must be logged in to post a comment.