It’s time for our next 14-day moving average determinations and projections for infections and deaths from SARS-CoV-2 for the United States and my thoughts on vaccines and mutant viruses. We use the Worldometer aggregators data set to make our projections of future total infections and deaths since it includes data from the Department of Veterans Affairs, the U.S. Military, federal prisons and the Navajo Nation.
14-day Moving Averages of SARS-CoV-2 Deaths and Infections in USA
1/15/21
1/01/21
12/18/20
12/04/20
11/21/20
11/07/20
10/24/20
10/10/20
9/26/20
9/12/20
8/28/20
8/14/20
7/31/20
7/17/20
Deaths/day
3,163*
2,462
2,510
1,777
1,286
891
754
728
787
823
963
1,050
1,070
714
Infections/Day
248,131**
186,106
216,750
173,513
154,945
90,075
59,155
45,246
40,657
39,951
43,884
54,597
66,748
61,512
*701 more deaths per day than the 14-day period ending in 1/1/21 **62,025 more infections per day than the 14-day period ending in 1/1/21
In the United States, SARS-CoV-2 deaths have increased for the first time since the last 14-day period. There were 701 more deaths per day than in the last 14-day period. In the last 14 days, the number of infections has increased by 62,024 infections per day. This increase in infections over the last two-week period is due to two major holidays. On 1/15/21, 248,080 new infections occurred in the United States. There were also 3,805 deaths. Over 130,000 people are hospitalized in the USA and 28,937 serious or critically ill patients are in our hospitals as of 1/15/21.
As of 1/15/21, we have had 401,856 deaths and 24,102,429 SARS CoV-2 infections in the United States. We have had 3,473,834 new infections in the last 14 days. We are adding over 1.7 million infections every 7 days. Each million infections usually results in at least 20,000 deaths. On 1/15/21, fifteen states have had greater than 500,000 total infections, and 26 states had greater than 5,000 total deaths.
On 11/20/20 in the United States, 3.70% of the population had a documented SARS-CoV-2 infection. California was ranked 41st in infection percentage at 2.77%. In North Dakota 9.18% of the population was infected (ranked #1), and in South Dakota 8.03% of the population was infected (ranked #2).
As of 1/15/21, in the United States 7.28% of the population has had a documented SARS-CoV-2 infection. California was ranked 26th in infection percentage at 7.40%. In North Dakota 12.54% of the population was infected (ranked #1) and in South Dakota 11.86% of the population was infected (ranked #2). Thirty-six states already have greater than 6% of their population infected (North Dakota, South Dakota, Iowa, Nebraska, Wisconsin, Utah, Montana, Illinois, Idaho, Tennessee, Rhode Island, Minnesota, Wyoming, Kansas, Indiana, Arkansas, Nevada, Alabama, Oklahoma, Mississippi, Arizona, New Mexico, Louisiana, Missouri, Georgia, Alaska, Florida, Texas, Connecticut, North Carolina, Colorado, Massachusetts, Ohio, New Jersey, Delaware and Kentucky).
A new mutant SARS-CoV-2 virus (lineage B.1.1.7), first seen in the UK in September, has now been found in multiple other countries. In California, two patients in LA county and three patients in San Diego county are infected with this new mutant. Two patients in Colorado and one in Florida have also been identified as of 12/31/20. As of 1/15/21, this new mutant has been found in nine other states (New York, Georgia, Texas, Connecticut, Pennsylvania, Ohio, Utah, Maryland, and Wisconsin. This isolate (let’s call it Lineage B.1.1.7 or SARS-CoV-2 UK) is more infectious than other previously circulating B2 lineage isolates (probably 30 to 40% increased infectivity). There are two deletions and six other mutations in its spike protein. One mutation involves a change of one amino acid, an asparagine at position 501 in the receptor binding motif with a tyrosine. This enhances binding (affinity) to the ACE-2 receptor and may alone be responsible for the increased infectivity of this isolate. Due to air and other travel this isolate should become the dominant isolate worldwide.
In a research letter pending publication in Clinical Infectious Diseases, a group of NHS doctors describe the case of a patient who was first infected with SARS-CoV-2 in April and became reinfected in December. After the patient’s second infection, Whole Genome Sequencing (WGS) was performed on samples from both instances of infection, and it was determined that the first infection in April was with a B.2 lineage variant and the second infection was with the new B.1.1.7 variant. While the patient, “a 78 year old man with a history of Type 2 Diabetes Mellitus, diabetic nephropathy on haemodialysis, chronic obstructive pulmonary disease (COPD), mixed central and obstructive sleep apnoea, ischaemic heart disease, with no history of immunosuppression” had only had a mild illness (fever being the only symptom) during the first infection, during the second infection, he had much more severe symptoms, including shortness of breath and hypoxia, which led to emergency intubation. He developed “Severe Covid-19 pneumonia complicated by mycocardial infarction with resulting trifascicular block and Atrio-Ventricular (AV) dissociation and pulmonary oedema.” (To read the full research letter, visit https://academic.oup.com/cid/advance-article/doi/10.1093/cid/ciab014/6076528 and click PDF.)
The patient described in this research letter was not protected by a natural infection with a B2 lineage SARS-CoV-2 isolate in April 2020 from having a potentially lethal second infection with a B.1.1.7 lineage variant in December 2020, suggesting that folks who have had a past SARS-CoV-2 infection should not expect to have any immunity to new variants such as B.1.1.7. All of the currently available vaccines were developed with spike protein from B2 lineages, so it remains to be seen whether these vaccines will protect against B.1.1.7 infections or the additional isolates discussed below.
A second mutation in the loop sequence has been identified in the South African, Brazilian, and Japanese isolates this week. This mutation will also enhance binding to the ACE-2 receptor and may interfere with binding of monoclonal antibodies to the SARS-CoV-2 receptor binding motif. If this rate of mutations and deletions continues in the spike protein, especially in the receptor binding domain and motif, in my opinion, then vaccine reformulation will be required in 2021.
We have a new President-elect and Vice President-elect, now confirmed by the electoral college and approved in the House and Senate on 1/06/21 despite a riot and invasion of the Capital by President Trump’s supporters. The President-elect has made the pandemic a first priority after Inauguration on January 20, 2021. Testing, wearing masks, social distancing and washing our hands frequently should no longer be political issues. These are non-pharmaceutical interventions used by most successful countries and some states to protect their citizens and their economies. New Zealand, Taiwan, and Australia are three countries that have done this successfully. In the United States, Maine, Vermont, and Hawaii are doing a better job handling the pandemic than many of our states. The pandemic problem is overwhelming our health care delivery system in many states. Unless things change before Inauguration Day on January 20, 2020 (5 days away) we could, by our predictions, have an additional 1,221,405 SARS-CoV-2 infections and another 15,815 deaths. Our infections per day and deaths per day will continue to increase for at least another 8 to 12 weeks.
The Pfizer and Moderna RNA vaccines are both now approved in the USA. To vaccinate 80% of our population with two doses of vaccine, we will need over 500 million doses of vaccine. Unless we start vaccine shipments to clinics and physicians’ offices, not just hospitals and pharmacies, I doubt most people will be able to receive any vaccine until April 2021.
All current vaccines are based on the Chinese spike protein sequence from December 2019. Mutated isolates, as discussed above, may overtake our ability to produce vaccines and vaccinate the populace. Like Influenza vaccines, we may have to reformulate vaccines based on active, worldwide surveillance every 8 to 12 months. We need to perform more virus isolations and perform more DNA sequencing of viruses in each country, state, populous city, and county if we are to rapidly identify new mutations. I’m not sure we have the facilities, the equipment, and the trained staff needed to perform this work. I feel we are not prepared (or preparing) to do this and will suffer the consequences if we continue down our current path. “Magical thinking” will not solve these problems, just laborious work by many people. Are we all up to the tasks at hand?
It’s time for our next 14-day moving average determinations and projections for infections and deaths from SARS-CoV-2 for the United States. We use the Worldometers aggregators data set to make our projections of future total infections and deaths since it includes data from the Department of Veterans Affairs, the U.S. Military, Federal Prisons and the Navajo Nation.
14-day moving averages of SARS-CoV-2 Deaths and Infections in the USA
11/21/20
11/07/20
10/24/20
10/10/20
9/26/20
9/12/20
8/28/20
8/14/20
Average deaths per day
1,286*
891
754
728
787
823
963
1,050
Average infections per day
154,945**
90,075
59,155
45,246
40,657
39,951
43,884
54,597
*395 more deaths per day than 11/07/20 **64,870 more infections per day than 11/07/20
In the United States, SARS-CoV-2 deaths have increased for the third time in a 14-day period after decreasing in each of five previous 14-day periods. There were 395 more deaths per day in the last 14 days. In the last 14 days, the number of infections has increased by 64,870 infections per day. Deaths per day will continue to increase at least over the next 8 to 10 weeks. On 11/20/20, 204,179 new infections occurred in the United States, another new daily record for infections. There were also 1,999 deaths and 22,789 serious or critically ill patients in our hospitals on 11/20/20.
As of 11/20/20 we have had 260,331 deaths and 12,277,827 SARS CoV-2 infections in the United States. This represents 21.2% of the infections and 18.9% of the deaths in the world from SARS-CoV-2. We have had 2,169,236 new infections in the last 14 days. We are adding one million infections every 7 days. Each million infections usually results in at least 20,000 deaths. On 11/20/20, thirty five states had greater than 100,000 total infections and 29 states had greater than 2,000 total deaths. Only 58 other countries have greater than 100,000 infections and only 51 countries have more than 2,000 deaths.
We have a new President-elect and Vice President-elect that are making the pandemic a first priority after Inauguration on January 20, 2021. Testing, contact tracing, wearing masks, social distancing, and washing our hands frequently should no longer be political issues. These are non-pharmaceutical interventions used by most successful countries and some states to protect their citizens and their economies. New Zealand, Taiwan, and Australia are three countries that have done this successfully. In the United States, Maine, Vermont, and Hawaii are doing a better job handling the pandemic than many of our states. The pandemic problem is overwhelming our health care delivery system in many states. Unless things change before Inauguration Day on January 20, 2020 (61 days away) we could by our predictions have an additional 9,451,645 SARS-CoV-2 infections and another 78,446 deaths. If our infections per day and deaths per day continue to increase these numbers will, once again, be underestimations of the problem.
It’s time for our next 14-day moving average determinations and projections for infections and deaths from SARS-CoV-2 for the United States. We use the Worldometers aggregators data set to make our projections of future total infections and deaths since it includes data from the Department of Veterans Affairs, the U.S. Military, federal prisons and the Navajo Nation.
11/07/20
10/24/20
10/10/20
9/26/20
9/12/20
8/28/20
8/14/20
7/31/20
Average Deaths per day*
891
754
728
787
823
963
1,050
1,070
Average Infections per day**
90,075
59,155
45,246
40,657
39,951
43,884
54,597
66,748
*137 more deaths per day than 10/24/20 14-day period **30,920 more infections per day than 10/24/20 14-day period
In the United States, SARS-CoV-2 deaths have increased for the second time in a 14-day period after decreasing in each of five previous 14-day periods. There were 137 more deaths per day in the last 14 days. In the last 14 days, the number of infections per day has increased by 30,920. Deaths per day will continue to increase at least over the next 8 to 12 weeks. On 11/06/20, 132,540 new infections occurred in the United States, another new daily record for infections. There were also 1,248 deaths and 18,303 serious or critically ill patients in our hospitals on 11/06/20.
As of 11/06/20, we have had 242,230 deaths and 10,058,586 SARS-CoV-2 infections in the United States. This represents 20.2% of the infections and 19.4% of the deaths in the world from SARS-CoV-2. On 10/24/20, 29 states in the United States had greater than 100,000 infections and 26 states had greater than 2,000 deaths. On 11/06/20, 32 states have greater than 100,000 infections and 28 states have greater than 2,000 deaths. Only 57 other countries have greater than 100,000 infections, and only 45 countries have more than 2,000 deaths.
As of 10/24/20, in the United States, 2.642% of the population has had a documented SARS-CoV-2 infection. California was ranked 33rd in infection percentage at 2.270%. In North Dakota, 4.716% of the population was infected (ranked #1) and in South Dakota 4.205% of the population was infected (ranked #2). As of 11/06/20, in the United States, 3.038% of the population has had a documented SARS-CoV-2 infection. California was ranked 36th in infection percentage at 2.44%. In North Dakota 6.77% of the population was infected (ranked #1) and in South Dakota 5.95% of the population was infected (ranked #2). On 11/06/20, Texas became the first state to record over a million total infections. They had 9,239 infections and 124 deaths on 11/06/20, bringing their total infections to 1,007,155 and total deaths to 19,154. 3.47% of Texas residents have had an infection. Probably greater than 90% of the people in the USA have not had their first SARS-CoV-2 infection.
We have a new President-elect and Vice President-elect today. Testing, contact tracing, wearing masks, social distancing and washing our hands frequently should no longer be political issues. These are non-pharmaceutical interventions used by most successful countries and some states to protect their citizens and their economies. New Zealand, Taiwan, and Australia are three countries that have done this successfully. In the United States, Maine, Vermont, New Hampshire, Hawaii and Oregon are doing a better job handling the pandemic than many of our states. The pandemic problem is about to overwhelm our health care delivery system in many states. Unless things change before Inauguration Day on January 20, 2021 (75 days away) we could, by our predictions, have 6,755,625 new SARS-CoV-2 infections and another 66,825 deaths. If our infections per day and deaths per day continue to increase, these numbers will be underestimations of the problem.
It’s time for our next 14-day moving average determinations and projections for infections and deaths from SARS-CoV-2 for the United States. We use the Worldometers aggregators data set to make our projections of future total infections and deaths since it includes data from the Department of Veterans Affairs, the U.S Military, federal prisons and the Navajo Nation.
14-day moving averages of SARS-CoV-2 Deaths and Infections
10/10/20
9/26/20
9/12/20
8/28/20
8/14/20
Average deaths per day
728*
787
823
963
1,050
Average infections per day
45,246**
40,657
39,951
43,884
54,597
*59 fewer deaths per day than 9/26/20 **4,589 more infections per day than 9/26/20
In the United States, SARS CoV-2 deaths have decreased in each of the last five previous 14-day periods. There were 59 fewer deaths per day in the last 14 days. However, in the last 14 days the number of infections has increased by 4,589 infections per day. Deaths per day should increase over the next 2 to 3 weeks.
As of 10/09/20 we have had 218,647 deaths and 7,894,478 SARS CoV-2 infections in the United States. This represents 21.3% of the infections and 20.4% of the deaths in the world from SARS-CoV-2. Twenty-four states in the United States have greater than 100,000 infections, and 26 states have greater than 2,000 deaths. Only 43 other countries have greater than 100,000 infections and only 41 countries have more than 2,000 deaths.
It’s time for our next 14-day moving average determinations and projections for infections and deaths from SARS-CoV-2 for the United States. We use the Worldometers aggregators data set to make our projections of future total infections and deaths since it includes data from the Department of Veterans Affairs, the U.S Military, federal prisons and the Navajo Nation.
14-day moving averages of SARS-CoV-2 deaths and infections
9/26/20
9/12/20
8/28/20
8/14/20
7/31/20
Average Deaths Per Day
787
823
963
1,050
1,070
Average Infections Per Day
40,657
39,951
43,884
54,597
66,748
*36 fewer deaths per day than on 9/12/20 **706 more infections per day than 9/12/20
In the United States the SARS-CoV-2 deaths have decreased in each of the last four previous 14-day periods. There were 36 fewer deaths per day in the last 14 days. However, in the last 14 days, the number of infections has increased by 706 infections per day.
As of 9/26/20 we have had 208,440 deaths and 7,244,184 SARS-CoV-2 infections in the United States. This represents 22% of the infections and 21% of the deaths in the world from SARS-CoV-2. Twenty-two states in the United States have greater than 100,000 infections and 26 states have greater than 2,000 deaths. Only 37 other countries have greater than 100,000 infections and only 38 countries have more than 2,000 deaths.
Our new projections for the United States are that by October 4, 2020, we will have had 214,696 total deaths and 7,569,440 infections.
Our new projections for the United States are that by November 4, 2020, we will have had 239,093 total deaths and 8,829,807 total infections.
It’s time for our next 14-day moving average determinations and projections for infections and deaths from SARS-CoV-2 (COVID-19) for the United States. We use the Worldometers aggregators data set to make our projections of future total infections and deaths, since it includes data from the Department of Veterans Affairs, the U.S. Military, federal prisons, and the Navajo Nation.
14-Day Moving Averages of SARS-CoV-2 Infections and Deaths
9/12/20
8/28/20
8/14/20
7/31/20
7/17/20
Average Deaths per day
823*
963
1,050
1,070
714
Average Infections per day
39,951**
43,884
54,597
66,748
61,512
*140 fewer deaths/day than 8/28/20 **3,933 fewer infections/day than 8/28/20
The SARS-CoV-2 infections and subsequent deaths have decreased in each of three previous 14-day periods. In the last 14 days, the number of infections has decreased by 3,933 infections per day, and average deaths per day have decreased by 140 deaths per day.
As of 9/11/20 we have had 197,177 deaths and 6,636,247 SARS-CoV-2 infections in the United States.
Our new projections for the United States are that by October 4, 2020 we will have had 211,283 total deaths and 7,507,249 infections.
Our new projections for the United States are that by November 4, 2020 we will have had 241,734 total deaths and 8,972,116 total infections.
It’s time for our next 14-day moving average determinations and projections for infections and deaths from SARS-CoV-2 (COVID-19) for the United States. We use the Worldometers aggregators data set to make our projections of future total infections and deaths since it includes data from the Department of Veterans Affairs, the U.S. Military, federal prisons and the Navajo Nation.
14-Day Moving Averages of SARS-CoV-2 Deaths and Infections
8/28/20
8/14/20
7/31/20
7/17/20
Average deaths per day
963*
1,050
1,070
714
Average infections per day
43,884**
54,597
66,748
61,512
*87 fewer deaths per day than 8/14/20 **10,713 fewer infections per day than 8/14/20
The SARS-CoV-2 infections and subsequent deaths were decreasing in each of two previous 14-day periods. In the last 14 days, the number of infections has decreased by 10,713 infections per day and average deaths per day has decreased by 87 deaths per day.
As of 8/28/20 we have had 185,901 deaths and 6,096,235 SARS-CoV-2 infections in the United States. Our new projections for the United States are that by October 4, 2020, we will have had 222,383 total deaths and 7,719,943 infections. We also project that by November 4, 2020, we will have had 252,949 total deaths and 9,101,347 total infections.
It’s time for our next 14-day moving average determinations and projections for infections and deaths from SARS-CoV-2 for the United States. We use the Worldometers aggregators data set to make our projections of future total infections and deaths since it includes data from the Department of Veterans Affairs, the U.S Military, Federal Prisons and the Navajo Nation.
14-Day Moving Averages of SARS-CoV-2 Infections and Deaths
8/14/20
7/31/20
7/17/20
Average Deaths Per Day
1,050
1,070
724
20 fewer deaths per day compared with 7/31/20
Average Infections Per Day
54,597
66,748
61,512
12,157 fewer infections per day compared with 7/31/20
The SARS-CoV-2 infections and subsequent deaths were increasing in each of two previous 14-day periods. In the last 14 days, the number of infections has decreased by 12,157 infections per day and average deaths per day has decreased by 20 deaths per day.
As of 8/14/20 we have had 171,535 deaths and 5,476,266 SARS CoV-2 infections in the United States.
Our new projections for the United States are that by October 4, 2020, we will have had 225,085 total deaths (a decrease in projected deaths from 226,297 total deaths) and 8,260,713 infections (a decrease in projected infections from 9,044,509 total infections).
Our new projections for the United States are that by November 4, 2020, we will have had 257,635 total deaths and 9,953,220 total infections.
By our way of counting, this is Day 161 of the COVID-19 pandemic. To date, we have neither a vaccine nor a widely available drug to effectively treat or prevent this infection. Our first USA case was identified in Washington State on Day 21 of the pandemic. In those next 140 days (20 weeks) the United States, as of 6/08/20, had 2,007,499 known COVID-19 PCR positive infected patients and 112,469 deaths, giving us a death rate of 5.6%. We had 18,905 new cases and 16,923 people in serious or critical condition on that day. That was the twentieth consecutive day that we’ve had over 16,900 people in serious or critical condition in the United States. We have 1,315,537 more COVID-19 positive infected patients than any other country in the world. The five countries other than the United States with the most cases (Brazil, Russia, Spain, the United Kingdom, and India) have a total of 1,991,945 cases combined, which is 15,544 fewer cases than in the United States.
Four rapidly expanding “hot spot” countries on 6/07/20 are India with 257,486 infections and 10,864 new infections, Peru with 186,515 infections and 4,757 new infections, Russia with 467,673 infections and 8,849 new infections and Brazil with 691,962 infections and 18,375 new infections.
Our Updated COVID-19 Projections
The University of Washington’s Institute of Health Metrics (IHME) said on 4/28/20 that we would have a total of 74,000 deaths in the USA by August 5, 2020. In contrast to this, we analyzed the case and death data using our two methods again on 5/22/20. We estimated that we would reach 2,000,000 infected patients by June 7th (in 15.4 days, 369 hours or 2.2 weeks) and have between 17,710 and 20,513 new deaths for a total number of deaths between 115,357 and 118,156. The actual numbers by the morning of June 8th were 2,007,499 and 112,469 deaths (Worldometers). We use the Worldometers numbers rather than the Johns Hopkins numbers because Worldometers includes Veteran deaths in VA facilities, deaths in the US Military, deaths in Federal Prisons, and deaths in the Navajo Nation.
Our estimates of the number of COVID-19 deaths on June 7th were higher than the actual deaths by 2,888 deaths or 2.57%. We think this overestimation of the number of deaths might be because of hyperimmune plasma use, Remdesivir use, use of both or possibly better critical care at US hospitals. Other possibilities might be decreasing virulence of COVID-19 or flaws in our predicted models of deaths. Our modeling of the number of infected patients was off by 0.37% or 7,499 additional infections.
All of our past predictions from 4/28/20, 5/03/20, 5/08/20 and 5/22/20 for time to reach 2,000,000 infections and the estimate of the number of deaths are listed in the following chart:
We don’t usually project out 2 months for total infections and deaths, but if we did, using our methodologies, in our new projections over the next 58 days we would predictthat by August 4, 2020 inclusive in the United States we will have 3,264,069 COVID-19 infected patients and a total of between 165,307 and 182,836 deaths. If the death rate (now 5.60%)decreases further, these estimates of the number of deaths will be too high.
State of California
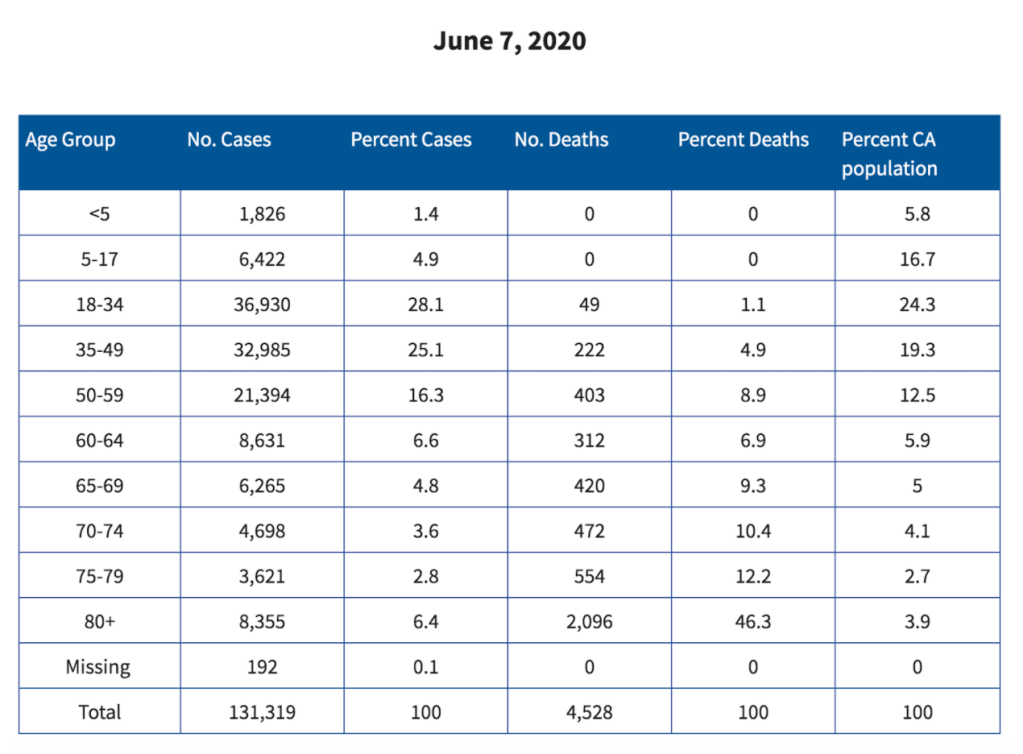
As of 6/07/20, the State of California has 131,319 total infections, 2,279 new infections, 4,653 total deaths. On 6/07/20, California reported 4,506 hospitalized COVID-19 patients (on that day) and 1,301 patients in the ICU. If California were a country, it would rank 18th in total number of cases in the world (above China) and 14th in total deaths (above Mexico). It would rank 4th in the world in ICU patients (between Brazil and Iran).
Click to enlarge images.
Monterey County
As of 6/07/20, Monterey County has 763 total COVID-19 infections, 12 new infections and 11 total deaths (3 new deaths since our last report on 5/24/20). An unknown number of deaths (< 11 according to CPHD) have been reported at a skilled nursing home in Salinas (Windsor The Ridge Rehabilitation Center). COVID-19 infections in Healthcare workers at two other skilled nursing facilities in the cities of Monterey and Soledad have been reported to CPHD. Two infected State prison employees have been reported in a state prison in Soledad.
We have expanding numbers of infections in eight zip codes 93901 (Salinas, 54 total infections), 93905 (Salinas, 233 total infections), 93906 (Salinas, 144 total infections), 93907 (North County, 31 total infections), 93926 (Gonzales, 28 total infections), 93927 (Greenfield, 67 total infections), 93960 (Soledad, 49 total infections) and 93930 (King City, 63 total infections). We continue to have new infections and deaths in our county that are not occurring in our neighboring agricultural counties Santa Cruz and San Benito Counties. We have five times the number of deaths that Santa Cruz and San Benito County have. We are not yet seeing infections in Pacific Grove, Carmel, Pebble Beach, Carmel Highlands or Carmel Valley. The differences in total infections in parts of our county compared to these other counties, valleys and cities have not been explained by public health officials.
The United States still leads the world in COVID-19 cases and deaths.
We have no effective available oral treatment or preventative drugs, vaccines or hyperimmune intravenous immunoglobulin for COVID-19. Potential therapies are probably 6 to 9 months away.
Despite the data, in the United States our political leaders , federal agencies, and many state public health officials have decided to open back up our country.
In California, although ICU numbers have been stable the last 7 days, COVID-19 cases and deaths are still on the rise. The majority of reported cases (50.8%) are in the 18-49 age group.
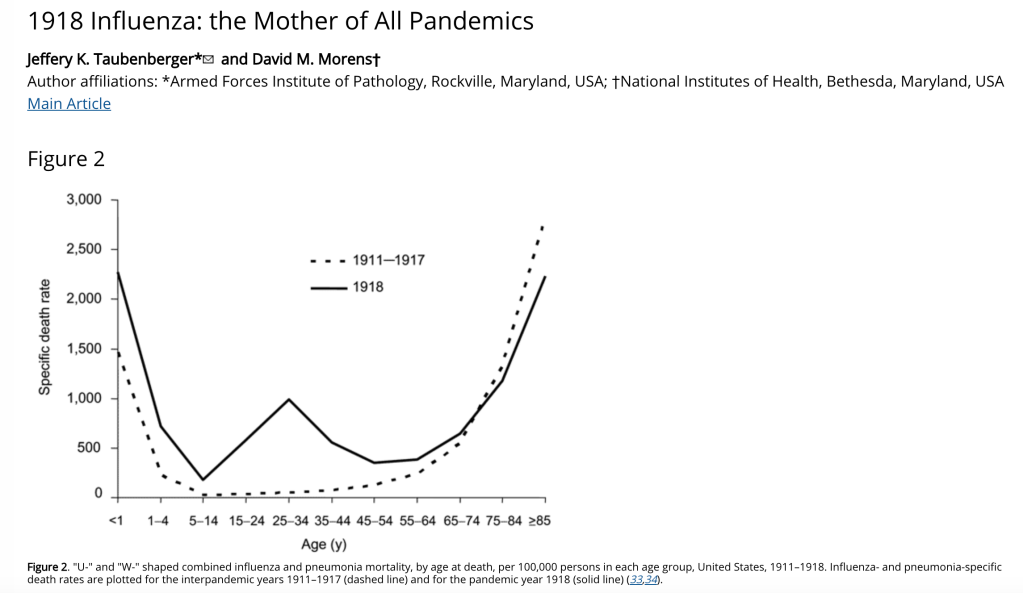
We examine the 1918 flu pandemic’s impact on different age groups and compare it with this year’s COVID-19 data in California, concluding that closing schools early was wise and reopening in August would be deadly.
We continue to recommend staying home whenever possible, wearing a mask in public, and staying 6 feet apart from people outside your household. We outline suggestions for businesses and organizations seeking to reopen more safely, highlighting the dangers of congregating in buildings with poor ventilation (which is most buildings).
In Monterey County, agricultural workers, health care workers, and first responders are among the occupations most impacted by COVID-19. More than half of COVID-19 patients in the county have no known pre-existing medical condition.
The incomplete nature of the data collected from California’s skilled nursing homes is problematic.
Based on our modeling, we expect to have 2 million COVID-19 infections and 115,357 deaths in the United States by June 7.
By August 4, 2020, at our current rate of new COVID-19 infections and deaths, we anticipate 3,337,190 COVID-19 infected patients and a total of 192,613 deaths.
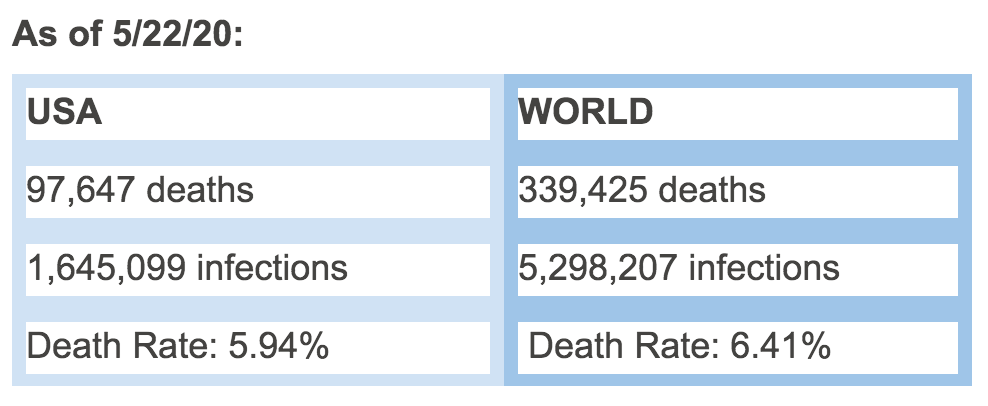
By our way of counting, this is Day 145 of the COVID-19 pandemic. To date, we have neither a vaccine nor a widely-available drug to effectively treat or prevent this infection. Our first USA case was identified in Washington State on Day 21 of the pandemic. In those next 124 days (17.7 weeks) the United States, as of 5/22/20, had 1,645,099 known COVID-19 PCR positive infected patients and 97,647 deaths, giving us a still rising death rate of 5.94%. We had 24,197 new cases and 17,109 people in serious or critical condition on that day. That was the fourth day in a row that we’ve had over 17,000 people in serious or critical condition in the United States. We have 1,314,204 more COVID-19 positive infected patients than any other country in the world. The five countries other than the US with the most cases (Brazil, Russia, Spain, the United Kingdom, and Italy) have a total of 1,422,095 cases combined, which is 223,004 fewer cases than in the United States.
Four rapidly expanding “hot spot” countries are India with 118,226 infections and 6,198 new infections on 5/21/20, Peru with 108,769 infections and 4,749 new infections, Russia had 317,554 infections and 8,849 new infections on 5/21/20, and Brazil had 310,921 infections and 17,564 new infections. Today we’ll focus our discussion on the State of California and Monterey County.
State of California
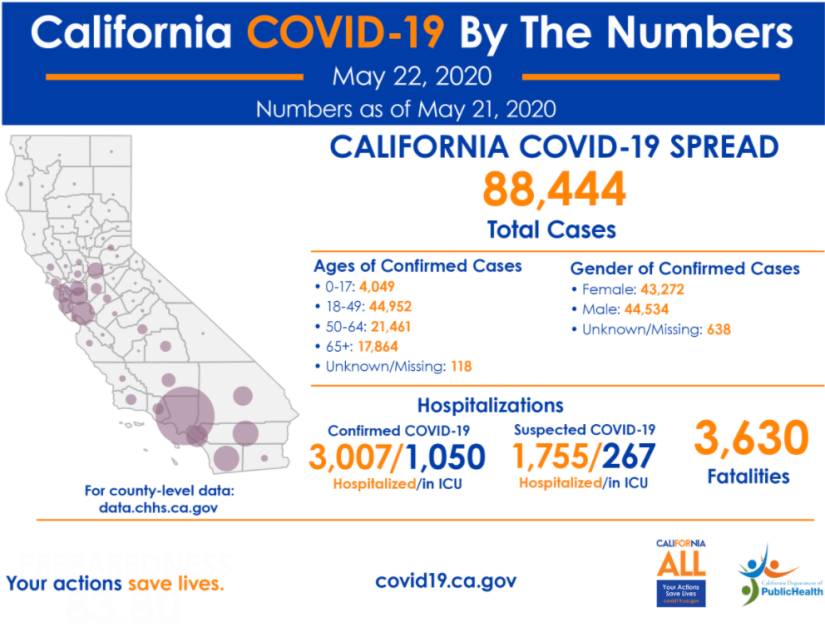
As of 5/21/20, the State of California has 88,488 total infections, 3,624 new infections, 3,624 total deaths and 110 new deaths. On 5/21/20, California had more new deaths than any other state, with the exception of New York and was 7th in total deaths in the United States, having just surpassed Connecticut’s deaths. On 5/21/20, California reported 4,735 hospitalized COVID-19 patients (on that day) and 1,310 patients in the ICU. If California were a country, it would rank 13th in total number of cases in the world (above China) and 17th in total deaths (between Russia and India). It would rank 10th in new deaths in the world on 5/21/20. It would rank 7th in the world in ICU patients (between Spain and the UK). As of 5/21/20, California reported conducting 1,421,127 COVID-19 tests, which represents 3.57% of California’s population of 39.78 million. However, we know that some people have been tested more than once, so in fact, less that 3.57% of the population has been tested for COVID-19.
So what can these numbers suggest to us about what public policies would be prudent at this time for California? Here’s what we think:
Keep School Buildings Closed to Protect Youth and the Elderly
From the beginning of the pandemic, it was messaged to us by public health officials and politicians alike that COVID-19 disproportionately affects folks 65 and over and those with underlying health conditions, leading young healthy folks to believe that they would not be infected or become seriously ill. This made it more difficult for young working people to accept the stay-at-home order as the new way of life, and many are counting down the days, hours, and minutes until they can return to work in person, get their hair and nails done, and return to their local bars, restaurants, gyms, and sporting events.
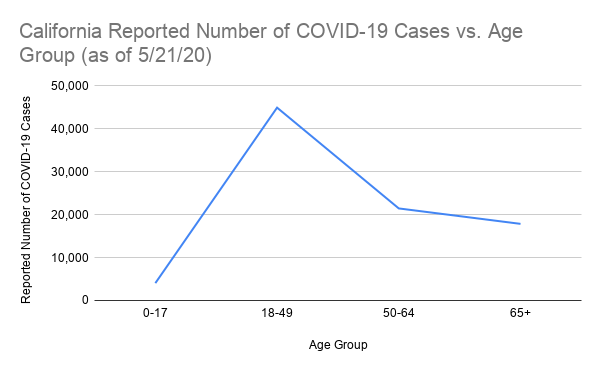
However, if we look at the data on which age groups are most affected by COVID-19, we see a much different picture. In California, as of 5/21/20, the age group with the largest number of confirmed infections is people 18-49 years of age, with 44,953 infections, compared to 21,461 people 50-64 and 17,864 people 65 and up. The 0-17 age group has 4,049 cases. (Incidentally, the 0-17 age group is also the least-tested group.) We know that 7,908 of those 65+ folks are residents in skilled nursing facilities are infected with COVID-19, so when you take those folks out of the equation, there are only 9,956 other people over the age of 65 infected in California. Deaths in skilled nursing facilities make up 39.5% of the COVID-19 deaths in California. The point is that people over 65 who are not in skilled nursing facilities are not getting infected at the same rate as younger people. Now, it might be a coincidence, but we can’t help noticing that the two age groups that we have essentially mandated stay home since mid-March (school-aged children and senior citizens) have the lowest numbers of infections. Perhaps preventing infections is not as complicated as folks are making it out to be.
A standard Influenza respiratory epidemic has a U-shaped death curve (see dotted line 1911-1917 curve below), meaning that you have very young and very old people dying. What happened in the 1918 Influenza pandemic is that they had a W-shaped curve (see solid line below). The peak in the middle happened to be people between the ages of 20 and 40.
If we look at the data from the 2020 COVID-19 pandemic in California, plotted by age group, we can see some similarities and some key differences from the 1918 pandemic. By closing schools and telling older people to stay home in California, we’ve decreased the number of COVID-19 cases in both groups, effectively losing the left arm of the W and flattening out the right arm from the 1918 Influenza graph.
Thanks to early implementation in California of non-essential business closures, school closures, stay-at-home policies, social distancing, and use of masks, we’ve been able to avoid some of the hardships that folks experienced in the 1918 Influenza pandemic.
However, social distancing is not possible in schools–period. Getting children to wear masks safely and wash their hands with soap and warm water before touching their faces, their food, or their classmates is impossible. We won’t even go into how difficult it would be to keep student bathrooms sanitary. Moreover, large class sizes and inadequate ventilation systems (both of which are the norm in California public schools) are not conducive to safe social distancing. In order to make classrooms workable for social distancing, California schools would likely have to triple their teaching staffs, expand facilities, and spend millions of dollars updating air conditioning systems and adding HEPA filter systems. Furthermore, we’ve already been told that school budget cuts are inevitable at this point. Therefore, from our perspective, the only solution for safely educating our children during the next two years of this epidemic would be distance learning. Many school districts are currently surveying parents to collect their input on plans for the upcoming school year. Parents would be prudent to request that their districts offer distance learning for students of all ages.
Wear a Mask in Public
All people should wear masks in public at all times. There is very compelling scientific evidence that masks decrease the incidence of respiratory infections by preventing people’s respiratory droplets from circulating in shared air. We can see correlations between mandated mask-wearing policies and lower numbers of COVID-19 infections and deaths in countries across Asia like Japan, Vietnam, and Taiwan. There are certainly other factors in play that have helped these nations control the spread of COVID-19, like having more socially-distant ways of greeting people, better early education campaigns for COVID-19, prior experience with the SARS epidemic, increased travel restrictions, experimental pharmaceutical interventions (like Japan’s favipiravir) and better contact tracing. However, it’s worth noting that in some countries where most of these factors were not present, masks have been a game-changer, keeping cases and deaths relatively low. Take, for example, the Czech Republic, which mandated face masks in public in late March (along with closing borders, prohibiting public gatherings, and shuttering non-essential businesses). With a population of approximately 10 million, as of 5/23/20, Czechia (as it is also known) had 8,890 total reported cases of COVID-19 and just 314 total deaths. That’s 830 cases per million people and 29 deaths per million, and constitutes a death rate of about 3.5%. In Portugal, whose population is also around 10 million, masks in public were recommended but not required back in April. As of 5/23/20, Portugal had 30,471 total reported cases and 1,302 total deaths. That’s 2,987 cases per million people and 128 deaths per million, for a death rate of 4.3%. Even if we rewind to May 1, before Portugal began partially reopening businesses, we see it had a total of 24,987 cases and 1,007 deaths (death rate 4%), which is 2,450 cases per million and 99 deaths per million. Compare this to Czechia on May 1 with 7,737 total cases and 240 deaths (death rate 3.1%) That’s 722 cases per million and 22 deaths per million. This is not to say we think that mandated mask wearing is solely responsible for the differences in Portugal and Czechia’s numbers, but it certainly couldn’t hurt.
Avoid Gathering in Enclosed Spaces, Regardless of Restriction Easing
Biologist Erin Bromage from the University of Massachusetts Dartmouth makes some valid points about infection risk in her blog post published on May 6, which was inspired by Jonathan Kay’s April 23 piece in Quillette on COVID-19 superspreader events. We won’t go into detail on the specifics of superspreader events in our post today, but we do have a few things to say about what you can do to stay safe as cities begin to reopen selected businesses and public spaces.
The keys to preventing transmission of infection are personal protective equipment, washing hands with soap and warm water, and adequate ventilation. Unfortunately, most businesses and public buildings, like schools (see above), restaurants, bars, gyms, and salons (and even many doctor’s offices and hospitals) do not have the HEPA filtered air systems that are required to prevent the spread of COVID-19 and other viruses like influenza. Sanitizing surfaces, erecting barriers, setting up fans, and opening windows will not resolve the air issues in these locations. The reality is, there are few safe buildings when it comes to COVID-19.
So what are our recommendations for folks who are determined to dine out, get a haircut, join a yoga class, or attend a religious service as soon as their local governments allow it?
Small businesses need to rethink how they provide services to their patrons. Restaurants, rather than looking for ways to make poorly-ventilated indoor dining rooms safer, should be focused on offering outdoor dining. Hairdressers, barbers, and nail technicians should consider making use of their parking lots to provide their services in the open air, or performing services for their clients in their backyards. Gym owners, likewise, could look for opportunities to move classes outdoors.
Places of worship should continue to offer services online and should consider outdoor services, where people should wear masks and stay six feet apart. Drive-in services might also be possible for churches with large parking lots, leaving at least one parking space vacant between cars. Of course, some practices, like the distribution of wafers and grape juice or wine for communion, would remain high-risk, whether conducted indoors or outdoors. The bottom line is it’s not safe to be in a public place near people from outside your household who are eating, talking, or singing without wearing masks.
If you’re going to be around people from outside your household and have the choice to do so outdoors rather than indoors, outdoors would be a significantly safer choice. This is not to say that it’s prudent to have a large backyard barbecue or any large gathering of people outdoors. It’s still best to limit gatherings to no more than 10 people. Stick to video chatting with friends and family who have high risk for exposure to COVID-19 (like essential workers).
Monterey County
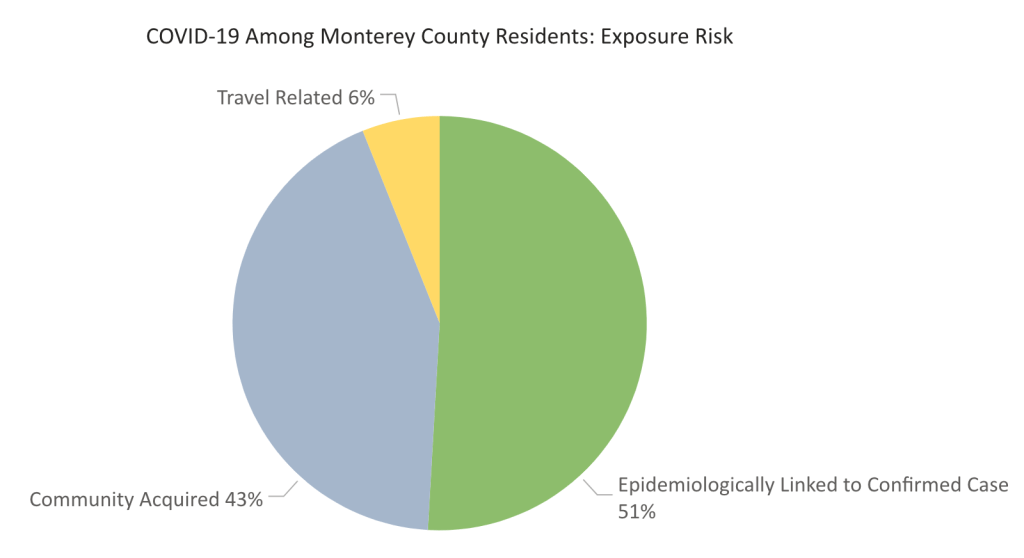
In Monterey County, 40% of the infections are in folks who work in agriculture and 9% of infections are in health care workers and first responders. In 210 (57%) of the cases, patients had no known pre-existing medical conditions. How are people getting infected? In Monterey County, 51% of reported cases are epidemiologically linked to a confirmed case, 43% of cases are community acquired, and 6% are travel-related. In theory, if a county is doing an excellent job of contact tracing, the percentage of community acquired cases would be very low–because cases would be quickly identified and folks could be quarantined before infecting others. The fact that 43% of the cases in our county are community acquired suggests we should be doing better case contact tracing and increase testing for everyone, but especially for essential workers, particularly those who come in close contact with the public. We ought to be testing all agricultural workers, health care workers, and first responders.
In California, the state public health department reports infections and deaths in skilled nursing facilities. It’s worth noting that since April 23, on any given day, only between 81% and 95% of California’s skilled nursing facilities have reported their COVID-19 cases and deaths to the state health department. On its website, California Department of Health lists data for COVID-19 infections and deaths for 16 of Monterey County’s skilled nursing facilities. Based on this data, one 103-bed facility, Windsor The Ridge Rehabilitation Center in Salinas (zip code 93906) has reported cases in health care workers and patients. They are also listed as having patient deaths. Because the state of California does not report specific numbers of deaths and cases in skilled nursing facilities unless the number is greater than 11, we do not know how many of the cases and deaths in our county are associated with this facility–the report says fewer than 11. We also reviewed the California Department of Health skilled nursing COVID-19 data base (May11, 2020) and found a total of nine Windsor facilities in California with COVID-19 cases. The site with the most infections was in Solano County where 25 healthcare workers and 60 patients were infected with fewer than 11 deaths. The Monterey County Health Department has not disclosed the number of cases or deaths in the Salinas skilled nursing facility in our county. This data should be made available to the public. In addition, if it has not already been done, all staff and patients at this facility should be tested for COVID-19 by PCR on a routine basis. The state of New York has mandated that each nursing home will test each healthcare provider twice a week for COVID-19. This seems a reasonable approach to any facility with any healthcare provider or patient infection. A more proactive approach would be to test all healthcare providers and patients in skilled nursing facilities.
Our Updated COVID-19 Projections
The University of Washington’s Institute of Health Metrics (IHME) said on 4/28/20 that we would have a total of 74,000 deaths in the USA by August 5, 2020. In contrast to this, we analyzed the case and death data using our two methods again on 5/22/20. We estimated that we will reach 2,000,000 infected patients by June 7th (in 15.4 days, 369 hours or 2.2 weeks) and have between 17,710 and 20,513 new deaths for a total number of deaths between 115,357 and 118,156.
All of our predictions from 4/28/20, 5/03/20, 5/08/20 and 5/22/20 for time to reach 2,000,000 infections and the estimate of the number of deaths are listed in the following chart:
We don’t usually project out 2 months for total infections and deaths, but if we did, using our methodologies, we would predictthat by August 4, 2020 in the United States we will have 3,337,190 COVID-19 infected patients and a total of between 192,613 and 199,229 deaths. If the death rate (now 5.94%)increases, these estimates of the number of deaths will be too low.
On 5/01/20, the FDA finally approved Gilead’s Remdesivir for intravenous treatment of COVID-19 infected patients. Since we initially recommended approval of this drug, another 97,600 Americans have died. Gilead is donating a large amount of drug for free. Unfortunately, it now appears that the government will be involved in the distribution of the drug, which means that university medical centers, hospitals in rural counties, and outpatient clinics like ours will probably not have the opportunity to treat our patients with Remdesivir. If it were up to us, this drug would be sold through normal drug distribution channels. Hopefully use of Remdesivir and/or plasma therapy will alter reported deaths in the next two months. We’re not optimistic based on the United States government’s performance during the first 145 days of the COVID-19 pandemic.
We have no effective available oral treatment or preventative drugs, vaccines or hyperimmune intravenous immunoglobulin for COVID-19. Potential therapies are probably 6 to 9 months away. In the United States our political leaders (the President and most Governors) and federal agencies (HHS, CDC) and many state public health officials have decided to open back up our country. Viruses (COVID-19, Influenza and perhaps measles) will have many more potential victims this year.


You must be logged in to post a comment.