COVID-19

SARS-CoV-2 Update 1/14/23

In 2022, multiple new Omicron variants BA.1, BA.2, BA.4, and BA.5 assaulted the world’s population of humans and other animals. By the time multiple companies made and tested Omicron BA.1 vaccines, BA.1 was no longer the dominant variant; in fact, it was no longer present. On August 31, 2022, the FDA allowed rapid introduction of an Omicron BA.5 bivalent vaccine. However, this has had no effect on new immune evading BQ variants. In December the first highly infectious recombinant variant, XBB, began spreading around the world. An additional variant, XBB.1.5, is now rapidly spreading across the country and the world causing increased numbers of hospitalizations and critically ill patients in the USA. A new variant, CH.1.1 (BA.2.75.3.4.1.1.1.1) caused 5.9% of infections in the world from December 25 to January 14, 2023 and, from December 26 to January 1, 19.5% of infections in the United Kingdom. 

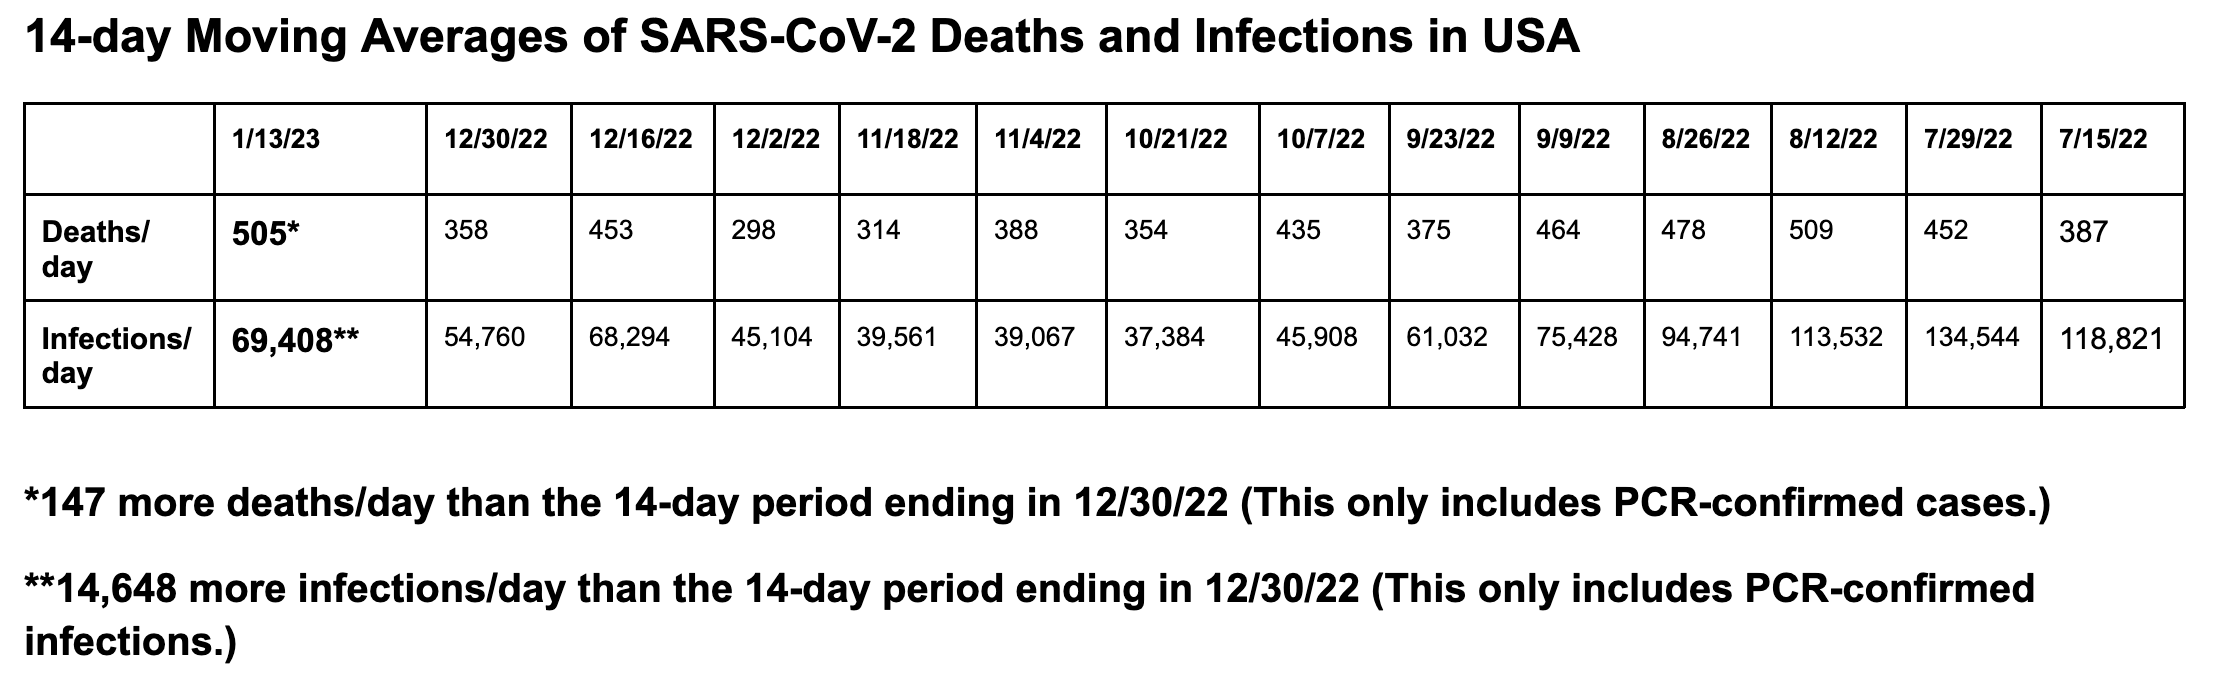
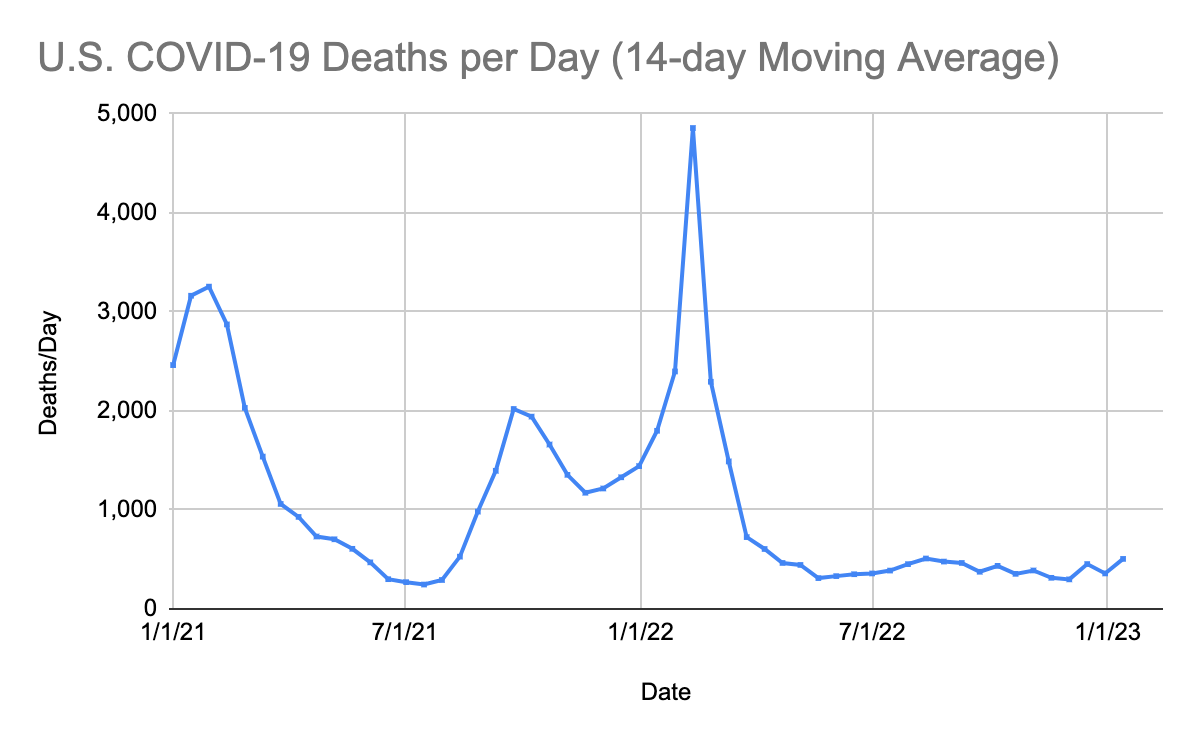
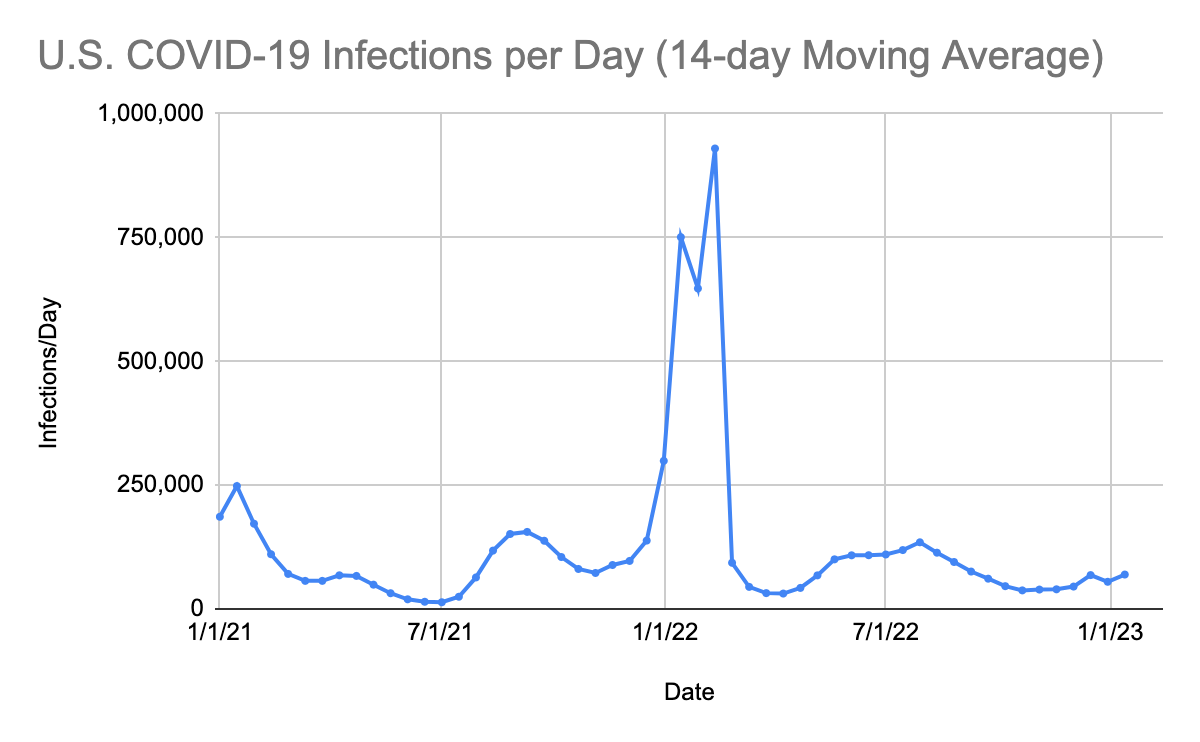
On January 13, the World Health Organization (WHO) updated its recommendations on mask wearing to specify that, given the global spread of COVID-19, masks should be worn “irrespective of the local epidemiological situation,” meaning that masks are now recommended for everyone, not just people in areas with high levels of transmission. Here are our 14-day moving average determinations for SARS-CoV-2 for the United States. We use the WORLDOMETERS aggregators data set to make any projections since it includes data from the Department of Veterans Affairs, the U.S. Military, federal prisons and the Navajo Nation.

XBB.1.5 Variant Continues to Dominate

During the week ending in 1/14/22, the CDC estimates that based on genomic surveillance, XBB.1.5 accounted for 43% of infections, followed by BQ.1.1 at 28.8%, BQ.1 at 15.9%, XBB at 3.9%, BA.5 at 2.6%, BN.1 at 2.1%, BF.7 at 1.4%, and BA.2.75 at 1.3%. The remaining variants made up less than 1% each: BA.5.2.6 (0.5%), BA.2 (0.2%), BF.11 (0.2%), BA.4.6 (0.1%), and BA.2.75.2 (0.1%). We are keeping our eye on BA.2.75, as the CDC is likely lumping in its descendant, CH.1, and its subvariants under this label. 

CDC

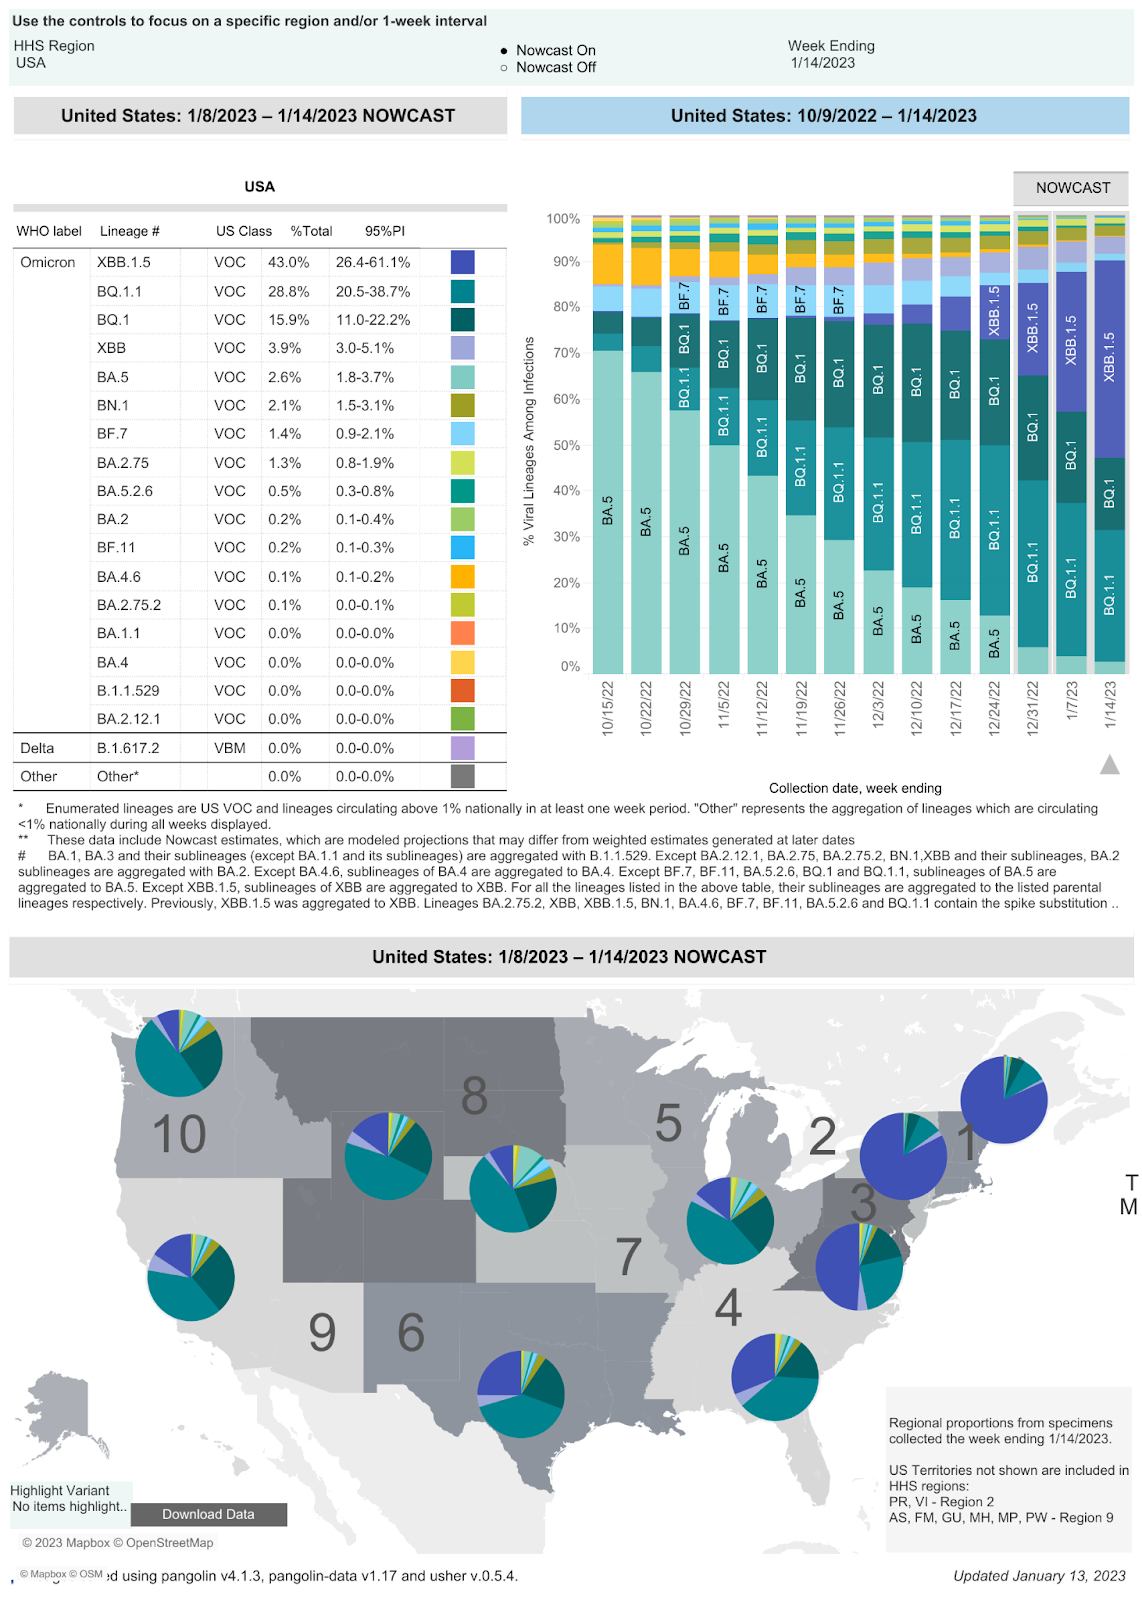
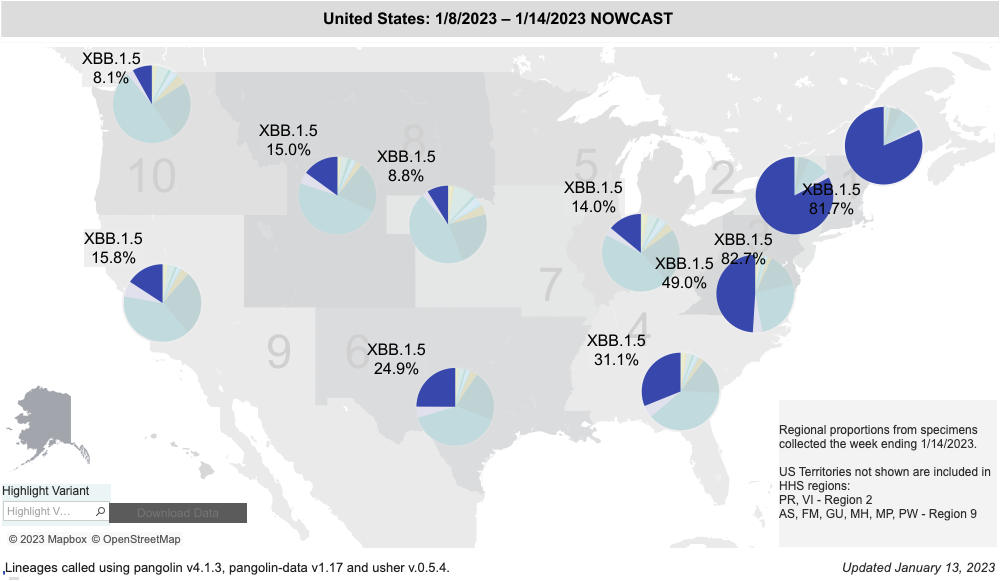
BQ.1.1 has five spike mutations that are different from BA.5. Four of these mutations allow escape from immunity from monoclonal antibodies, any prior infection (including Omicron BA.5), or any vaccine to include the bivalent Omicron BA.5 vaccine. Infections are still occurring in our clinic in patients that received the Omicron BA.5 bivalent vaccine. The XBB recombinant isolate XBB.1.5  has rapidly become the dominant infection in the USA. It took 28 days to become the cause of 40% of infections in the USA. As of 1/14/23, XBB.1.5 now causes over 80% of infections in Regions 1 and 2. 

The “Omicron family feud” is a phrase coined by Dr. Raj Rajnarayanan to describe what’s going on between the Omicron BQ variants, BQ.1, BQ,1.1 (and other BQ variants) and XBB.1.5 (and other XBB variants). In the USA in regions 1 and 2, XBB.1.5 has won the feud. A new variant of BA2.75, CH.1.1, is now 4.9% of SARS-CoV-2 isolates in the world. It has the Delta mutation, P681R, which should raise a red flag. According to Saito et al, the P681R mutation, “facilitates cleavage of the spike protein and enhances viral fusogenicity [the ability of the virus to fuse to human cell membranes]….and pathogenicity [lethality].”  

XBB.1.5 Proportion of Sequenced Isolates in the USA

12/3/2212/10/2212/17/2212/24/2212/31/221/7/231/14/23
2.3%4.4%7.4%11.8%20.1%30.4%43.0%

BQ. 1 and BQ.1.1 Totaled Proportion of Sequenced Isolates in the USA

12/3/2212/10/2212/17/2212/24/2212/31/221/7/231/14/23
53.5%57.4%58.6%60.3%59.2%53.2%44.7%

Percent of isolates identified as XBB.1.5 by Region

Region
Week ending in12345678910
12/31/2275.3%72.2%32.7%19.0%6.0%21.5%8.1%2.1%9.2%2.5%
1/14/2381.7%82.7%49.0%31.1%14%24.9%8.8%15%15.8%8.1%
CDC

SARS-CoV-2 infections per day in the United States have increased for the second time in 6 weeks. There is still widespread underreporting by states, a failure to capture all positive home tests, and a decreased PCR screening program in most states. Deaths per day in the United States have increased by 147 deaths per day. Many states are not reporting deaths or infections in a timely manner. The number of infections per day is expected to increase in the next four weeks due to a lack of mask use in schools, businesses, and airports; a failure of adequate building ventilation; lack of social distancing; and low rates of bivalent booster uptake. XBB, an Omicron recombinant variant first identified in India, caused a major outbreak in Singapore. XBB is the first recombinant variant combining spike protein sequences from two other Omicron BA.2 variants, that has spread aggressively around the world. New mutations of XBB, specifically XBB.1.5 are rapidly crowding out other variants in the USA. Current vaccines, monoclonal antibodies and prior infections will not protect you from getting an XBB.1.5 infection. A more detailed description of XBB variant mutations and epidemiology can be found on page 17 of the UK Health Security Agency Technical Briefing from November 25

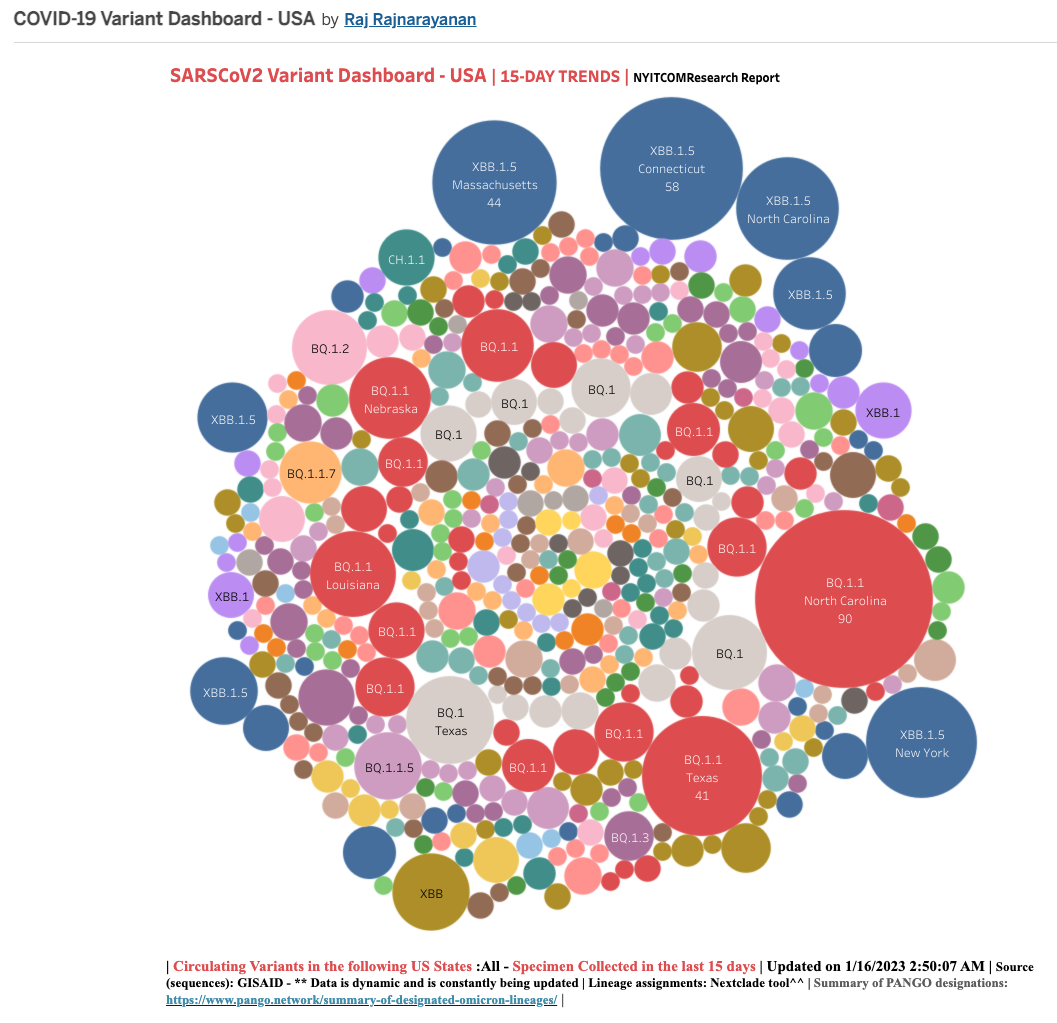
For a more detailed picture of COVID variant evolution in the United States, we recommend checking out the dashboard put together by Raj Rajnarayanan, Assistant Dean of Research and Associate Professor at NYITCOM at Arkansas State University. 

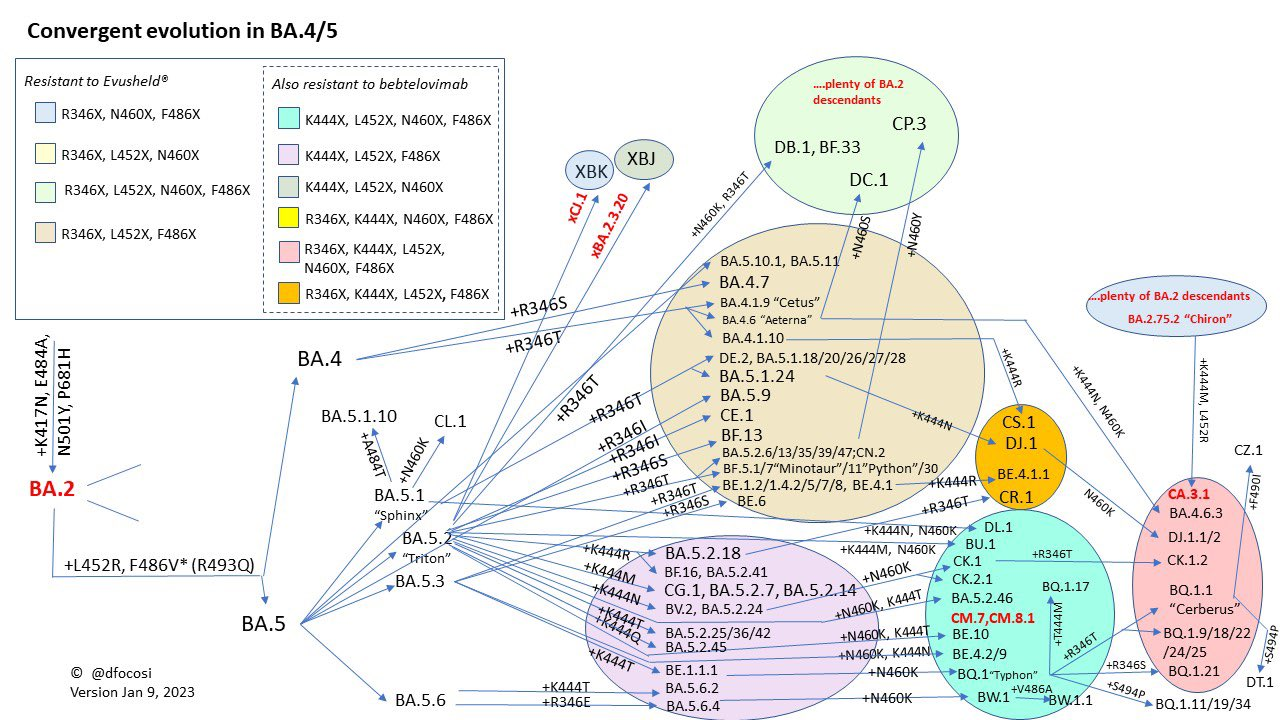
To understand the true impact of these variants, it’s helpful to examine their evolution. Two virologists collaborated on Twitter to create the figure below, which Professor Johnson titled “Convergent Evolution on Steroids.”  It shows the key mutations present in many of the currently-circulating Omicron subvariants and demonstrates that mutation at site 346 is becoming more and more common. 

From Daniele Focosi, M.D., Ph.D. @dfocosi on Twitter, January 9, 2023

Past infections with a BA.1, BA.2 or BA.5 variants will not prevent infections with any of the newer variants. Monoclonal antibodies are no longer effective against newer BQ variants, XBB variants and other spike protein mutated variants. The last remaining monoclonal antibody, bebtelovimab, was removed from use by the FDA on 12/2/22. Paxlovid was only 89% effective in the original clinical trials against SARS-CoV-2. If resistance develops this winter to oral Paxlovid, we will have more Paxlovid failures and increased hospitalizations and deaths.

A Deeper Dive into U.S. COVID Data

On 1/13/23, the United States had 19,397 documented new infections. There were also 193 deaths. Thirty-seven states did not report their infections, and 37 states didn’t report their deaths. In the United States on 1/13/23 the number of hospitalized patients (44,806)  has increased  (+10.98% compared to the previous 14 days) and was 40,374 on December 30. On 1/13/22 there were 5,449 patients who were seriously or critically ill (a 6.1% increase); that number was 5,135 two weeks ago. The number of critically ill patients has increased by 315 in the last 14 days, while at least 7,064 new deaths occurred. The number of critically ill patients has increased for the 11th time in thirty-five 14-day periods. Patients are still dying each day (average 505/day). 

As of 1/13/23, we have had 1,125,020 deaths and 103,482,187 SARS-CoV-2 infections in the United States. We have had 971,709 new infections in the last 14 days. We are adding an average of 485,855 new infections every seven days. For the pandemic in the United States we are averaging one death for every 91.98 infections or over 10,872 deaths for each one million infections. As of 1/13/22, thirty-nine states have had greater than 500,000 total infections, and 38 states and Puerto Rico have had greater than 5,000 total deaths. Forty-six states have had greater than 2,000 deaths, and 33 states have greater than 3,000 deaths per million population. Nine states have over 4,000 deaths per million population: Mississippi (4,406), Arizona (4,465), Alabama (4,246), West Virginia (4,340), New Mexico (4,240), Tennessee (4,186), Arkansas (4,225), Michigan (4,105) and New Jersey (4,016). Eighteen states (Alabama, Virginia, Missouri, North Carolina, Indiana, Tennessee, Massachusetts, Ohio, Michigan, Georgia, Illinois, New Jersey, Pennsylvania, Florida, Texas, New York, Arizona and California) have had greater than 20,000 deaths. Nine states have had greater than 40,000 deaths: Florida (84,170 deaths), Texas (92,600 deaths), New York (75,909 deaths), Pennsylvania (49,263 deaths), Georgia (41,648 deaths), Ohio (41,001 deaths) , Illinois (40,678 deaths), Michigan (41,001), and  California (98,954 deaths, 20th most deaths in the world). 

On 11/20/20, there were 260,331 (cumulative) deaths in the US from SARS-CoV-2. Since 11/20/20 (26 months), there were 857,919 new deaths from SARS-CoV-2. For twenty-two of those months, vaccines have been available to all adults. During these twenty-two months, 552,821 people have died of SARS-CoV-2 infections. Clearly, a vaccine-only approach is not working anywhere, especially not in the United States. In addition to getting more people vaccinated, most of the hospitalizations and deaths could have been prevented by proper masking (N95 or better), social distancing, and treatment with oral antiviral agents like Paxlovid. We recommend all of these precautions and treatments to every patient in our clinic, and we have only lost one patient to COVID in 2.5 years. 

As of 1/13/23, California was ranked 32nd in the USA in infection percentage at 29.99%. In California, 26.02% of the people were infected in the last 22 months. As of 1/13/23, 31 states have had greater than 30% of their population infected. Fifty states, the District of Columbia and Puerto Rico have greater than 20% of their population infected.                   

FDA-Approved Oral Drug Treatments for SARS-CoV-2

Pfizer has developed PAXLOVID™, an oral reversible inhibitor of C3-like protease of SARS-CoV-2. The drug inhibits this key enzyme that is crucial for virus production. The compound, also called Compound 6 (PF-07321332), is part of the drug combination PAXLOVID™ (PF-07321332; ritonavir), which successfully completed a Phase 2-3 trial in humans in multiple countries. The preliminary results were announced on 11/5/21 by Pfizer. The results showed that 89% of the hospitalizations and deaths were prevented in the drug treatment arm. The drug was administered twice a day for five days. No deaths occurred in the treatment group, and ten deaths occurred in the placebo group. The study was stopped by an independent data safety monitoring board, and the FDA concurred with this decision. Pfizer applied for an Emergency Use Authorization for this drug on 11/15/21. This drug was approved on 12/23/21. PAXLOVID™ one year later is widely available at major pharmaceutical chains and smaller independent drug stores throughout the USA. We have  been able to obtain PAXLOVID™ for any patient desiring treatment. We have only had one  drug failure and death from SARS-CoV-2 during 2022. That death occurred in an octogenarian male in the fourth quarter of 2022.

Watching World Data

Over the next few months, we’ll be paying close attention to correlations between the SARS-CoV-2 data, the number of isolates identified in various countries and states, and the non-pharmaceutical interventions (like mask mandates and lockdowns) put in place by state and national governments. Data on infections, deaths, and percent of population infected was compiled from Worldometers. Data for this table for SARS-CoV-2 Isolates Currently Known in Location was compiled from GISAID and the CDC. It’s worth noting that GISAID provided more data than the CDC.

LocationTotal Infections as of 1/13/23New Infections on 1/13/23Total DeathsNew Deaths on 1/13/23% of Pop.InfectedSARS-CoV-2 Isolates Currently Known in LocationNational/ State Mask MandateCurrently in Lockdown
World670,816,950319,9876,728,2701,6078.60%B2 lineageAlpha/B.1.1.7 (UK)Eta/B.1.525 (Nigeria/UK)Iota/B.1.526 (USA-NYC)Beta/B.1.351 (SA)Epsilon/B.1.427 + B.1.429 (USA)*Gamma/P.1 (Brazil)Zeta/P.2 (Brazil)A lineage isolateV01.V2 (Tanzania)APTK India VOC 32421Delta/B.1.617.2 (India)BV-1 (Texas, USA)Kappa/B.1.617.1 (India)Lambda/C.37 (Peru)Theta/P.3 (Philippines) Mu/B.1.621 (Colombia)C.1.2 (South Africa 2% of isolates in July 2021)R1 (Japan)Omicron/B.1.1.529 + BA.1 + BA.2 + BA.3 (South Africa November 2021)B.1.640.1 (Congo/France)B.1.640.2 (Cameroon/France)Four new recombinants 12/31 to 3/22)BA.2.12.1 (USA)BA.4 (South Africa)BA.5 (South Africa)BA.2.75 (India 7/22)BA.4.6 (USA 7/22)BF.7BJ.1XBBBQ.1BQ.1.1BS.1BN.1  NoNo
USA103,482,187 (ranked #1)
19,397 (ranked #5)
37 states and D,C. failed to report infections on 12/2/22.
1,125,020 (ranked #1) 193
37 states  and D.C. failed to report deaths on 1/13/23.
30.90%
B2 lineageAlpha/B.1.1.7 (UK)Eta/B.1.525 (Nigeria/UK)Iota/B.1.526 (USA-NYC)Beta/B.1.351 (SA)Epsilon/B.1.427 + B.1.429 (USA)*Gamma/P.1 (Brazil)Zeta/P.2 (Brazil)Delta/B.1.617.2 (India)BV-1 (Texas, USA)Theta/P.3 (Philippines) Theta/P.3 (Philippines) Kappa/B.1.617.1 (India)Lambda/C.37 (Peru)Mu/B.1.621 (Colombia)R1(Japan)         Omicron/B.1.1.529 + BA.1 + BA.2 (South Africa November 2021)B.1.640.1 (Congo/France)Recombinant Delta AY.119.2- Omicron BA.1.1 (Tennessee, USA 12/31/21)\BA.2BA.2.12.1 (United States)BA.4 (South Africa 11/21)BA.5 (South Africa 11/21)BA.2.75 (India 7/22)BA.4.6 (USA 7/22)BQ.1BQ.1.1BN.1NoNo
Brazil36,623,217(ranked #5) 20,548 (ranked#4)695,334 (ranked #2)7917.00%B2 lineageAlpha/B.1.1.7 (UK)Beta/B.1.351 (SA)Gamma/P.1 (Brazil)Zeta/P.2 (Brazil)Lambda/C.37 (Peru)Mu/B.1.621 (Colombia) Omicron/B.1.1.529 + BA.1 (South Africa November 2021)BA.2BA.2.12.1 (United States)BA.4 (South Africa 11/21)BA.5 (South Africa 11/21)NoNo
India 44,681,884 (ranked #2)
530,726(ranked #3) 3.17%
Unchanged in 4 weeks
B2 lineageAlpha/B.1.1.7 (UK)Beta/B.1.351 (SA)Gamma/P.1 (Brazil)Epsilon/B.1.427 + B.1.429 (USA)*Eta/B.1.525 (Nigeria/UK)APTK India VOI 32421Delta/B.1.617.2 (India)Kappa/B.1.617.1 (India)Iota/B.1.526 (USA-NYC) Omicron/B.1.1.529 + BA.1 (South Africa November 2021)B.1.640.1 (Congo/France)BA.4 (South Africa 11/21)BA.5 (South Africa 11/21)BA.2.75 (India)NoNo
United Kingdom
24,243,576 (ranked #9)202,157 (ranked #7) 470 new deaths in 2 weeks35.39%B2 lineageAlpha/B.1.1.7 (UK)Eta/B.1.525 (Nigeria/UK)Beta/B.1.351 (SA)Epsilon/B.1.427 + B.1.429 (USA)*Gamma/P.1 (Brazil)Delta/B.1.617.2 (India)Theta/P.3 (Philippines) Kappa/B.1.617.1 (India)Lambda/C.37 (Peru)Mu/B.1.621 (Colombia)C.1.2 (South Africa)Omicron/B.1.1.529 + BA.1 (South Africa November 2021)B.1.640.1 (Congo/France)XD (AY.4/BA.1) recombinantXF (Delta/BA.1) recombinantXE (BA.1/BA.2) recombinantBA.2BA.2.12.1 (United States)BA.4 (South Africa 11/21)BA.5 (South Africa 11/21)BA.2.75 (India 7/22)NoNo
California, USA11,852,546 (ranked #13 in the world)1,51698,954 (ranked #20 in world)
2529.99%B2 lineageAlpha/B.1.1.7 (UK)Eta/B.1.525 (Nigeria/UK)Beta/B.1.351 (SA)Gamma/P.1 (Brazil)Epsilon/B.1.427 + B.1.429 (USA)*Zeta/P.2 (Brazil)Delta/B.1.617.2 (India)Theta/P.3 (Philippines) Kappa/B.1.617.1 (India)Lambda/C.37 (Peru) Mu/B.1.621 (Colombia) Omicron/B.1.1.529 + BA.1 (South Africa November 2021)BA.2BA.2.12.1 (United States)BA.4 (South Africa 11/21)BA.5 (South Africa 11/21)BA.2.75 (India 7/22)BQ.1BQ.1.1BN.1NoNo
Mexico7,303,600 (ranked #19) 5,686 (ranked #11)331,452(ranked #5)455.55%NoNo
South Africa4,051,243 (ranked #37; 4,347 new infections in 14 days).183102,568 (ranked #18) 0 new deaths in 14 days)
Unchanged in 4 weeks
6.66%


Unchanged in 4 weeks
B2 lineageAlpha/B.1.1.7 (UK)Beta/B.1.351 (SA)Delta/B.1.617.2 (India)Kappa/B.1.617.1 (India)       C.1.2 (South Africa, July 2021)Omicron/B.1.1.529 + BA.1 (South Africa November 2021)B.1.640.1 (Congo/France)BA.2BA.4 (South Africa 11/21)BA.5 (South Africa 11/21)NoNo
Canada4,508275 (ranked #34)49,566 (ranked #24 ) 11.74% NoNo
Poland6,732,901 (ranked #21)324118,640 (ranked #15) 87 new deaths in the last 14 days716.88%B2 lineageAlpha/B.1.1.7 (UK)Eta/B.1.525 (Nigeria/UK)Beta/B.1.351 (SA)Delta/B.1.617.2 (India)Mu/B.1.621 (Colombia)Omicron/B.1.1.529 + BA.1 + (South Africa November 2021),Omicron/B.1.1.529 +BA.3 NoNo
Russia21,846,722 (ranked #10)5,978 (ranked #12)394,209(ranked #4)4714.98%NoNo
Peru4,473,821(ranked #35)627 218,490(ranked #6) 1313.28%B2 lineageAlpha/B.1.1.7 (UK)Delta/B.1.617.2 (India)Gamma/P.1 (Brazil)Iota/B.1.526 (USA-NYC)Lambda/C.37 (Peru)Mu/B.1.621 (Colombia)Omicron/B.1.1.529 + BA.1 (South Africa November 2021)NoNo
Iran7,562,446 (ranked #18)75144,723 (ranked #12) 18.78%
Unchanged in 4 weeks
B2 lineageAlpha/B.1.1.7 (UK)Delta/B.1.617.2 (India)Beta/B.1.351 (SA)Omicron/B.1.1.529 + BA.1 (South Africa November 2021)NoNo
Spain13,711,251 (ranked #12)9,871 (ranked #7)117,759 (ranked #16) new deaths in 14 days7629.34%B2 lineageAlpha/B.1.1.7 (UK)Delta/B.1.617.2 (India)Beta/B.1.351 (SA)Gamma/P.1 (Brazil)Epsilon/B.1.427 + B.1.429 (USA)*Eta/B.1.525 (Nigeria/UK)Iota/B.1.526 (USA-NYC)Kappa/B.1.617.1 (India)Mu/B.1.621 (Colombia)Omicron/B.1.1.529 + BA.1 (South Africa November 2021)B.1.640.1 (Congo/France)NoNo
France39,442,176 (ranked #3)6,238 (ranked #9)163,347 (ranked #10)10160.13% B2 lineageAlpha/B.1.1.7 (UK)Delta/B.1.617.2 (India) Omicron/B.1.1.529 South Africa November 2021)B.1.640.1 (Congo/France)B.1.640.2 (Cameroon/France)GKA (AY.4/BA.1) recombinantBQ.1.1NoNo
Germany37,605,135 (ranked #4)10,609 (ranked #6)163,775 (ranked #9)15044.83%
B2 lineageAlpha/B.1.1.7 (UK)Delta/B.1.617.2 (India) Delta/B.1.617.2 (India) Omicron/B.1.1.529 South Africa November 2021)GKA (AY.4/BA.1) recombinantBQ.1.1NoNo
South Korea29,737,769 (ranked #7)39,726 (ranked #2)32,867 (ranked #34) 6657.93%B2 lineageAlpha/B.1.1.7 (UK)Delta/B.1.617.2 (India) Delta/B.1.617.2 (India) Omicron/B.1.1.529 South Africa November 2021)NoNo
Vietnam11,526,089 (ranked #13)5543,186(ranked #26)11.64%
Unchanged in 4 weeks
B2 lineageAlpha/B.1.1.7 (UK)Delta/B.1.617.2 (India) Delta/B.1.617.2 (India) Omicron/B.1.1.529 South Africa November 2021),No
Netherlands8,576,523 (ranked #17)22,989 (ranked #41)49.83%B2 lineageAlpha/B.1.1.7 (UK)Delta/B.1.617.2 (India) Delta/B.1.617.2 (India) Omicron/B.1.1.529 South Africa November 2021)GKA (AY.4/BA.1) recombinantNoNo
Denmark3,171,515 (ranked #40)  1907,982 (ranked #76)1154.35%B2 lineageAlpha/B.1.1.7 (UK)Delta/B.1.617.2 (India) Delta/B.1.617.2 (India) Omicron/B.1.1.529 South Africa November 2021)GKA (AY.4/BA.1) recombinantNoNo


Taiwan9,167,795 (ranked #16)21,721 (ranked #3)15,755 (ranked #56)
5338.37%
B2 lineageAlpha/B.1.1.7 (UK)Delta/B.1.617.2 (India) Delta/B.1.617.2 (India) Omicron/B.1.1.529 South Africa November 2021)NoNo
Japan31,176,281(ranked #6)144,077 (ranked #1)61,761(ranked #23)
48024.82%
14 days.
B2 lineageAlpha/B.1.1.7 (UK)Delta/B.1.617.2 (India) Delta/B.1.617.2 (India) Omicron/B.1.1.529 South Africa November 2021)BA.2*BA.5*NoNo
Argentina10,004,679 (ranked #15)130,249(ranked #14)21.74%NoNo
Italy25,363,742 (ranked #8) 185,993(ranked #8) 42.08%
NoNo
Chile5,081,862 (ranked #27)3,289 (ranked#14)63,466(ranked #22) 
2926.39%
NoNo
Colombia6,349,971 (ranked #22) 142,259(ranked #13)12.32%
NoNo
Australia11,247,412 (ranked #14) 5,985 (ranked #10)17,712(ranked #50) 5943.14% 
NoNo
Turkey17,042,722 (ranked #11)101,492 (ranked #19)   19.91%
Unchanged in 4 weeks
NoNo


Indonesia6,725,458 (ranked #20)363160,719 (ranked #11)   478 new deaths in the last 14 days.824.09%NoNo
Malaysia5,032,146 (ranked #28) 32036,908 (ranked #29) 315.16%NoNo


Hong Kong2,817,707(ranked#41) 8,260 (ranked #8)12,693 (ranked#60) 345 new deaths in the last 14 days.7137.05%
NoNo
China503,302 (ranked #91)

What Our Team Is Reading This Week

COVID-19

SARS-CoV-2 Update

It’s time for our next 14-day moving average determinations for SARS-CoV-2 for the United States and my thoughts on vaccines and mutant viruses. We use the WORLDOMETERS aggregators data set to make any projections since it includes data from the Department of Veterans Affairs, the U.S. Military, federal prisons and the Navajo Nation.

In the United States, SARS-CoV-2 deaths have increased for the first time in five 14-day periods. There were 43 more deaths per day than in the last 14-day period. In the last 14 days, the number of infections has increased by 8,237 infections per day compared to the preceding 14-day period. Our infections per day have increased for the second time over the last 12 weeks. With travel and multiple holidays and events occurring in the next 60 days, I expect the infections to continue to increase. Unless people get vaccinated and get their third dose of the vaccine we will see further spread of Delta variants like AY4.2 and an increase in deaths particularly in people with risk factors and over the age of 55. Anyone over the age of 5 years can now get vaccinated in the United States at no cost. This should get done immediately. 

A new variant, B.1.1.529 (Omicron), was first seen in South Africa on 11/8/21 with multiple new mutations, deletions and an insertion that is causing a doubling of new infections every 1.3 days in Gauteng, South Africa. In just 26 days, as of 12/03/21, Omicron has been found in 42 countries and 12 states in the United States. Unlike Delta variants in South Africa, Omicron is infecting and hospitalizing patients in all age groups but particularly children under five years of age and adults greater than 60 years of age. Increased vaccinations, vaccines against new mutants, drugs against 3C-like protease, increased mask usage and social distancing, which are part of the Biden SARS-CoV-2 plan, are all necessary to continue to stop further spread of mutants and reduce infections, hospitalizations, and deaths. The Delta variants still account for 99% of new infections in the United States. On 12/03/21, the United States had 147,434 new infections with one state failing to report (Iowa). There were also 1,352 deaths (with six other states failing to report deaths). Florida continues to consistently under-report daily infections and deaths. The number of hospitalized patients had been decreasing in many areas but now 13,714 patients are seriously or critically ill; that number was 11,767 two weeks ago. The number of critically ill patients has increased by 1,947 in the last 14 days, while at least 17,018 new deaths occurred. The number of critically ill patients has increased for the second time in eleven 14-day periods and a large number of patients are still dying each day (average 1,216/day). 

As of 12/03/21, we have had 808,116 deaths and 49,378,049 SARS-CoV-2 infections in the United States. We have had 1,356,453 new infections in the last 14 days. We are adding an average of 678,227 infections every seven days. For the pandemic in the United States we are averaging one death for every 60.4 infections reported or over 16,533 deaths for each one million infections. As of 12/03/21, thirty-one states have had greater than 500,000 total infections, and 35 states have had greater than 5,000 total deaths. Eleven states (Ohio, Michigan, Georgia, Illinois, New Jersey, Pennsylvania, Florida, Texas, New York, Arizona and California) have had greater than 20,000 deaths. Four states (Florida, Texas, New York, and California) have had greater than 50,000 deaths. 

On 11/20/20 in the United States, 3.70% of the population had a documented SARS-CoV-2 infection. California was ranked 41st in infection percentage at 2.77%. In North Dakota 9.18% of the population was infected (ranked #1), and in South Dakota 8.03% of the population was infected (ranked #2). As of 12/03/21, in the United States, 14.94% of the population has had a documented SARS-CoV-2 infection. In the last 12.5 months, over 11% of our country became infected with SARS-CoV-2. On 11/20/20, there were 260,331 (cumulative) deaths in the US from SARS-CoV-2. In the last 12 months, there were 547,885 new deaths from SARS-CoV-2. For nearly nine of those months, vaccines have been available to all adults. During these nine months, 203,345 people have died of SARS-CoV-2 infections. Many of these hospitalizations and deaths could have been prevented by vaccination, proper masking, and social distancing. 

As of 12/03/21, California was ranked 41st in infection percentage at 12.50% and 9.74% of Californians were infected in the last 12 months. And now let’s look at the top 26 infected states (all greater than 16%, which is not a list that you’d like to be on in 2021. North Dakota was at 21.53% (ranked #1), Alaska was at 20.03% (ranked #2), Tennessee was at 19.37% (ranked #3), Wyoming 19.37% (ranked #4),  South Dakota was at 19.02% (ranked #5), Utah at 18.77% (ranked #6), South Carolina was at 17.90% (ranked #10), Rhode Island was at 18.39% (ranked #7), Montana was at 17.98% (ranked #9), Iowa was at 18.08% (ranked #8), Florida was at 17.43% (ranked #14), Arkansas was at 17.63% (ranked #12),  Kentucky was at 17.79% (ranked #11), Alabama was at 17.28% (ranked #16), Mississippi was at 17.32% (ranked #15), Idaho was at 17.27% (ranked #17), Arizona was at 17.43% (ranked #13) Oklahoma was at 16.94% (ranked #19), Louisiana was at 16.622% (ranked #21), Wisconsin was at 17.13% (ranked #18),  West Virginia was at 16.66% (ranked #20), Indiana was at 16.61% (ranked#22), Kansas was at 16.28%(ranked #23), Minnesota was at 16.24% (ranked#25) and Nebraska at 16.22% of the population infected (ranked #2). Forty-two states now have greater than 12% of their population infected. Only one state has less than 7% of their population infected: Hawaii (6.21%). Hawaii, Vermont, and the US Virgin Islands still remain the safest places in the United States. Although Hawaii has just had its first patient with an Omicron (B.1.1.529) SARS-CoV-2 infection. 

The table below shows that if we rank the US states with the highest death rates per million population within the world rankings, we see that Mississippi has the sixth highest COVID-19 deaths per million in the world. Alabama, New Jersey and Louisiana would be tied at the 7th highest number of deaths per million in the world, followed by  Arizona, NewYork tied at 9th, Florida at 11th, Arkansas, Massachusetts and Rhode Island tied at 12th. The United States as a whole ranks 20th in the world for deaths per million population (2,390 deaths per million). California ranks 35th in the USA (and 36th in the world). If we look at the death rates per million in South Korea (73), Iceland (102), Japan (146), and Israel (879), they suggest that treatment outcomes are somehow different in these four countries. The same phenomenon can be seen in Scandinavia, where the death rate in Sweden is 1,486 per million, compared to 199 per million in Norway and 245 per million in Finland. The United States should take a closer look at how countries with low death rates (like South Korea, Iceland, Japan, Finland, and Norway) are preventing COVID-19 infections and treating COVID-19 patients. 

State or Country COVID-19 Deaths per million populationRank in USARanked within World
Mississippi3,460    1st6th
New Jersey  3,2013rd7th tied
Louisiana3,1894th7th tied
New York 2,9946th9th tied
Alabama3,2982nd7th tied
Arizona3,0775th9th 
Massachusetts2,82811th12th tied
Rhode Island  2,776   12th12th tied
Arkansas2,883 8th12th tied
Florida2,8709th11th
California1,898 35th35th
USA2,42120th
Peru5,9881st
Bosnia-Herzegovina  3,9023rd
North Macedonia  3,6965th
Hungary3,6496th
Montenegro3,6964th
Bulgaria4,1852nd
Gibraltar2,94010th
Czechia3,1227th
Brazil2,86611th
San Marino2,73312th
Georgia3,0818th
Sweden1,48656th
Israel87986th
Canada77894th
Finland245136th
Norway199141st
Japan146153rd
Iceland102163rd
South Korea73169th
Data from Worldometers

A New Drug for SARS-CoV-2 Treatment

Pfizer has developed a reversible inhibitor of C3-like protease of SARS-CoV-2. The drug inhibits this key enzyme that is crucial for virus production. The compound, called Compound 6, is part of the drug combination PAXLOVID™ (PF-07321332; ritonavir), which just successfully completed a Phase 2-3 trial in humans in multiple countries. The preliminary results were announced on 11/5/21 by Pfizer. The results show that 89% of the hospitalizations and deaths were prevented in the drug treatment arm. The drug was administered twice a day for five days. No deaths occurred in the treatment group, and ten deaths occurred in the placebo group. The study was stopped by an independent data safety monitoring board, and the FDA concurred with this decision. Pfizer applied for an Emergency Use Authorization for this drug on 11/15/21.  I would anticipate that the drug would be approved in the next 21 days. In my opinion, this agent, if approved, will markedly alter the course of every coronavirus infection throughout the world. 

The Threat of SARS-CoV-2 Variants

In response to the need for “easy-to-pronounce and non-stigmatising labels,” at the end of May, the World Health Organization assigned a letter from the Greek alphabet to each SARS-CoV-2 variant. GISAID, Nextstrain, and Pango will continue to use the previously established nomenclature. For our purposes, we’ll be referring to each variant by both its Greek alphabet letter and the Pango nomenclature. 

The WHO has sorted variants into two categories: Variants of Concern (VOC) and Variants of Interest (VOI). The criteria for Variants of Concern are as follows:

  • Increase in transmissibility or detrimental change in COVID-19 epidemiology; or 
  • Increase in virulence or change in clinical disease presentation; or 
  • Decrease in effectiveness of public health and social measures or available diagnostics, vaccines, therapeutics.  

The WHO categorizes the following five variants as Variants of Concern (VOC):

Source: World Health Organization

The criteria for Variants of Interest (VOI) are as follows:

  • has been identified to cause community transmission/multiple COVID-19 cases/clusters, or has been detected in multiple countries; OR  
  • is otherwise assessed to be a VOI by WHO in consultation with the WHO SARS-CoV-2 Virus Evolution Working Group. 

The WHO categorizes the following six variants as Variants of Interest (VOI):

Source: World Health Organization

Omicron cases sequenced as of 12/4/21:

Source: GISAID

Delta cases sequenced as of 12/4/21: 

Source: GISAID

B.1.640 cases sequenced as of 12/4/21:

Source: GISAID

Map of Delta sequenced transmissions:

Source: GISAID

Gamma cases sequenced as of 12/4/21:

Source: GISAID

Mu cases sequenced as of 12/4/21:

Source: GISAID

Watching World Data

Over the next few months, we’ll be paying close attention to correlations between the SARS-CoV-2 data, the number of isolates identified in various countries and states, and the non-pharmaceutical interventions (like mask mandates and lockdowns) put in place by state and national governments. Data on infections, deaths, and percent of population infected was compiled from Worldometers. Data for this table for SARS-CoV-2 Isolates Currently Known in Location was compiled from GISAID and the CDC. It’s worth noting that GISAID provided more data than the CDC.

LocationTotal Infections as of 12/03/21New Infections on 12/03/21Total DeathsNew Deaths on 12/03/21% of Pop.InfectedSARS-CoV-2 Isolates Currently Known in LocationNational/ State Mask Mandate?Currently in Lockdown?
World265,161,705(8,234,681 new infections in 14 days; an increase of 1,142,190 infections from the preceding 14 days)705,5745,258,046(102,708 deaths in 14 days; an increase of 5,145 deaths from the preceding 14 days).7,9153.40%B2 lineageAlpha/B.1.1.7 (UK)Eta/B.1.525 (Nigeria/UK)Iota/B.1.526 (USA-NYC)Beta/B.1.351 (SA)Epsilon/B.1.427 + B.1.429 (USA)*Gamma/P.1 (Brazil)Zeta/P.2 (Brazil)A lineage isolateV01.V2 (Tanzania)APTK India VOC 32421Delta/B.1.617.2 (India)BV-1 (Texas, USA)Kappa/B.1.617.1 (India)Lambda/C.37 (Peru)Theta/P.3 (Philippines) Mu/B.1.621 (Colombia)C.1.2 (South Africa 2% of isolates in July 2021)R1 (Japan)Omicron/B.1.1.529 (South Africa November 2021)NoNo
USA49,878,049
(ranked #1) 1,356,453 new infections in the last 14 days)
147,434
(ranked #1)
808,116
(ranked #1)17,018 new deaths in the last 14 days)
1,35214.94%B2 lineageAlpha/B.1.1.7 (UK)Eta/B.1.525 (Nigeria/UK)Iota/B.1.526 (USA-NYC)Beta/B.1.351 (SA)Epsilon/B.1.427 + B.1.429 (USA)*Gamma/P.1 (Brazil)Zeta/P.2 (Brazil)Delta/B.1.617.2 (India)BV-1 (Texas, USA)Theta/P.3 (Philippines) Theta/P.3 (Philippines) Kappa/B.1.617.1 (India)Lambda/C.37 (Peru)Mu/B.1.621 (Colombia)R1(Japan)         Omicron/B.1.1.529 (South Africa November 2021)NoNo
Brazil22,129,409(ranked #3)   10,627615,454(ranked #2)2,22910.30%B2 lineageAlpha/B.1.1.7 (UK)Beta/B.1.351 (SA)Gamma/P.1 (Brazil)Zeta/P.2 (Brazil)Lambda/C.37 (Peru)Mu/B.1.621 (Colombia) Omicron/B.1.1.529 (South Africa November 2021)NoNo
India34,624,360(ranked #2)8,603470,530(ranked #3)4152.47%B2 lineageAlpha/B.1.1.7 (UK)Beta/B.1.351 (SA)Gamma/P.1 (Brazil)Epsilon/B.1.427 + B.1.429 (USA)*Eta/B.1.525 (Nigeria/UK)APTK India VOI 32421Delta/B.1.617.2 (India)Kappa/B.1.617.1 (India)Iota/B.1.526 (USA-NYC) Omicron/B.1.1.529 (South Africa November 2021)NoNo
United Kingdom10,349,647(ranked #4; was #6 fourteen weeks ago)50,584145,424 (ranked #7 in world)14315.17%B2 lineageAlpha/B.1.1.7 (UK)Eta/B.1.525 (Nigeria/UK)Beta/B.1.351 (SA)Epsilon/B.1.427 + B.1.429 (USA)*Gamma/P.1 (Brazil)Delta/B.1.617.2 (India)Theta/P.3 (Philippines) Kappa/B.1.617.1 (India)Lambda/C.37 (Peru)Mu/B.1.621 (Colombia)C.1.2 (South Africa)Omicron/B.1.1.529 (South Africa November 2021)NoNo
California, USA4,978,179(ranked #14 in world)8,54775,013 (ranked #20 in world)9012.59%B2 lineageAlpha/B.1.1.7 (UK)Eta/B.1.525 (Nigeria/UK)Beta/B.1.351 (SA)Gamma/P.1 (Brazil)Epsilon/B.1.427 + B.1.429 (USA)*Zeta/P.2 (Brazil)Delta/B.1.617.2 (India)Theta/P.3 (Philippines) Kappa/B.1.617.1 (India)Lambda/C.37 (Peru) Mu/B.1.621 (Colombia) Omicron/B.1.1.529 (South Africa November 2021)NoNo
Mexico3,894,364(ranked #15)3,146 294,715(ranked #4)2872.97%B2 lineageAlpha/B.1.1.7 (UK)Epsilon/B.1.427 + B.1.429 (USA)*Gamma/P.1 (Brazil)Delta/B.1.617.2 (India)Kappa/B.1.617.1 (India)Lambda/C.37 (Peru)Mu/B.1.621 (Colombia)Omicron/B.1.1.529 (South Africa November 2021)NoNo
South Africa3,004,203(ranked #18)
Exponential growth of Omicron occurring in South Africa. Children under 5 are infected.Quadrupling of daily infections in last four days.
16,055 on 12/3/21,11,535 on 12/2/21,8,561 on 12/1/21,4,373 on 11/30/21,789 on 11/19/21339 on 11/5/2189,940254.97%B2 lineageAlpha/B.1.1.7 (UK)Beta/B.1.351 (SA)Delta/B.1.617.2 (India)Kappa/B.1.617.1 (India)       C.1.2 (South Africa, July 2021)Omicron/B.1.1.529 South Africa, November 2021)NoNo
Canada1,802,359(ranked #26)3,48729,757204.71%B2 lineageAlpha/B.1.1.7 (UK)Eta/B.1.525 (Nigeria/UK)Epsilon/B.1.427 + B.1.429 (USA)*Gamma/P.1 (Brazil)Delta/B.1.617.2 (India)Kappa/B.1.617.1 (India)Lambda/C.37 (Peru)Mu/B.1.621 (Colombia)Omicron/B.1.1.529 (South Africa November 2021)Yes, except Alberta ProvinceNo
Poland3,67,452(ranked #16)26,96585,1264709.58%B2 lineageAlpha/B.1.1.7 (UK)Eta/B.1.525 (Nigeria/UK)Beta/B.1.351 (SA)Delta/B.1.617.2 (India)Mu/B.1.621 (Colombia)NoNo
Turkey8,861,386(ranked #6)21,49577,41718710.34%B2 lineageAlpha/B.1.1.7 (UK)Eta/B.1.525 (Nigeria/UK)Beta/B.1.351 (SA)Epsilon/B.1.427 + B.1.429 (USA)*Gamma/P.1 (Brazil)Lambda/C.37 (Peru)Mu/B.1.621 (Colombia)NoNo
Russia9,736,037(ranked #5)32,930278,857(ranked #5 in world)1,2176.66%B2 lineageAlpha/B.1.1.7 (UK)Beta/B.1.351 (SA)Delta/B.1.617.2 (India)NoNo
Argentina5,337,692(ranked #10)2,382116,6394211.65%B2 lineageAlpha/B.1.1.7 (UK)Eta/B.1.525 (Nigeria/UK)Beta/B.1.351 (SA)Epsilon/B.1.427 + B.1.429 (USA)*Gama/P.1 (Brazil)Delta/B.1.617.2 (India)Lambda/C.37 (Peru)NoNo
Colombia5,076,378(ranked #13)2,299128,685509.82%B2 lineageAlpha/B.1.1.7 (UK)Beta/B.1.351 (SA)Gamma/P.1 (Brazil)Epsilon/B.1.427 + B.1.429 (USA)*Iota/B.1.526 (USA-NYC)Lambda/C.37 (Peru)Mu/B.1.621 (Colombia)NoNo
Peru2,241,027(ranked #22)1,606201,326(ranked #6)446.665%B2 lineageAlpha/B.1.1.7 (UK)Delta/B.1.617.2 (India)Gamma/P.1 (Brazil)Iota/B.1.526 (USA-NYC)Lambda/C.37 (Peru)Mu/B.1.621 (Colombia)NoNo
Indonesia4,257,243(ranked #14)245143,85881.53%B2 lineageAlpha/B.1.1.7 (UK)Delta/B.1.617.2 (India)Beta/B.1.351 (SA)Eta/B.1.525 (Nigeria/UK)Theta/P.3 (Philippines) Iota/B.1.526 (USA-NYC)Kappa/B.1.617.1 (India)NoNo
Iran6,069,559(ranked 8th; was 12th fourteen weeks ago)3,603130,066787.16%B2 lineageAlpha/B.1.1.7 (UK)Delta/B.1.617.2 (India)Beta/B.1.351 (SA)NoNo
Spain5,202,858(ranked 11th) 13,73888,1593711.12%B2 lineageAlpha/B.1.1.7 (UK)Delta/B.1.617.2 (India)Beta/B.1.351 (SA)Gamma/P.1 (Brazil)Epsilon/B.1.427 + B.1.429 (USA)*Eta/B.1.525 (Nigeria/UK)Iota/B.1.526 (USA-NYC)Kappa/B.1.617.1 (India)Mu/B.1.621 (Colombia)Omicron/B.1.1.529 South Africa November 2021)NoNo

What Our Team Is Reading This Week

COVID-19

SARS-CoV-2 Update

It’s time for our next 14-day moving average determinations for SARS-CoV-2 for the United States and my thoughts on vaccines and mutant viruses. We use the WORLDOMETERS aggregators data set to make any projections since it includes data from the Department of Veterans Affairs, the U.S. Military, federal prisons and the Navajo Nation.

In the United States, SARS-CoV-2 deaths have decreased for the eleventh time in a 14-day period. There were 30 fewer deaths per day than in the last 14-day period. In the last 14 days, the number of infections has decreased by 947 infections per day.  Our infections per day are still high, probably secondary to SARS-CoV-2 mutant Delta/B.1.617.2. I would predict that the opening of schools, places of worship, bars, restaurants, indoor dining and travel all will contribute to further spread of SARS-CoV-2 mutants and rising numbers  in infections, hospitalizations and deaths in the coming months. Increased traveling as well as summer vacations, and the July 4 holiday will all cause further increases. Vaccinations, increased mask usage and social distancing, which are a part of the Biden SARS-CoV-2 plan (day 188 of plan) will be necessary to stop spread of mutants and cause  further reductions in infections, hospitalizations and deaths in the future. On 7/02/21, the United States had 18,399 new infections. There were also 322 deaths. The number of hospitalized patients is decreasing, but 3,866 patients are still seriously or critically ill. The number of critically ill patients has decreased by 294 in the last 14 days, while 3,785 new deaths occurred. The number of critically ill patients is decreasing for the sixth 14-day period, but a large number of patients are still dying each day (average 270/day). 

As of 7/02/21, we have had 621,161 deaths and 34,580,198 SARS-CoV-2 infections in the United States. We have had 188,327 new infections in the last 14 days. We are adding an average of 94,163 infections every 7 days. Each million infections usually results in 10,000 to 20,000 deaths. On 7/02/21, thirty-two states have had greater than 500,000 total infections, and 33 states have had greater than 5,000 total deaths. Ten states (Ohio, Michigan, Georgia, Illinois, New Jersey, Pennsylvania, Florida, Texas, New York and California) have had greater than 20,000 deaths. Four states (Florida, Texas, New York and California) have had greater than 35,000 deaths. In the world, 42 other countries have greater than 500,000 infections and 60 other countries have greater than 5,000 deaths.

On 11/20/20 in the United States, 3.70% of the population had a documented SARS-CoV-2 infection. California was ranked 41st in infection percentage at 2.77%. In North Dakota 9.18% of the population was infected (ranked #1), and in South Dakota 8.03% of the population was infected (ranked #2).

As of 7/02/21, in the United States, 10.38% of the population has had a documented SARS-CoV-2 infection. In the last 9 months, 7% of our country became infected with SARS-CoV-2. 

As of 7/02/21, California was ranked 38th in infection percentage at 9.66%. In North Dakota 14.53% of the population was infected (ranked #1), while Rhode Island was at 14.40% (ranked #2) and South Dakota was at 14.08% of the population infected (ranked #3). Thirty-three states have greater than 10% of their population infected and 42 states have greater than 9% of their population infected. Only one state has less than 3% of their population infected: Hawaii (2.67%).

The Threat of SARS-CoV-2 Variants

In a response for the need for “easy-to-pronounce and non-stigmatising labels,” at the end of May, the World Health Organization assigned a letter from the Greek alphabet to each SARS-CoV-2 variant. GISAID, Nextstrain, and Pango will continue to use the previously established nomenclature. For our purposes, we’ll be referring to each variant by both its Greek alphabet letter and the Pango nomenclature. 

The WHO has sorted variants into two categories: Variants of Concern (VOC) and Variants of Interest (VOI). The criteria for Variants of Concern are as follows:

  • Increase in transmissibility or detrimental change in COVID-19 epidemiology; or 
  • Increase in virulence or change in clinical disease presentation; or 
  • Decrease in effectiveness of public health and social measures or available diagnostics, vaccines, therapeutics.  

The WHO categorizes the following four variants as Variants of Concern (VOC):

The criteria for Variants of Interest (VOI) are as follows:

  • has been identified to cause community transmission/multiple COVID-19 cases/clusters, or has been detected in multiple countries; OR  
  • is otherwise assessed to be a VOI by WHO in consultation with the WHO SARS-CoV-2 Virus Evolution Working Group. 

The WHO categorizes the following six variants as Variants of Interest (VOI):

The two variants of concern that have garnered most of our attention recently are Alpha (B.1.1.7) and Delta (B.1.617.2). Alpha, first detected in the United Kingdom in September of 2020, has been detected in almost every country and all 50 states in the U.S. Up until this week, Alpha was the dominant variant in the United States, accounting for 60-70% of cases in May and early June.  

Alpha is more infectious than other previously circulating B2 lineage isolates. There are two deletions and six other mutations in its spike protein. One mutation involves a change of one amino acid, an asparagine at position 501 in the receptor binding motif with a tyrosine. This enhances binding (affinity) to the ACE-2 receptor and may alone be responsible for the increased infectivity of this isolate. A study published March 10 in the British Medical Journal (BMJ) found that the risk of death increased by 64% in patients infected with Alpha compared to all other isolates (known at the time). 

While Alpha continues to pose a threat, the increased prominence of the Delta variant (B.1.617.2), first identified in India, is a concern for several reasons. 

First, there is some evidence to suggest that Delta is more transmissible than other variants, including Alpha. This may be due to a mutation, P681R, near the furin cleavage site, and/or due to a deletion in the N-terminal domain (NTD) of the spike protein. In Australia, public health officials have described a handful of cases where transmission of the Delta variant occurred after “fleeting encounters”— five to ten seconds of close contact between strangers in a public place like a gym or a restaurant. 

Second, Delta leads to more severe infections. According to a recent study in Scotland, “Risk of COVID-19 hospital admission was approximately doubled in those with the Delta VOC when compared to the Alpha VOC.” 

Lastly, there is evidence of reduced vaccine effectiveness with Delta. The variant appears to be particularly evasive in people who have had only one dose of vaccine. A Scottish study estimated the vaccine effect against Delta after one dose to be 30% for the Pfizer vaccine and 18% for the AstraZeneca vaccine. After two doses, it was 79% for Pfizer and 60% for AstraZeneca. 

Considering these factors, it is not surprising that Delta is on track to overtake Alpha (B.1.1.7) as the dominant variant worldwide. In the past month, it accounted for 91% of isolations in India, 97% of isolations in the United Kingdom, 96% in Singapore, 90% in Russia, 99% in Israel, and 73% in Australia. In the United States, Delta is now the dominant variant; as of July 6, it accounted for 41.8% of isolations in the past four weeks, compared to 12.9% two weeks ago and 3.7% four weeks ago. This suggests the proportion of Delta cases is nearly doubling every week. 

Source: GISAID

To predict the potential impact of Delta in the U.S., one need only look across the pond. COVID-19 cases in Scotland (where 51% of the population is fully vaccinated) reached a record high last week, overwhelming hospitals and causing some to cancel elective surgeries and most outpatient care. In England, average daily COVID-19 hospital admissions have increased by 52% in the last week. ONS data also reveal a shift in the proportion of young people being hospitalized for COVID-19, with the number of hospitalized 15-24 year-olds increasing steadily since May. Meanwhile, the UK plans to end social distancing and mask mandates on July 19. (My daughter says this is where I should insert a facepalm emoji.)

In Israel, where 56% of the population have received two doses of the Pfizer vaccine, the Delta variant accounts for approximately 99% of cases over the past month. Israel’s health ministry now reports that the Pfizer vaccine is only 64% effective in preventing infection, compared to data from May (before Delta became dominant in Israel) that suggested the vaccine was 94% effective. Israel dropped its mask mandate on June 18, with exceptions for air travel and long-term healthcare facilities, but reinstated the mandate on June 28 after two school outbreaks

As of July 3, the CDC estimates that the Delta variant makes up 51% of US cases. The NY Times reports that nationwide, compared to the previous 14 days, COVID-19 cases are up 14%. One state getting hit particularly hard by Delta is Missouri, where Delta accounts for 73% of COVID-19 cases. As of July 5, new COVID-19 cases in Missouri were up 45% compared to the previous 14 days, hospitalizations were up 24%, and deaths were up 68%. Some Missouri hospitals have run out of ventilators. The NY Times reports that as of July 5, only 39% of Missouri residents have been fully vaccinated. In the 12-17 age group only 23% have been vaccinated. Missouri never implemented a state-wide mask mandate, and most local mask mandates were lifted at the end of May, along with distancing and capacity restrictions for businesses. All state workers in Missouri were directed to return to in-person work by May 17.  

Keeping in mind the potential of variants to evade vaccines, I believe it’s important that we pay attention to instances of vaccine failure. Prior to April 30, 2021, the CDC reported all breakthrough infections. From January 1, 2021 to April 30, 2021, there were 10,262 breakthrough infections, 27% of which were asymptomatic and 995 of which were hospitalized. Of the hospitalized patients, 160 (16%) died. 

Between May 1 and June 28, there were 4,686 breakthrough cases reported to the CDC that resulted in hospitalization or death. (The CDC no longer tracks breakthrough cases that do not result in hospitalization or death.) As of June 28, the CDC reports that 656 fully-vaccinated people have died of COVID-19. This means that 496 of those deaths occurred between May 1 and June 28. Whereas the period from January 1 to April 30 had an average of 40 COVID deaths per month in fully-vaccinated people, the period from May 1 to June 28 had an average of 248 deaths per month. This constitutes a 6-fold increase. We can’t say with certainty whether this increase in deaths is related to the rise in prevalence of the Delta variant, but there is certainly a correlation. Delta accounted for less than 1% of cases at the end of April, about 3% at the end of May, and an estimated 51% in the last two weeks of June. 

Indeed, reports of fully-vaccinated people infected with the Delta variant may become more common. Author John Pavlovitz recently described his family’s experience. Pavlovitz, his wife, and their 16 year-old son were all fully vaccinated, while their 11 year-old daughter was not yet eligible. Their daughter developed COVID-19 symptoms and tested positive while the family was traveling, and it presumably spread to the other three family members when they returned home to quarantine together. (However, there’s really no way of knowing which family member was the index case. For all we know, one of the vaccinated family members could have been infected asymptomatically and passed the virus to the daughter.) Pavlovitz and his wife both developed COVID-19 symptoms, and their son had an asymptomatic infection. Pavlovitz admits that they should have been more careful to prevent household transmission. They apparently did not wear masks in the house, even after they learned their daughter was infected. They thought that since they’d been vaccinated, they didn’t have to worry about being infected. 

The experience of the Pavlovitz family suggests that it is prudent for vaccinated people to follow the World Health Organization’s guidance on masking: everyone, regardless of vaccination status, should continue to wear a mask when gathering with folks from other households indoors, when in close contact with people who are unvaccinated, and when in close contact with people who may be infected. Some U.S. local public health agencies, like Los Angeles County, agree. 

Variants of (Slightly Less) Concern

At 2,284 cases, the United States has the second highest number of isolations of the Beta variant (B.1.351, first identified in South Africa), and 6 of these were in the last four weeks. The Beta variant now accounts for only 0.1% of isolations in the U.S., down from 0.3% two weeks ago. 

The United States still has the most isolations of the Gamma variant (P.1) in the world, with 18,391 overall and 527 in the past four weeks. Gamma accounted for 9.2% of isolations in the past month, down from 12.1% two weeks ago. 

The WHO has also recently labeled the Lambda variant (C.37), which was first identified in Peru in August of 2020, as a variant of interest. The United States has the second largest number of isolations of Lambda, after Chile, with 635 total and 17 in the past four weeks. Lambda causes over 80% of infections in Peru which experienced a surge in new cases this spring and, as of July 6, has had 2,069,051 infections and 193,588 deaths. Peru averaged 2,426 new cases per day over the last week. Strangely, a number of South American countries (Peru, Argentina, Colombia) have stopped reporting new isolations of Lambda to GISAID. 

COVID-19 in California

The following data were reported by the California Department of Public Health:

DateTotal CasesNew CasesTotal DeathsNew DeathsHospitalizedIn ICUFully Vaccinated
6/4/213,687,7361,04762,179871,06226017,662,712
6/5/213,688,8931,15762,242631,04224317,813,305
6/6/213,689,9941,10162,4702281,03522117,947,342
6/7/213,690,86887462,47331,01121918,011,744
6/8/213,691,66079262,47961,01522818,100,412
6/9/213,692,50684662,499201,03023118,240,912
6/10/213,693,36285662,538391,00123418,431,265
6/11/213,694,4981,13662,5935598223318,542,484
6/12/213,695,5301,03262,508-8595524018,637,504
6/13/213,696,47294262,512491524118,694,365
6/14/213,697,29982762,505-793923918,731,215
6/15/213,697,92762862,5151097725118,875,034
6/16/213,698,62669962,5341998124218,970,053
6/17/213,699,45582962,5653195623219,074,396
6/18/213,700,7501,29562,6225795123319,164,548
6/19/213,702,2371,48762,661391,27119,164,548
6/20/213,702,88264562,689281,24919,164,548
6/21/213,704,0051,12362,693492923819,343,396
6/22/213,704,64063562,701894924319,398,536
6/23/213,705,42778762,7414097828719,454,555
6/24/213,706,8461,41962,8228195527419,541,124
6/25/213,708,8612,01562,8906895927419,621,174
6/26/213,711,9283,06762,9596919,621,174
6/27/213,712,79586762,9903119,621,174
6/28/213,714,0511,25662,994498029019,880,275
6/29/213,714,81376262,99951,05028819,941,886
6/30/213,710,4542,01363,023241,08930720,014,043
7/1/213,712,1521,69863,096731,09030020,073,302
7/2/213,713,9441,79263,141451,07129520,073,302
7/3/213,715,3771,433*63,165241,07129520,073,302
7/4/213,716,8101,43363,189241,07129520,073,302
7/5/213,718,2431,43363,213241,07129520,073,302
7/6/213,719,6741,43363,238241,15329820,240,207
7/7/213,721,0061,33263,259211,22829920,296,653

*Data for 7/3/21-7/6/21 were reported in bulk on 7/6/21. We’ve divided the new cases evenly among the four days. 

California dropped its mask mandate and most public space capacity limits on June 15. Over the past two weeks, daily new cases in California have hovered between 635 and 3,067. The two-week high for daily new cases occurred on June 26. More than 1,200 Californians are still hospitalized with COVID-19, with nearly 300 of those in the ICU. Since the beginning of July, 236 Californians have died of COVID-19. 

Age of Confirmed COVID-19 Cases

Date0-17 yrs Total0-17 New Cases18-49 yrs Total18-49 New Cases50-64 yrs Total50-64 New Cases65+ yrs Total65+ New CasesUnknown TotalUnknown New Cases
6/4/21480,5561702,114,286621700,579150390,0211112,294-5
6/5/21480,7431872,114,961675700,764185390,1351142,290-4
6/6/21480,9762332,115,563602700,952188390,210752,2933
6/7/21481,1501742,116,061498701,074122390,290802,2930
6/8/21481,2861362,116,510449701,212138390,359692,2930
6/9/21481,4331472,116,998488701,346134390,436772,2930
6/10/21481,5761432,117,480482701,491145390,522862,2930
6/11/21481,7721962,118,129649701,671180390,6371152,289-4
6/12/21481,9651932,118,723594701,826155390,722852,2945
6/13/21482,1261612,119,276553701,972146390,812902,286-8
6/14/21482,2911652,119,756480702,101129390,866542,285-1
6/15/21482,4061152,120,111355702,212111390,912462,2861
6/16/21482,5241182,120,523412702,312100390,983712,284-2
6/17/21482,6631392,121,032509702,429117391,045622,2862
6/18/21482,8752122,121,782750702,635206391,1701252,2882
6/21/21483,4305552,123,7291,947703,148391,4072,291
6/22/21483,5631332,124,094365703,24597391,455482,283-8
6/23/21483,6941312,124,566472703,375130391,507522,2852
6/24/21483,8751812,125,416850703,600225391,6521452,30318
6/25/21484,1112362,126,6051,189703,957357391,8702182,31815
6/28/21484,9007892,129,6313,026704,847890392,3384682,35537
6/29/21485,0751752,130,090459704,93891392,372342,338-17
7/1/21484,86802,128,8900704,2430391,84702,304-34
7/2/21485,1482802,130,0491,159704,468225391,9771302,302-2
7/3/21485,4042562,130,959911704,658189392,053762,3020
7/4/21485,6602562,131,870911704,847189392,129762,3020
7/5/21485,9162562,132,781911705,036189392,205762,3020
7/6/21486,1722562,133,692911705,225189392,281762,3042
7/7/21486,3711992,134,547855705,414189392,368872,3062

An examination of cases broken down by age group reveals that the 18-49 age group continues to have the highest rate of infection. There was a marked increase in new daily cases in this age group from June 15 to June 18, with moderate increases for the other three age groups. 

Despite the availability of vaccines for children 12 and up, in California, we have not seen a marked decrease in the number of new cases in children over the past two weeks. From June 19 to July 2, the 0-17 age group averaged 276 new infections per day, a 69% increase compared to the previous 14-day period. (The daily average for June 4-18 was 163.) As of June 30, the California Department of Public Health reports 4 COVID-19 deaths in children under the age of 5 and 19 deaths in children ages 5-17. To date, 486,371 children in California have been infected with COVID-19. The US Census Bureau estimates that there are 8,890,250 children in California, so approximately 5.4% of children have had a documented case of COVID-19.

Watching World Data

Over the next few months, we’ll be paying close attention to correlations between the SARS-CoV-2 data, the number of isolates identified in various countries and states, and the non-pharmaceutical interventions (like mask mandates and lockdowns) put in place by state and national governments. Data on infections, deaths, and percent of population infected was compiled from Worldometers. Data for this table for SARS-CoV-2 Isolates Currently Known in Location was compiled from GISAID and the CDC. It’s worth noting that GISAID provided more data than the CDC.

LocationTotal Infections as of 7/02/21New Infections on 7/02/21Total DeathsNew Deaths on 7/02/21% of Pop.InfectedSARS-CoV-2 Isolates Currently Known in LocationNational/ State Mask Mandate?Currently in Lockdown?
World183,836,958(5,248,302 new infections in 14 days)437,5483,979,868(113,224 new deaths in 14 days)8,4952.35%B2 lineageAlpha/B.1.1.7 (UK)Eta/B.1.525 (Nigeria/UK)Iota/B.1.526 (USA-NYC)Beta/B.1.351 (SA)Epsilon/B.1.427 + B.1.429 (USA)*Gamma/P.1 (Brazil)Zeta/P.2 (Brazil)A lineage isolateV01.V2 (Tanzania)APTK India VOC 32421Delta/B.1.617.2 (India)BV-1 (Texas, USA)Kappa/B.1.617.1 (India)Lambda/C.37 (Peru)Theta/P.3 (Philippines) NoNo
USA34,580,198
(ranked #1)
18,399
621,161
(ranked #1)
32210.38%B2 lineageAlpha/B.1.1.7 (UK)Eta/B.1.525 (Nigeria/UK)Iota/B.1.526 (USA-NYC)Beta/B.1.351 (SA)Epsilon/B.1.427 + B.1.429 (USA)*Gamma/P.1 (Brazil)Zeta/P.2 (Brazil)Delta/B.1.617.2 (India)BV-1 (Texas, USA)Theta/P.3 (Philippines) Theta/P.3 (Philippines) Kappa/B.1.617.1 (India)Lambda/C.37 (Peru)NoNo
Brazil18,687,469(ranked #3)   65,165(ranked #1) 522,068(ranked #2)1,8798.72%B2 lineageAlpha/B.1.1.7 (UK)Beta/B.1.351 (SA)Gamma/P.1 (Brazil)Zeta/P.2 (Brazil)Lambda/C.37 (Peru)NoNo
India30,501,189(ranked #2)47,252(ranked #2)401,068(ranked #3)7872.18%B2 lineageAlpha/B.1.1.7 (UK)Beta/B.1.351 (SA)Epsilon/B.1.427 + B.1.429 (USA)*Eta/B.1.525 (Nigeria/UK)APTK India VOC 32421Delta/B.1.617.2 (India)Kappa/B.1.617.1 (India)NoNo
United Kingdom4,855,169(ranked #7)27,125128,189277.11%B2 lineageAlpha/B.1.1.7 (UK)Eta/B.1.525 (Nigeria/UK)Beta/B.1.351 (SA)Epsilon/B.1.427 + B.1.429 (USA)*Gamma/P.1 (Brazil)Delta/B.1.617.2 (India)Theta/P.3 (Philippines) Kappa/B.1.617.1 (India)Lambda/C.37 (Peru)NoNo
California, USA3,700,750(ranked #13 in world)1,29562,622579.66%B2 lineageAlpha/B.1.1.7 (UK)Eta/B.1.525 (Nigeria/UK)Beta/B.1.351 (SA)Gamma/P.1 (Brazil)Epsilon/B.1.427 + B.1.429 (USA)*Zeta/P.2 (Brazil)Delta/B.1.617.2 (India)Theta/P.3 (Philippines) Kappa/B.1.617.1 (India)Lambda/C.37 (Peru) NoNo
Mexico2,525,350(ranked #15)6,081233,248(ranked #4)2011.93%B2 lineageAlpha/B.1.1.7 (UK)Epsilon/B.1.427 + B.1.429 (USA)*Gamma/P.1 (Brazil)Delta/B.1.617.2 (India)Kappa/B.1.617.1 (India)Lambda/C.37 (Peru)NoNo
South Africa2,019,826(ranked #19)24,270621,3223033.36%B2 lineageAlpha/B.1.1.7 (UK)Beta/B.1.351 (SA)Delta/B.1.617.2 (India)Kappa/B.1.617.1 (India)NoNo
Canada1,416,317(ranked #24)1,00726,338433.72%B2 lineageAlpha/B.1.1.7 (UK)Eta/B.1.525 (Nigeria/UK)Epsilon/B.1.427 + B.1.429 (USA)*Gamma/P.1 (Brazil)Delta/B.1.617.2 (India)Kappa/B.1.617.1 (India)Lambda/C.37 (Peru)Yes, except Alberta ProvinceNo
Poland2,880,4107(ranked #14)9675,065217.61%B2 lineageAlpha/B.1.1.7 (UK)Eta/B.1.525 (Nigeria/UK)Beta/B.1.351 (SA)Delta/B.1.617.2 (India)NoNo
Turkey5,435,831(ranked #6)4,89149,829276.37%B2 lineageAlpha/B.1.1.7 (UK)Eta/B.1.525 (Nigeria/UK)Beta/B.1.351 (SA)Epsilon/B.1.427 + B.1.429 (USA)*Gamma/P.1 (Brazil)Lambda/C.37 (Peru)NoNo
Russia5,561,360(ranked #5)23,218                                                  136,5656793.80%B2 lineageAlpha/B.1.1.7 (UK)Beta/B.1.351 (SA)Delta/B.1.617.2 (India)NoNo
Argentina4,512,439(ranked #8)20,88895.3826109.69%B2 lineageAlpha/B.1.1.7 (UK)Eta/B.1.525 (Nigeria/UK)Beta/B.1.351 (SA)Epsilon/B.1.427 + B.1.429 (USA)*Gama/P.1 (Brazil)Delta/B.1.617.2 (India)Lambda/C.37 (Peru)NoNo
Colombia4,512,302(ranked #9)28,005107,72355868.35%B2 lineageAlpha/B.1.1.7 (UK)Beta/B.1.351 (SA)Gamma/P.1 (Brazil)Epsilon/B.1.427 + B.1.429 (USA)*Iota/B.1.526 (USA-NYC)Lambda/C.37 (Peru)NoNo
Peru2,060,344(ranked #18)2,790192,902(ranked #5)2156.16%B2 lineageAlpha/B.1.1.7 (UK)Gamma/P.1 (Brazil)Iota/B.1.526 (USA-NYC)Lambda/C.37 (Peru)NoNo
Indonesia2,228,938(ranked #17)25,83059,53453910.8%B2 lineageAlpha/B.1.1.7 (UK)Delta/B.1.617.2 (India)Beta/B.1.351 (SA)Eta/B.1.525 (Nigeria/UK)Theta/P.3 (Philippines) Iota/B.1.526 (USA-NYC)Kappa/B.1.617.1 (India)NoNo
*Also referred to as CAL.20C


SARS-CoV-2, Children, and MIS-C/PIMS

I’m pleased to see that COVID-19 cases and MIS-C (PIMS) cases in children in the US are finally getting national attention. The CDC now tracks total MIS-C cases and deaths in children and young adults up to 20 years old in the United States. As of June 28, CDC reported 4,196 cases of MIS-C that meet the case definition and 37 deaths—that’s 178 new cases and one new death since the June 2 report. The CDC notes, “As of October 1, the number of cases meeting the case definition for multisystem inflammatory syndrome in children (MIS-C) in the United States surpassed 1,000. As of February 1, this number surpassed 2,000, and exceeded 3,000 as of April 1.” This means it took seven months to reach 1,000 MIS-C cases, only four months to reach an additional 1,000 cases, and only two months to add an additional 1,185 cases. This suggests to us that variants are causing more MIS-C. 

Date of ReportingTotal MIS-C PatientsChange Since Last ReportTotal MIS-C DeathsChange Since Last Report
6/28/20214196+17837+1
6/2/20214018+27636+1
5/3/20213742+55735-1
3/29/20213185+56836+3
3/1/2021261733

Schools in the United States have been open throughout the pandemic, with teachers and education support professionals demonstrating their extraordinary ability to adapt in adverse circumstances. Teachers all over the country reinvented their teaching, taking their classrooms online in order to provide safe and remote learning experiences for students. The so-called “reopening” of schools, which more accurately refers to the opening of school buildings, as schools never closed, has been highly politicized, with many governors issuing mandates for in-person instruction, even as case counts, hospitalizations, and deaths in their states rose exponentially. The CDC has maintained that transmission risk in schools is minimal, provided that adequate safety measures are taken; however, we know that many states have not properly enforced universal masking (and some are repealing mask mandates this week), and we know that many school facilities are not equipped with the proper air handling systems. With more school buildings opening, there is a growing body of research that suggests that COVID-19 transmission can and does happen in schools. 

After recommending for months that school buildings be open, in mid-February (a year into the pandemic), The American Academy of Pediatrics, in collaboration with the Children’s Hospital Association, finally began tracking data on COVID-19 in children at the state and national level. Data reporting by states is still voluntary, and every state is different in its willingness to collect and disclose data on infections, hospitalizations, deaths, and testing rates in children. 

As of the APA’s July 1 report, only 11 states provide age distribution for testing. This makes it difficult to hold states accountable for testing each age group in proportion to its population. We’ve seen a trend in states where testing data with age distribution is available that children are tested at lower rates than adults. Hospitalization data by age group is only available in 24 states and New York City, so we only understand the severity of COVID-19 infections in children for about half the country. Age distribution for cases is provided by 49 states, New York City, the District of Columbia, Puerto Rico, and Guam. Age distribution for deaths is provided in 43 states, New York City, Puerto Rico, and Guam. It’s worth noting that New York State does not provide age data for cases, testing, hospitalizations, and deaths. Two states, Florida and Utah, only report cases in children aged 0-14, so the number of cases, hospitalizations, and deaths in children ages 15-17 is unknown in these states. 

As of July 1, children represented 14.2% of all COVID-19 cases reported to APA. A total of 335 child deaths due to COVID-19 were reported in 43 states. The following states do not report child mortality due to COVID-19: Michigan, Montana, New Mexico, New York, Rhode Island, South Carolina, and West Virginia. 

If we truly want to keep children safe, especially as many school buildings open for in-person instruction, we need to collect more complete data in every state on child testing rates, cases, hospitalizations, and deaths.

Vaccinating America’s Children

The New York Times reports that nationally, 55.6% of people 12 and up are fully vaccinated, while 58.4% of people 18 and up are fully vaccinated, according to the CDC. Only 47.5% of the total population is fully vaccinated. 

Some states are falling far behind when it comes to getting children—and the general population—fully vaccinated. Alabama and Mississippi have only fully vaccinated 33% of their population. Vermont, Maine, Massachusetts, and Connecticut have fully vaccinated more than 60% of their population, with Vermont having the highest vaccination rate at 74%. California has fully vaccinated 51% of their population. 

The Road Ahead

President Biden has made the pandemic a first priority and has now ordered enough vaccines to vaccinate everyone who wants a vaccination by the end of this month. As of 7/7/21, the CDC reports that 182.8 million people (approximately 55.1% of the population) have had one dose of any vaccine. 157.9 million people (47.6% of the population) are fully vaccinated. The rate of people who are fully vaccinated has increased by less than 3% in the past two weeks. 

As of May 10, all people in the U.S. over the age of 12 are eligible to receive a vaccine. The Biden administration has already exceeded its goal of administering 200 million doses of vaccine in the first 100 days of the administration. The Pfizer-BioNtech is already approved for ages 12-15 and the Moderna vaccine should be approved in June 2021. Moderna has applied for emergency use authorization to administer their mRNA vaccines to children aged 12-15. Testing is ongoing for children in younger age groups and may be approved for ages 2-11 by the end of September 2021. 

Testing, wearing masks, social distancing and washing our hands frequently should no longer be political issues. These are non-pharmaceutical interventions used by most successful countries and some states to protect their citizens and their economies. New Zealand, Taiwan, and Australia are three countries that have done this successfully. In the United States, Hawaii is doing a better job handling the pandemic than many of our states. These interventions and vaccination should keep the pandemic from overwhelming our health care delivery systems world-wide. New mutations like Epsilon/B.1.427 + B.1.429 and the Alpha, Beta, Gamma, and Delta variants will probably spread rapidly throughout the United States over the next 90 days as many states (ex. Texas, Florida, Iowa, Mississippi, Wyoming and South Carolina) open up everything and do away with masking and social distancing. We will probably see increased new infections per day in the United States. In the UK, Alpha/B.1.1.7, has increased the number of infections, hospitalizations and deaths. This and other mutants may do the same thing in the USA.

The Pfizer and Moderna RNA vaccines and the Johnson & Johnson single dose vaccination adenovirus vaccine are all being used to immunize people in the USA. The Oxford-AstraZeneca vaccine and the Novavax vaccine may be available in the fourth quarter of 2021. 

The bad news is that all currently available vaccines are based on the spike protein sequence identified in China in December 2019. Mutated isolates, as discussed above, may overtake our ability to produce new vaccines and vaccinate the populace. Like Influenza vaccines, we may have to reformulate vaccines based on active, worldwide surveillance at least every 4 to 6 months. The FDA is currently putting together a guidance document for how to develop booster vaccines for SARS-CoV-2 mutations. A surrogate marker of protection like antibody to the mutated Receptor Binding Domains of SARS-CoV-2 should be considered for vaccine approval. 

The ideal approach to addressing the major mutations on at least five continents would be to make vaccines against each of the mutations. I’d get all of the vaccine companies and contract production companies on a call and “suggest” that two companies at least make and mass produce one of the four mutations. The government would pay the cost and buy at least 200 million doses in advance for each variant at say $40 a dose. The total cost to purchase the vaccine (800 million doses) would only be 32 billion dollars. Give each company a billion dollars each for development costs (another 8 billion dollars). Spend another two billion dollars for syringes and you’ve got enough booster doses to vaccinate 200 million people for all 4 variants. 42 billion dollars would be a small price to pay to catch up with the current mutations. Even if you had to do this every two years, it would be well worth the dollars spent. 

We are not doing adequate numbers of PCR or antigen detection assays in the United States. According to JHU, in January of 2021, we were doing up to 2,307,949 tests per day. In March 2021, the highest number of tests per day was 1,709,210, and in April, the highest number of tests per day was 2,008,319. Currently, we’re doing 444,718 tests per day (7-day moving average); that’s 1,563,601 fewer tests per day than the April high. 

We still need to perform more virus isolations and perform more DNA sequencing of viruses in each country, state, populous city, and county if we are to rapidly identify new mutations. In December 2020, WHO asked countries to increase their sequencing rates, and the European Commission asked member states to set a goal of 10%. The CDC then set a goal of 5% for the United States. At the end of June 2021, the United States had a SARS-CoV-2 genome sequencing rate of 1.69%, whereas the United Kingdom had a genome sequencing rate of 10.2%. I’m more hopeful that we will have the facilities, the equipment, and the trained staff needed to perform this work. As a nation we still need to make and distribute more vaccines to other countries, new vaccines directed against mutants, and the necessary rapid tests and protective equipment needed by medical staff, first responders, essential workers and especially teachers and students. I’m still hopeful we can work together on our and the world’s infectious disease problems. 

What Our Team Is Reading This Week

COVID-19

SARS-CoV-2 Update

It’s time for our next 14-day moving average determinations for SARS-CoV-2 for the United States and my thoughts on vaccines and mutant viruses. We use the WORLDOMETERS aggregators data set to make any projections since it includes data from the Department of Veterans Affairs, the U.S. Military, federal prisons and the Navajo Nation.

In the United States, SARS-CoV-2 deaths have decreased for the eighth time in a 14-day period. There were 137 fewer deaths per day than in the last 14-day period. In the last 14 days, the number of infections has decreased by 12,293 infections per day.  Our infections per day are still high, probably secondary to SARS-CoV-2 mutants, to include the Alpha/B.1.1.7 isolate, the Iota/B.1.526 isolate, the Epsilon/B.1.427 + B.1.429 isolate, the Beta/B.1.351 isolate, the Gamma/P.1 and Zeta/P.2 isolates, and the new isolate, Deta/B.1.617+. I would predict that the opening of schools, places of worship, bars, restaurants, indoor dining and travel all will contribute to further spread of multiple SARS-CoV-2 mutants and rising numbers  in infections, hospitalizations and deaths in the coming months. Increased traveling as well as summer vacations, and the July 4 holiday will all cause further increases. Vaccinations, increased mask usage and social distancing, which are a part of the Biden SARS-CoV-2 plan (day 136 of plan) will be necessary to stop spread of mutants and cause  further reductions in infections, hospitalizations and deaths in the future. On 6/04/21, 16,925 new infections occurred in the United States. There were also 520 deaths. The number of hospitalized patients is decreasing, but 5,631 patients are still seriously or critically ill. The number of critically ill patients has decreased by 1,761 in the last 14 days, while 6,577 new deaths occurred. The number of critically ill patients is decreasing for the fourth 14-day period, but a large number of patients are still dying each day. 

As of 6/04/21, we have had 612,249 deaths and 34,192,023 SARS-CoV-2 infections in the United States. We have had 271,267 new infections in the last 14 days. We are adding an average of 135,633 infections every 7 days. Each million infections usually results in 10,000 to 20,000 deaths. On 6/04/21, twenty-two states have had greater than 500,000 total infections, and 33 states have had greater than 5,000 total deaths. Nine states (Michigan, Georgia, Illinois, New Jersey, Pennsylvania, Florida, Texas, New York and California) have had greater than 20,000 deaths. Four states (Florida, Texas, New York and California) have had greater than 35,000 deaths.

For comparison, on 11/20/20 in the United States, 3.70% of the population had a documented SARS-CoV-2 infection. California was ranked 41st in infection percentage at 2.77%. In North Dakota 9.18% of the population was infected (ranked #1), and in South Dakota 8.03% of the population was infected (ranked #2).

As of 6/04/21, in the United States, 10.32% of the population has had a documented SARS-CoV-2 infection. In the last 6 months, over 6% of our country became infected with SARS-CoV-2. 

As of 6/04/21, California was still ranked 36th in infection percentage at 9.60%. In North Dakota 14.45% of the population was infected (ranked #1), while Rhode Island was at 14.34% (ranked #2) and South Dakota was at 14.04% of the population infected (ranked #3). Thirty-one states have greater than 10% of their population infected and 42 states have greater than 9% of their population infected. Only one state has less than 3% of their population infected: Hawaii (2.52%).

New Mutants

In a response for the need for “easy-to-pronounce and non-stigmatising labels,” at the end of May, the World Health Organization assigned a letter from the Greek alphabet to each SARS-CoV-2 variant. GISAID, Nextstrain, and Pango will continue to use the previously established nomenclature. For our purposes, we’ll be referring to each variant by both its Greek alphabet letter and the Pango nomenclature. 

The WHO has sorted variants into two categories: Variants of Concern (VOC) and Variants of Interest (VOI). The criteria for Variants of Concern are as follows:

  • Increase in transmissibility or detrimental change in COVID-19 epidemiology; or 
  • Increase in virulence or change in clinical disease presentation; or 
  • Decrease in effectiveness of public health and social measures or available diagnostics, vaccines, therapeutics.  

The WHO categorizes the following four variants as Variants of Concern (VOC):

The criteria for Variants of Interest (VOI) are as follows:

  • has been identified to cause community transmission/multiple COVID-19 cases/clusters, or has been detected in multiple countries; OR  
  • is otherwise assessed to be a VOI by WHO in consultation with the WHO SARS-CoV-2 Virus Evolution Working Group. 

The WHO categorizes the following six variants as Variants of Interest (VOI):

A new mutant SARS-CoV-2 virus (lineage B.1.1.7, now referred to by WHO as Alpha), first seen in the UK in September 2020, has now been found in multiple other countries. This isolate has now been found in 50 states and the District of Columbia. This isolate is more infectious than other previously circulating B2 lineage isolates. There are two deletions and six other mutations in its spike protein. One mutation involves a change of one amino acid, an asparagine at position 501 in the receptor binding motif with a tyrosine. This enhances binding (affinity) to the ACE-2 receptor and may alone be responsible for the increased infectivity of this isolate. A study published March 10 in the British Medical Journal (BMJ) found that the risk of death increased by 64% in patients infected with the B.1.1.7 variant compared to all other isolates. Due to air and other travel, this isolate will become the dominant isolate worldwide. 

On 4/10/21, the CDC stopped providing data to the public on the number of reported cases of all variants of SARS-CoV-2, both nationally and by state. This data used to be available at https://www.cdc.gov/coronavirus/2019-ncov/transmission/variant-cases.html. The CDC claims that the data is available in its COVID-19 Data Tracker, but only percentages, not actual case numbers, are available, and the data ends on May 8, 2021.   

Luckily, GISAID is still reporting variant data. The United States has had more isolations of the Alpha variant (B.1.1.7) in the last four weeks (9,795) than any other country in the world, to include the United Kingdom. There have been a total of 160,842 cases of Alpha/B.1.1.7 identified in the US to date. (See chart below.)

At 1,842 cases, the United States has the fourth highest number of isolations of the Beta variant (B.1.351, first identified in South Africa), and 76 of these were in the last four weeks. 

And the United States has now surpassed Brazil for the most isolations of the Gamma variant (P.1) in the world, with 12,887 overall and 1,527 in the past four weeks. 

As for the Delta Variant (B.1.617+), the variant recently identified in India, only India and the United Kingdom have more isolated cases than in the United States, which has 1,888 total cases, 546 of which were identified in the last four weeks. 

The United States has also surpassed both the UK and Nigeria for the most isolations of the Eta varian (B.1.525) in the world, with 1,064 overall and 32 in the past four weeks. 

A disturbing report out of the UK has found a second mutation in Alpha/B.1.1.7. This mutation, which occurs in the loop sequence, has also been found in the Beta/B.1.351 and Gamma/P.1 variants. (The loop sequence is in the receptor binding motif in the receptor binding domain of the S1 sequence of the spike protein.) This mutation involves a change of one amino acid of the spike protein, number 484, from glutamic acid to lysine. This point mutation allows the virus to bind better to the ACE2 receptor, which increases infectivity. People who are exposed to one of these variants (versus the old B2 isolate) are more likely to be infected and are more likely to transmit the virus to others. 

In our last three updates we summarized a research letter published in Clinical Infectious Diseases about a patient in the UK who was first infected in April with a B2 isolate and experienced only mild symptoms but was infected with the new Alpha/B.1.1.7 variant in December and became critically ill. The patient described in this research letter was not protected by a natural infection with a B2 lineage SARS-CoV-2 isolate in April 2020 from having a potentially lethal second infection with a B.1.1.7 lineage variant in December 2020, suggesting that folks who have had a past SARS-CoV-2 infection should not expect to have any immunity to new variants such as Alpha/B.1.1.7. All of the currently available vaccines were developed with spike protein from B2 lineages. Moderna, Pfizer, and AstraZeneca/Oxford are currently remaking their spike protein vaccines to address the mutations in the South African variant of SARS-CoV-2 because the AstraZeneca/Oxford vaccine did not work in a small trial in South Africa, where most of the patients had the Beta/B.1.351 mutant. 

New Mutant Delta/B.1.617+ Arrives in California

Stanford University announced five weeks ago that they have identified five infections with the Delta/B.1.617+ variant in the San Francisco Bay Area. There are actually three different B.1.617 variants: B.1.617.1, B.1.617.2 and B.1.617.3. The most common variant appears to be B.1.617.2. This isolate is a double-mutant responsible for greater than 50% of the infections in India. The data from India the last 14 days ending on 6/04/21 is still disturbing. India has had 2,541,685 infections in the last 14 days or an average of 181,549 infections per day. During this 14-day period India reported 59,354 deaths or 4,240 deaths per day. On May 21, 2021, India reported 121,476 new infections and 3,382 new deaths. On 6/04/21 the total deaths due to SARS-CoV-2 infections in India stood at 344,101. India, with a population of 1,390,456,911, has had only 2.06% of the country infected. Their hospitals are still running out of vaccines, oxygen, medications, beds and ventilators. Sadly a health disaster continues in the world’s most populous country. I would predict that prior SARS-CoV-2 infection in India or first generation SARS-CoV-2 vaccines will have a decreased effect on this mutant discussed in the next paragraph. 

Many of you may now be familiar with the E484K mutation present in the Beta/B.1.351 isolate, the Gamma/P.1 isolate, the Iota/B.1.526 isolate, and the double mutant Eta/B.1.525. When vaccine manufacturers make booster vaccines to address these variants, they will only account for the E484K mutation. What sets this Delta/B.1.617+ variant apart from the other variants is that it has a different point mutation at amino acid 484 that involves a change of one amino acid of the spike protein, number 484, from glutamic acid to glutamine (E484Q). This point mutation, like E484K, probably allows the virus to bind to the ACE2 receptor and evade neutralizing antibodies directed against the original Wuhan sequence. A vaccine created to address E484K would not address this isolate. 

The second mutation in Delta/B.1.617+ is L452R, which is one of the same mutations seen in Epsilon/B.1.427 + B.1.429. This mutation is also not being covered by any vaccine currently being made as a booster. It’s possible that people in California who were infected by the Epsilon mutant in the last six months might have some additional cross protective antibodies to Delta/B.1.617+.

Watching the Data

Over the next few months, we’ll be paying close attention to correlations between the SARS-CoV-2 data, the number of isolates identified in various countries and states, and the non-pharmaceutical interventions (like mask mandates and lockdowns) put in place by state and national governments. Data on infections, deaths, and percent of population infected was compiled from Worldometers. Data for this table for SARS-CoV-2 Isolates Currently Known in Location was compiled from GISAID and the CDC. It’s worth noting that GISAID provided more data than the CDC, whose most recent data on variants is from May 8. 

LocationTotal Infections as of 6/04/21New Infections on 6/04/21Total DeathsNew Deaths on 5/21/21% of Pop.InfectedSARS-CoV-2 Isolates Currently Known in LocationNational/ State Mask Mandate?Currently in Lockdown?
World173,713,909400,0753,736,0999,2832.22%B2 lineageAlpha/B.1.1.7 (UK)Eta/B.1.525 (Nigeria/UK)Iota/B.1.526 (USA-NYC)Beta/B.1.351 (SA)Epsilon/B.1.427 + B.1.429 (USA)*Gamma/P.1 (Brazil)Zeta/P.2 (Brazil)A lineage isolateV01.V2 (Tanzania)APTK India VOC 32421Delta/B.1.617+ (India)BV-1 (Texas, USA)NoNo
USA34,192,023
(ranked #1)
16,925
612,240
(ranked #1)
52010.32%B2 lineageAlpha/B.1.1.7 (UK)Eta/B.1.525 (Nigeria/UK)Iota/B.1.526 (USA-NYC)Beta/B.1.351 (SA)Epsilon/B.1.427 + B.1.429 (USA)*Gamma/P.1 (Brazil)Zeta/P.2 (Brazil)Delta/B.1.617+ (India)BV-1 (Texas, USA)NoNo
Brazil16,841,954(ranked #3)   38,482(ranked #2) 470,968(ranked #2)1,1847.87%B2 lineageAlpha/B.1.1.7 (UK)Beta/B.1.351 (SA)Gamma/P.1 (Brazil)Zeta/P.2 (Brazil)NoNo
India28,693,835(ranked #2)121,476(ranked #1)344,101(ranked #3)3,3822.06%B2 lineageAlpha/B.1.1.7 (UK)Beta/B.1.351 (SA)Epsilon/B.1.427 + B.1.429 (USA)*Eta/B.1.525 (Nigeria/UK)APTK India VOC 32421Delta/B.1.617+ (India)NoNo
United Kingdom4,506,016(ranked #7)6,238127,823116.60%B2 lineageAlpha/B.1.1.7 (UK)Eta/B.1.525 (Nigeria/UK)Beta/B.1.351 (SA)Epsilon/B.1.427 + B.1.429 (USA)*Gamma/P.1 (Brazil)Delta/B.1.617+ (India)NoNo
California, USA3,794,271(ranked #10 in world)1,12963,395529..60%B2 lineageAlpha/B.1.1.7 (UK)Beta/B.1.351 (SA)Epsilon/B.1.427 + B.1.429 (USA)*Zeta/P.2 (Brazil)Delta/B.1.617+ (India)NoNo
Mexico2,426,822(ranked #15)2,894228,362(ranked #4)2161.86%B2 lineageAlpha/B.1.1.7 (UK)Epsilon/B.1.427 + B.1.429 (USA)*Gamma/P.1 (Brazil)Delta/B.1.617+ (India)NoNo
South Africa1,686,041(ranked #19)5,66856,832672.81%B2 lineageAlpha/B.1.1.7 (UK)Beta/B.1.351 (SA)Delta/B.1.617+ (India)NoNo
Canada1,389,508(ranked #23)2,06325,679353.65%B2 lineageAlpha/B.1.1.7 (UK)Eta/B.1.525 (Nigeria/UK)Epsilon/B.1.427 + B.1.429 (USA)*Gamma/P.1 (Brazil)Delta/B.1.617+ (India)Yes, except Alberta ProvinceNo
Poland2,874,409(ranked #14)31774,101267.60%B2 lineageAlpha/B.1.1.7 (UK)Eta/B.1.525 (Nigeria/UK)Beta/B.1.351 (SA)Delta/B.1.617+ (India)NoNo
Turkey5,276,,468(ranked #5)6,16947,976946.19%B2 lineageAlpha/B.1.1.7 (UK)Eta/B.1.525 (Nigeria/UK)Beta/B.1.351 (SA)Epsilon/B.1.427 + B.1.429 (USA)*Gamma/P.1 (Brazil)NoNo
Russia5,108,129(ranked #6)8,947                                                   123,0373773.49%B2 lineageAlpha/B.1.1.7 (UK)Beta/B.1.351 (SA)Delta/B.1.617+ (India)NoNo
Argentina3,915,397(ranked #9)30,95080,4115388.59%B2 lineageAlpha/B.1.1.7 (UK)Eta/B.1.525 (Nigeria/UK)Beta/B.1.351 (SA)Epsilon/B.1.427 + B.1.429 (USA)*Gama/P.1 (Brazil)Delta/B.1.617+ (India)NoNo

*Also referred to as CAL.20C

SARS-CoV-2, Children, and MIS-C/PIMS

I’m pleased to see that COVID-19 cases and MIS-C (PIMS) cases in children in the US are finally getting national attention. The CDC now tracks total MIS-C cases and deaths in children and young adults up to 20 years old in the United States. As of June 2, CDC reported 4,018 cases of MIS-C that meet the case definition and 36 deaths—that’s 276 new cases and one new death since the May 3 report. The CDC notes, “As of October 1, the number of cases meeting the case definition for multisystem inflammatory syndrome in children (MIS-C) in the United States surpassed 1,000. As of February 1, this number surpassed 2,000, and exceeded 3,000 as of April 1.” This means it took seven months to reach 1,000 MIS-C cases, only four months to reach an additional 1,000 cases, and only two months to add an additional 1,185 cases. This suggests to us that Alpha/B.1.1.7 is causing more MIS-C. 

Date of ReportingTotal MIS-C PatientsChange Since Last ReportTotal MIS-C DeathsChange Since Last Report
6/2/20214018+27636+1
5/3/20213742+55735-1
3/29/20213185+56836+3
3/1/2021261733

Schools in the United States have been open throughout the pandemic, with teachers and education support professionals demonstrating their extraordinary ability to adapt in adverse circumstances. Teachers all over the country reinvented their teaching, taking their classrooms online in order to provide safe and remote learning experiences for students. The so-called “reopening” of schools, which more accurately refers to the opening of school buildings, as schools never closed, has been highly politicized, with many governors issuing mandates for in-person instruction, even as case counts, hospitalizations, and deaths in their states rose exponentially. The CDC has maintained that transmission risk in schools is minimal, provided that adequate safety measures are taken; however, we know that many states have not properly enforced universal masking (and some are repealing mask mandates this week), and we know that many school facilities are not equipped with the proper air handling systems. With more school buildings opening, there is a growing body of research that suggests that COVID-19 transmission can and does happen in schools. 

After recommending for months that school buildings be open, in mid-February (a year into the pandemic), The American Academy of Pediatrics, in collaboration with the Children’s Hospital Association, finally began tracking data on COVID-19 in children at the state and national level. Data reporting by states is still voluntary, and every state is different in its willingness to collect and disclose data on infections, hospitalizations, deaths, and testing rates in children. 

As of the APA’s May 27 report, only 11 states provide age distribution for testing. This makes it difficult to hold states accountable for testing each age group in proportion to its population. We’ve seen a trend in states where testing data with age distribution is available that children are tested at lower rates than adults. Hospitalization data by age group is only available in 24 states and New York City, so we only understand the severity of COVID-19 infections in children for about half the country. Age distribution for cases is provided by 49 states, New York City, the District of Columbia, Puerto Rico, and Guam. Age distribution for deaths is provided in 43 states, New York City, Puerto Rico, and Guam. It’s worth noting that New York State does not provide age data for cases, testing, hospitalizations, and deaths. Two states, Florida and Utah, only report cases in children aged 0-14, so the number of cases, hospitalizations, and deaths in children ages 15-17 is unknown in these states. 

As of May 27, A total of 322 child deaths due to COVID-19 were reported in 43 states (an increase of 6 child deaths in one week). In the United States, The following states do not report child mortality due to COVID-19: Michigan, Montana, New Mexico, New York, Rhode Island, South Carolina, and West Virginia. Texas only reports age data for 3% of confirmed COVID-19 cases, so state-level data from Texas is extremely limited for assessing the incidence of COVID-19 in children. Even considering this, Texas reported 52 child deaths. Arizona reported 33, California 23, Colorado 15 (+2), Florida 7, Georgia 10, Illinois 18, Maryland 10, Tennessee 10, Massachusetts 8 (+1), Pennsylvania 11, and New York City 24. 

If we truly want to keep children safe, especially as many school buildings open for in-person instruction, we need to collect more complete data in every state on child testing rates, cases, hospitalizations, and deaths.

The New York Times reports that nationally, children 12 and up have higher vaccination rates than the general population, with 50% of children 12 and up vaccinated, and 53% of children 18 and up fully vaccinated, according to the CDC.

However, some states are falling far behind when it comes to getting children—and the general population—fully vaccinated. Idaho, Alabama, Mississippi, and Louisiana have given at least one shot to less than 10% of children 12-17 years old. Massachusetts, Hawaii, and Vermont are the only three states that have given at least one shot to at least 50% of children 12-15. California has given at least one shot to 36% of children 12-17 years old. 

The Road Ahead

We are on Day 122 of the Biden-Harris administration.The President has made the pandemic a first priority and has now ordered enough vaccines to vaccinate everyone who wants a vaccination by July 2021. As of 6/5/21, 170.8 million people (approximately 51.5% of the population) have had one dose of any vaccine. 138.9 million people (41.9% of the population) are fully vaccinated. 

As of May 10, all people in the U.S. over the age of 12 are eligible to receive a vaccine. The Biden administration has already exceeded its goal of administering 200 million doses of vaccine in the first 100 days of the administration. The Pfizer-BioNtech is already approved for ages 12-15 and the Moderna vaccine should be approved in June 2021. Moderna has applied for emergency use authorization to administer their mRNA vaccines to children aged 12-15. Testing is ongoing for children in younger age groups and may be approved for ages 2-11 by the end of September 2021. 

Testing, wearing masks, social distancing and washing our hands frequently should no longer be political issues. These are non-pharmaceutical interventions used by most successful countries and some states to protect their citizens and their economies. New Zealand, Taiwan, and Australia are three countries that have done this successfully. In the United States, Hawaii is doing a better job handling the pandemic than many of our states. These interventions and vaccination should keep the pandemic from overwhelming our health care delivery systems world-wide. New mutations like Epsilon/B.1.427 + B.1.429 and the Alpha, Beta, Gamma, and Delta variants will probably spread rapidly throughout the United States over the next 90 days as many states (ex. Texas, Florida, Iowa, Mississippi, Wyoming and South Carolina) open up everything and do away with masking and social distancing. We will probably see increased new infections per day in the United States. In the UK, Alpha/B.1.1.7, has increased the number of infections, hospitalizations and deaths. This and other mutants may do the same thing in the USA.

The Pfizer and Moderna RNA vaccines and the Johnson & Johnson single dose vaccination adenovirus vaccine are all being used to immunize people in the USA. The Oxford-AstraZeneca vaccine and the Novavax vaccine may be available in the fourth quarter of 2021. 

The bad news is that all currently available vaccines are based on the spike protein sequence identified in China in December 2019. Mutated isolates, as discussed above, may overtake our ability to produce new vaccines and vaccinate the populace. Like Influenza vaccines, we may have to reformulate vaccines based on active, worldwide surveillance at least every 4 to 6 months. The FDA is currently putting together a guidance document for how to develop booster vaccines for SARS-CoV-2 mutations. A surrogate marker of protection like antibody to the mutated Receptor Binding Domains of SARS-CoV-2 should be considered for vaccine approval. 

The ideal approach to addressing the major mutations on at least five continents would be to make vaccines against each of the mutations. I’d get all of the vaccine companies and contract production companies on a call and “suggest” that two companies at least make and mass produce one of the four mutations. The government would pay the cost and buy at least 200 million doses in advance for each variant at say $40 a dose. The total cost to purchase the vaccine (800 million doses) would only be 32 billion dollars. Give each company a billion dollars each for development costs (another 8 billion dollars). Spend another two billion dollars for syringes and you’ve got enough booster doses to vaccinate 200 million people for all 4 variants. 42 billion dollars would be a small price to pay to catch up with the current mutations. Even if you had to do this every two years, it would be well worth the dollars spent. 

We are not doing adequate numbers of PCR or antigen detection assays in the United States. According to JHU, in January of 2021, we were doing up to 2,307,949 tests per day. In March 2021, the highest number of tests per day was 1,709,210, and in April, the highest number of tests per day was 2,008,319. Currently, we’re doing 710,675 tests per day (7-day moving average); that’s 1,297,644 fewer tests per day than the April high. 

We still need to perform more virus isolations and perform more DNA sequencing of viruses in each country, state, populous city, and county if we are to rapidly identify new mutations. I’m more hopeful that we will have the facilities, the equipment, and the trained staff needed to perform this work. As a nation we still need to make and distribute more vaccines to other countries, new vaccines directed against mutants, and the necessary rapid tests and protective equipment needed by medical staff, first responders, essential workers and especially teachers and students. I’m still hopeful we can work together on our and the world’s infectious disease problems. 

What Our Team Is Reading This Week