It’s time for our next 14-day moving average determinations for SARS-CoV-2 for the United States and my thoughts on vaccines and mutant viruses. We use the WORLDOMETERS aggregators data set to make any projections since it includes data from the Department of Veterans Affairs, the U.S. Military, federal prisons and the Navajo Nation.


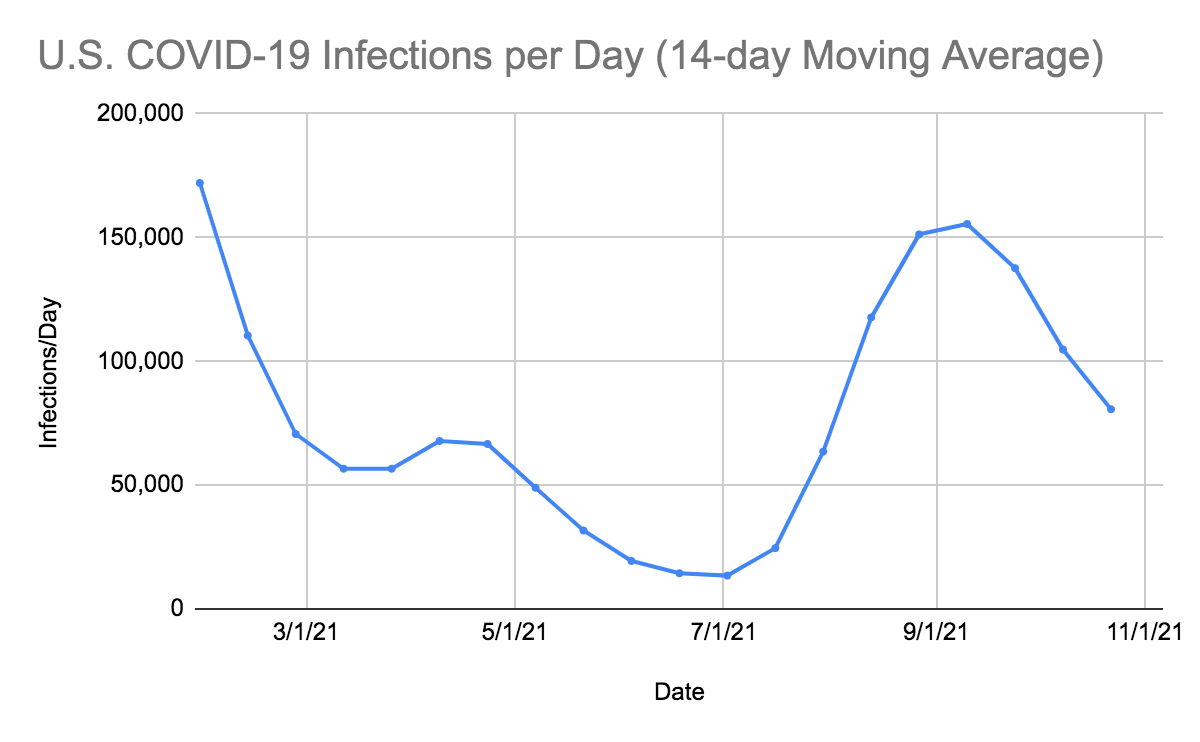
n the United States, SARS-CoV-2 deaths have decreased for the second time in seventeen 14-day periods. There were 282 fewer deaths per day than in the last 14-day period. In the last 14 days, the number of infections has decreased by 24,140 infections per day compared to the preceding 14-day period. Our infections per day have decreased for the third time over the last 14 weeks. This trend will continue. Increased vaccinations, increased mask usage and social distancing, which are a part of the Biden SARS-CoV-2 plan continue to stop the further spread of mutants and reduce infections, hospitalizations, and deaths. On 10/22/21, the United States had 82,483 new infections with one state failing to report (Iowa). There were also 1,610 deaths (with seven other states failing to report deaths). Florida continues to consistently under-report daily infections and deaths. The number of hospitalized patients is decreasing in many areas and only 14,232 patients are seriously or critically ill; that number was 17,497 two weeks ago. The number of critically ill patients has decreased by 3,265 in the last 14 days, while at least 23,244 new deaths occurred. The number of critically ill patients has decreased for the fourth time in eight 14-day periods but a large number of patients are still dying each day (average 1,660/day).
As of 10/22/21, we have had 755,721 deaths and 46,246,596 SARS-CoV-2 infections in the United States. We have had 1,128,976 new infections in the last 14 days. We are adding an average of 564,488 infections every seven days. For the pandemic in the United States we are averaging one death for every 61 infections reported or over 16,341 deaths for each one million infections. As of 10/22/21, thirty-one states have had greater than 500,000 total infections, and 33 states have had greater than 5,000 total deaths. Eleven states (Ohio, Michigan, Georgia, Illinois, New Jersey, Pennsylvania, Florida, Texas, New York, Arizona and California) have had greater than 20,000 deaths. Four states (Florida, Texas, New York, and California) have had greater than 50,000 deaths.
On 11/20/20 in the United States, 3.70% of the population had a documented SARS-CoV-2 infection. California was ranked 41st in infection percentage at 2.77%. In North Dakota 9.18% of the population was infected (ranked #1), and in South Dakota 8.03% of the population was infected (ranked #2). As of 10/22/21, in the United States, 13.87% of the population has had a documented SARS-CoV-2 infection. In the last 11 months, over 10% of our country became infected with SARS-CoV-2. On 11/20/20, there were 260,331 (cumulative) deaths in the US from SARS-CoV-2. In the last 11 months, there were 495,390 new deaths from SARS-CoV-2. For nearly five of those months, vaccines have been available to all adults. During these five months, 160,810 people have died of SARS-CoV-2 infections. Many of these hospitalizations and deaths could have been prevented by vaccination, proper masking, and social distancing.
As of 10/22/21, California was ranked 40th in infection percentage at 12.03% and 9.25% of Californians were infected in the last 11 months. And now let’s look at the top 20 infected states, which is not a list that you’d like to be on in 2021. North Dakota was at 18.90% (ranked #1),Tennessee was at 18.63% (ranked #2), Alaska was at 17.50% (ranked #3), Wyoming 17.30% (ranked #4), South Carolina was at 17.30% (ranked #5), South Dakota was at 17.21% (ranked #6), Florida was at 17.14% (ranked #7), Arkansas was at 16.88% (ranked #8), Mississippi was at 16.83% (ranked #9), Utah at 16.80% (ranked #10), Rhode Island was at 16.80% (ranked #11), Alabama was at 16.69% (ranked #12), Kentucky was at 16.43% (ranked #13), Iowa was at 16.31% (ranked #14), Louisiana was at 16.25% (ranked #15), Oklahoma was at 16.14% (ranked #16), Montana was at 15.95% (ranked #17), Idaho was at 15.90% (ranked #18), Arizona was at 15.73% (ranked #19) and Georgia was at 15.30% of the population infected (ranked #20). Thirty-six states now have greater than 12% of their population infected. Only one state has less than 6% of their population infected: Hawaii (5.85%). Vermont is at (6.14%). Hawaii, Vermont, and the US Virgin Islands still remain the safest places in the United States.
The table below shows that if we rank the US states with the highest death rates per million population within the world rankings, we see that Mississippi has the fourth highest COVID-19 deaths per million in the world. New York would be 6th. New Jersey, Louisiana, and Alabama would be tied at the 7th highest number of deaths per million in the world, followed by Arizona (8th) and Massachusetts, Rhode Island, Arkansas, and Florida tied at 10th.
The United States as a whole ranks 34th in the world for deaths per million population (2,266 deaths per million). California ranks 35th in the USA (and 34th in the world). If we look at the death rates per million in South Korea (53), Iceland (96), Japan (144), and Israel (862), they suggest that treatment outcomes are somehow different in these three countries. The same phenomenon can be seen in Scandinavia, where the death rate in Sweden is 1,469 per million, compared to 163 per million in Norway and 212 per million in Finland. The United States should take a closer look at how countries with low death rates (like South Korea, Iceland, Japan, Finland, and Norway) are preventing COVID-19 infections and treating COVID-19 patients.
| State or Country | COVID-19 Deaths per million population | Rank in USA | Ranked within World |
| Mississippi | 3,357 | 1st | 4th |
| New Jersey | 3,133 | 3rd | 7th tied |
| Louisiana | 3,111 | 4th | 7th tied |
| New York | 2,915 | 5th | 6th |
| Alabama | 3,136 | 2nd | 7th tied |
| Arizona | 2,861 | 6th | 8th |
| Massachusetts | 2,744 | 7th | 10th tied |
| Rhode Island | 2,711 | 10th | 10th tied |
| Arkansas | 2,735 | 8th | 10th tied |
| Florida | 2,729 | 9th | 10th tied |
| California | 1,810 | 35th | 34th |
| USA | 2,266 | 20th | |
| Peru | 5,958 | 1st | |
| Bosnia-Herzegovina | 3,479 | 2nd | |
| North Macedonia | 3,369 | 3rd | |
| Hungary | 3,167 | 6th | |
| Montenegro | 3,275 | 4th | |
| Bulgaria | 3,275 | 5th | |
| Gibraltar | 2,910 | 7th | |
| Czechia | 2,851 | 8th | |
| Brazil | 2,821 | 9th | |
| San Marino | 2,675 | 10th | |
| Sweden | 1,4609 | 52nd | |
| Israel | 862 | 83rd | |
| Canada | 753 | 91st | |
| Finland | 212 | 136th | |
| Norway | 163 | 147th | |
| Japan | 144 | 149th | |
| Iceland | 96 | 160th | |
| South Korea | 53 | 175th |
The Threat of SARS-CoV-2 Variants
In response to the need for “easy-to-pronounce and non-stigmatising labels,” at the end of May, the World Health Organization assigned a letter from the Greek alphabet to each SARS-CoV-2 variant. GISAID, Nextstrain, and Pango will continue to use the previously established nomenclature. For our purposes, we’ll be referring to each variant by both its Greek alphabet letter and the Pango nomenclature.
The WHO has sorted variants into two categories: Variants of Concern (VOC) and Variants of Interest (VOI). The criteria for Variants of Concern are as follows:
- Increase in transmissibility or detrimental change in COVID-19 epidemiology; or
- Increase in virulence or change in clinical disease presentation; or
- Decrease in effectiveness of public health and social measures or available diagnostics, vaccines, therapeutics.
The WHO categorizes the following four variants as Variants of Concern (VOC):

The criteria for Variants of Interest (VOI) are as follows:
- has been identified to cause community transmission/multiple COVID-19 cases/clusters, or has been detected in multiple countries; OR
- is otherwise assessed to be a VOI by WHO in consultation with the WHO SARS-CoV-2 Virus Evolution Working Group.
The WHO categorizes the following six variants as Variants of Interest (VOI):


Watching World Data
Over the next few months, we’ll be paying close attention to correlations between the SARS-CoV-2 data, the number of isolates identified in various countries and states, and the non-pharmaceutical interventions (like mask mandates and lockdowns) put in place by state and national governments. Data on infections, deaths, and percent of population infected was compiled from Worldometers. Data for this table for SARS-CoV-2 Isolates Currently Known in Location was compiled from GISAID and the CDC. It’s worth noting that GISAID provided more data than the CDC.
| Location | Total Infections as of 10/22/21 | New Infections on10/22/21 | Total Deaths | New Deaths on 10/22/21 | % of Pop.Infected | SARS-CoV-2 Isolates Currently Known in Location | National/ State Mask Mandate? | Currently in Lockdown? |
| World | 243,714,456(5,740,195 new infections in 14 days; a decrease of 368,066 infections from the preceding 14 days) | 458,950 | 4,953,025(96,223 deaths in 14 days; a decrease of 9,990 new deaths from the preceding 14 days). | 7,805 | 3.12% | B2 lineageAlpha/B.1.1.7 (UK)Eta/B.1.525 (Nigeria/UK)Iota/B.1.526 (USA-NYC)Beta/B.1.351 (SA)Epsilon/B.1.427 + B.1.429 (USA)*Gamma/P.1 (Brazil)Zeta/P.2 (Brazil)A lineage isolateV01.V2 (Tanzania)APTK India VOC 32421Delta/B.1.617.2 (India)BV-1 (Texas, USA)Kappa/B.1.617.1 (India)Lambda/C.37 (Peru)Theta/P.3 (Philippines) Mu/B.1.621 (Colombia)C.1.2 (South Africa 2% of isolates in July 2021)R1 (Japan) | No | No |
| USA | 46,264,596 (ranked #1) 1,128,976 new infections in the last 14 days) | 82,483 (ranked #1) | 755,721 (ranked #1)23,244 new deaths in the last 14 days) | 1,610 | 13.87% | B2 lineageAlpha/B.1.1.7 (UK)Eta/B.1.525 (Nigeria/UK)Iota/B.1.526 (USA-NYC)Beta/B.1.351 (SA)Epsilon/B.1.427 + B.1.429 (USA)*Gamma/P.1 (Brazil)Zeta/P.2 (Brazil)Delta/B.1.617.2 (India)BV-1 (Texas, USA)Theta/P.3 (Philippines) Theta/P.3 (Philippines) Kappa/B.1.617.1 (India)Lambda/C.37 (Peru)Mu/B.1.621 (Colombia)R1(Japan) | No | No |
| Brazil | 21,711,843(ranked #3) | 14,502 | 605,211(ranked #2) | 447 | 10.12% | B2 lineageAlpha/B.1.1.7 (UK)Beta/B.1.351 (SA)Gamma/P.1 (Brazil)Zeta/P.2 (Brazil)Lambda/C.37 (Peru)Mu/B.1.621 (Colombia) | No | No |
| India | 34,158,772(ranked #2) | 16,331 | 453,742(ranked #3) | 666 | 2.44% | B2 lineageAlpha/B.1.1.7 (UK)Beta/B.1.351 (SA)Gamma/P.1 (Brazil)Epsilon/B.1.427 + B.1.429 (USA)*Eta/B.1.525 (Nigeria/UK)APTK India VOI 32421Delta/B.1.617.2 (India)Kappa/B.1.617.1 (India)Iota/B.1.526 (USA-NYC) | No | No |
| United Kingdom | 8,689,949(ranked #4; was #6 eight weeks ago) | 49,298 | 139,326 | 180 | 12.71% | B2 lineageAlpha/B.1.1.7 (UK)Eta/B.1.525 (Nigeria/UK)Beta/B.1.351 (SA)Epsilon/B.1.427 + B.1.429 (USA)*Gamma/P.1 (Brazil)Delta/B.1.617.2 (India)Theta/P.3 (Philippines) Kappa/B.1.617.1 (India)Lambda/C.37 (Peru)Mu/B.1.621 (Colombia)C.1.2 (South Africa) | No | No |
| California, USA | 4,755,586(ranked #12 in world) | 6,966 | 71,525 | 119 | 12.03% | B2 lineageAlpha/B.1.1.7 (UK)Eta/B.1.525 (Nigeria/UK)Beta/B.1.351 (SA)Gamma/P.1 (Brazil)Epsilon/B.1.427 + B.1.429 (USA)*Zeta/P.2 (Brazil)Delta/B.1.617.2 (India)Theta/P.3 (Philippines) Kappa/B.1.617.1 (India)Lambda/C.37 (Peru) Mu/B.1.621 (Colombia) | No | No |
| Mexico | 3,772,556(ranked #15) | 4,798 | 285,669(ranked #4) | 322 | 2.85% | B2 lineageAlpha/B.1.1.7 (UK)Epsilon/B.1.427 + B.1.429 (USA)*Gamma/P.1 (Brazil)Delta/B.1.617.2 (India)Kappa/B.1.617.1 (India)Lambda/C.37 (Peru)Mu/B.1.621 (Colombia) | No | No |
| South Africa | 2,918,8883(ranked #17) | 517 | 88,891 | 56 | 4.84% | B2 lineageAlpha/B.1.1.7 (UK)Beta/B.1.351 (SA)Delta/B.1.617.2 (India)Kappa/B.1.617.1 (India) | No | No |
| Canada | 1,695,914(ranked #27) | 2,745 | 28,729 | 62 | 4.44% | B2 lineageAlpha/B.1.1.7 (UK)Eta/B.1.525 (Nigeria/UK)Epsilon/B.1.427 + B.1.429 (USA)*Gamma/P.1 (Brazil)Delta/B.1.617.2 (India)Kappa/B.1.617.1 (India)Lambda/C.37 (Peru)Mu/B.1.621 (Colombia) | Yes, except Alberta Province | No |
| Poland | 2,961,923(ranked #16) | 5,706 | 76,359 | 59 | 7.83% | B2 lineageAlpha/B.1.1.7 (UK)Eta/B.1.525 (Nigeria/UK)Beta/B.1.351 (SA)Delta/B.1.617.2 (India)Mu/B.1.621 (Colombia) | No | No |
| Turkey | 7,800,796(ranked #6) | 28,192 | 68,700 | 228 | 9.12% | B2 lineageAlpha/B.1.1.7 (UK)Eta/B.1.525 (Nigeria/UK)Beta/B.1.351 (SA)Epsilon/B.1.427 + B.1.429 (USA)*Gamma/P.1 (Brazil)Lambda/C.37 (Peru)Mu/B.1.621 (Colombia) | No | No |
| Russia | 8,168,305(ranked #5) | 37,141 | 228,453(ranked #5) | 1,064 | 5.59% | B2 lineageAlpha/B.1.1.7 (UK)Beta/B.1.351 (SA)Delta/B.1.617.2 (India) | No | No |
| Argentina | 5,278,910(ranked #9) | 1,385 | 115,819 | 23 | 11.54% | B2 lineageAlpha/B.1.1.7 (UK)Eta/B.1.525 (Nigeria/UK)Beta/B.1.351 (SA)Epsilon/B.1.427 + B.1.429 (USA)*Gama/P.1 (Brazil)Delta/B.1.617.2 (India)Lambda/C.37 (Peru) | No | No |
| Colombia | 4,988,021(ranked #11) | 1,772 | 126,994 | 35 | 9.66% | B2 lineageAlpha/B.1.1.7 (UK)Beta/B.1.351 (SA)Gamma/P.1 (Brazil)Epsilon/B.1.427 + B.1.429 (USA)*Iota/B.1.526 (USA-NYC)Lambda/C.37 (Peru)Mu/B.1.621 (Colombia) | No | No |
| Peru | 2,194,132(ranked #21) | 1,043 | 299,003(ranked #6) | 25 | 6.53% | B2 lineageAlpha/B.1.1.7 (UK)Delta/B.1.617.2 (India)Gamma/P.1 (Brazil)Iota/B.1.526 (USA-NYC)Lambda/C.37 (Peru)Mu/B.1.621 (Colombia) | No | No |
| Indonesia | 4,238,594(ranked #14) | 760 | 143,153 | 33 | 1.52% | B2 lineageAlpha/B.1.1.7 (UK)Delta/B.1.617.2 (India)Beta/B.1.351 (SA)Eta/B.1.525 (Nigeria/UK)Theta/P.3 (Philippines) Iota/B.1.526 (USA-NYC)Kappa/B.1.617.1 (India) | No | No |
| Iran | 5,844,589(ranked 8th; was 12th eight weeks ago) | 11,064 | 124,928 | 165 | 6.84% | B2 lineageAlpha/B.1.1.7 (UK)Delta/B.1.617.2 (India)Beta/B.1.351 (SA) | No | No |
| Spain | 4,997,732(ranked 10th) | 2,556 | 87,132 | 30 | 10.68% | B2 lineageAlpha/B.1.1.7 (UK)Delta/B.1.617.2 (India)Beta/B.1.351 (SA)Gamma/P.1 (Brazil)Epsilon/B.1.427 + B.1.429 (USA)*Eta/B.1.525 (Nigeria/UK)Iota/B.1.526 (USA-NYC)Kappa/B.1.617.1 (India)Mu/B.1.621 (Colombia) | No | No |
What Our Team Is Reading This Week
- SARS-CoV-2 variants of concern and variants under investigation in England Technical briefing 25 https://assets.publishing.service.gov.uk/government/uploads/system/uploads/attachment_data/file/1025827/Technical_Briefing_25.pdf
- SARS-CoV-2 variants of concern and variants under investigation in England Technical briefing 26 https://assets.publishing.service.gov.uk/government/uploads/system/uploads/attachment_data/file/1028113/Technical_Briefing_26.pdf
- Heterologous SARS-CoV-2 Booster Vaccinations – Preliminary Report (Preprint) https://doi.org/10.1101/2021.10.10.21264827
- An objective systematic comparison of the most common adverse events of COVID-19 vaccines (Preprint) https://doi.org/10.1101/2021.10.11.21264830
- LSU Health Shreveport has discovered a new variant of COVID-19 in Louisiana (Shreveport Times) https://www.shreveporttimes.com/story/news/local/2021/10/13/new-covid-variant-reported-louisiana-lsu-health/8437214002/
- Waning Immune Humoral Response to BNT162b2 Covid-19 Vaccine over 6 Months (NEJM) https://www.nejm.org/doi/full/10.1056/NEJMoa2114583
- Pandemics Throughout History (Frontiers in Microbiology) https://dx.doi.org/10.3389%2Ffmicb.2020.631736
- A novel B.1.1.523 SARS-CoV-2 variant that combines many spike mutations linked to immune evasion with current variants of concern (Preprint) https://www.biorxiv.org/content/10.1101/2021.09.16.460616v1
- Pediatric COVID-19 Cases in Counties With and Without School Mask Requirements — United States, July 1–September 4, 2021 (MMWR) http://dx.doi.org/10.15585/mmwr.mm7039e3
- Association Between K–12 School Mask Policies and School-Associated COVID-19 Outbreaks — Maricopa and Pima Counties, Arizona, July–August 2021 (MMWR) http://dx.doi.org/10.15585/mmwr.mm7039e1
- Distribution of SARS-CoV-2 Variants in a Large Integrated Health Care System — California, March–July 2021 (MMWR) http://dx.doi.org/10.15585/mmwr.mm7040a4
- Charlson Comorbidity Index (CCI) https://www.mdcalc.com/charlson-comorbidity-index-cci
- Decreased Incidence of Infections Caused by Pathogens Transmitted Commonly Through Food During the COVID-19 Pandemic — Foodborne Diseases Active Surveillance Network, 10 U.S. Sites, 2017–2020 (MMWR) http://dx.doi.org/10.15585/mmwr.mm7038a4
- Will Covid Overwhelm Our Vaccines? (Forbes) https://www.forbes.com/sites/williamhaseltine/2021/10/08/will-covid-overwhelm-our-vaccines/?sh=29b94be17cff
- Anti-Covid Drugs Are Coming, But At What Cost? (Forbes) https://www.forbes.com/sites/williamhaseltine/2021/10/08/anti-covid-drugs-are-coming-but-at-what-cost/?sh=7add6fa377a1
- Safety and Efficacy of NVX-CoV2373 Covid-19 Vaccine (NEJM) https://www.nejm.org/doi/full/10.1056/NEJMoa2107659
- Phase 3 Safety and Efficacy of AZD1222 (ChAdOx1 nCoV-19) Covid-19 Vaccine (NEJM) https://www.nejm.org/doi/full/10.1056/NEJMoa2105290?query=featured_coronavirus
- Mix-and-match COVID vaccines trigger potent immune response (Nature) https://www.nature.com/articles/d41586-021-01359-3
- Is the R.1 variant in the Bay Area? What to know about the highly mutated COVID strain (SF Chronicle) https://www.sfchronicle.com/health/article/Is-the-R-1-variant-in-the-Bay-Area-What-to-know-16483185.php
- Closest known relatives of virus behind COVID-19 found in Laos (Nature) https://www.nature.com/articles/d41586-021-02596-2
- Children of America, You’ve Been Gaslit at Lunchtime (Psychology Today) https://www.psychologytoday.com/us/blog/compassion-works/202109/children-america-you-ve-been-gaslit-lunchtime
- Who’s dying in California from COVID-19? (CalMatters) https://calmatters.org/health/coronavirus/2021/09/covid-california-deaths/
- The continuous evolution of SARS-CoV-2 in South Africa: a new lineage with rapid accumulation of mutations of concern and global detection (Preprint) https://www.medrxiv.org/content/10.1101/2021.08.20.21262342v1.full
- Is This The Next Variant Of Concern— C.1.2? (Haseltine for Forbes) https://www.forbes.com/sites/williamhaseltine/2021/09/03/is-this-the-next-variant-of-concern–c12/?sh=2860a8094680
- Personal protective equipment does not sufficiently protect against virus aerosol unless combined with advanced air purification or ventilation techniques | medRxiv https://www.medrxiv.org/content/10.1101/2021.09.02.21263008v1
- Israel’s home COVID-19 tests keep 180,000 students in school – Israel News – Haaretz.com https://www.haaretz.com/israel-news/.premium-israel-s-home-covid-19-tests-keep-180-000-students-in-school-1.10182409
- JCI – The autoimmune signature of hyperinflammatory multisystem inflammatory syndrome in children https://www.jci.org/articles/view/151520
- Patterns of SARS-CoV-2 aerosol spread in typical classrooms – ScienceDirect https://www.sciencedirect.com/science/article/pii/S0360132321005680
- Starr, T.N., Czudnochowski, N., Liu, Z. et al. SARS-CoV-2 RBD antibodies that maximize breadth and resistance to escape. Nature 597, 97–102 (2021). https://doi.org/10.1038/s41586-021-03807-6

You must be logged in to post a comment.